Cities with the Lowest Poverty Level Among Families in Nevada
RELATED REPORTS & OPTIONS
Lowest Family Poverty
Nevada
Compare Cities
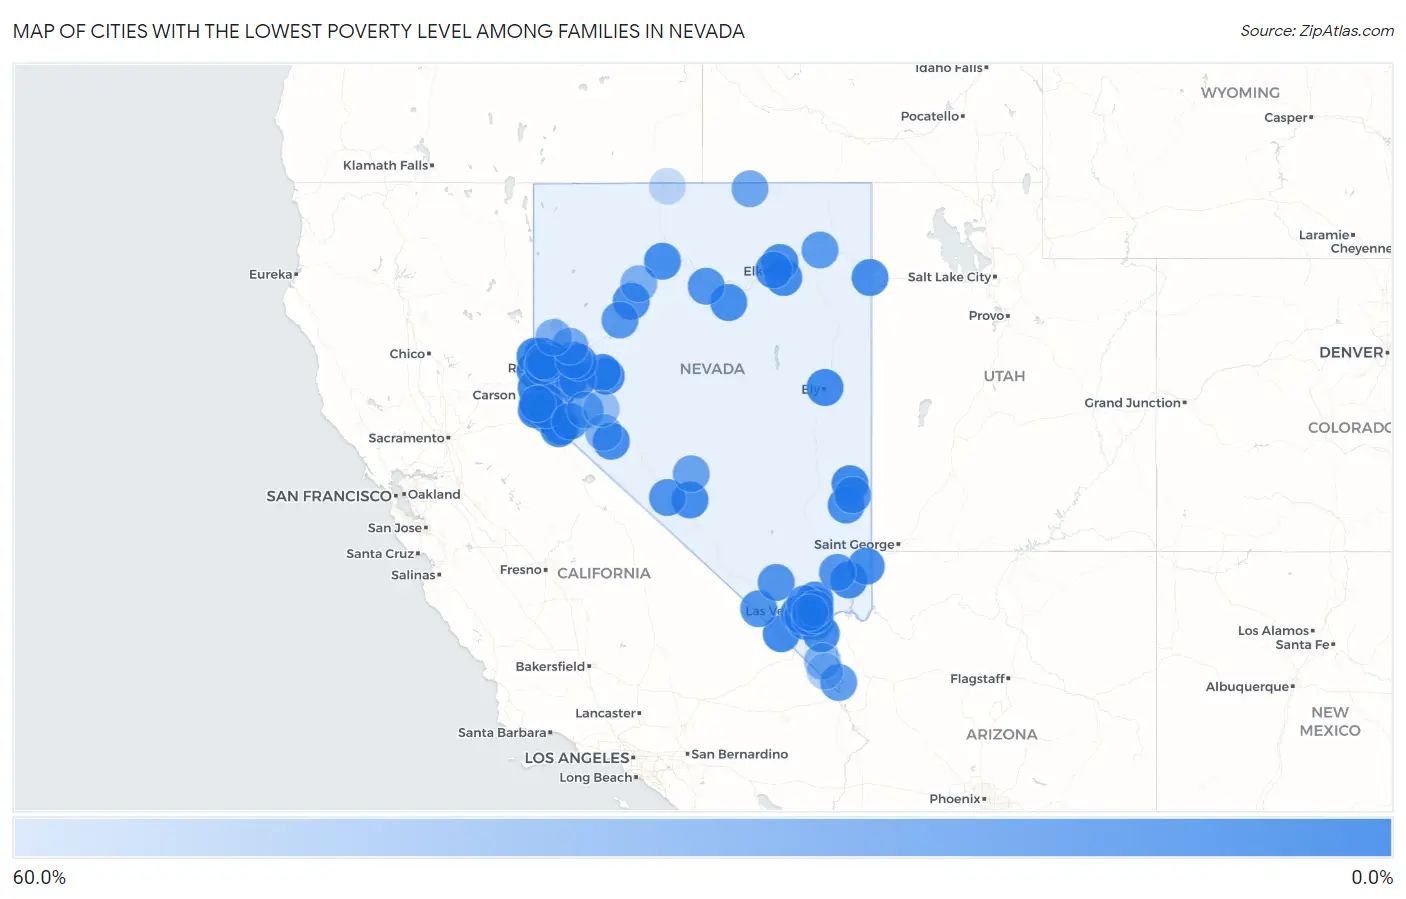
Map of Cities with the Lowest Poverty Level Among Families in Nevada
60.0%
0.0%
Cities with the Lowest Poverty Level Among Families in Nevada
| City | Family Poverty | vs State | vs National | |
| 1. | Fish Springs | 0.61% | 9.0%(-8.42)#1 | 8.8%(-8.17)#166 |
| 2. | Lemmon Valley | 1.4% | 9.0%(-7.64)#2 | 8.8%(-7.38)#1,001 |
| 3. | Verdi | 1.6% | 9.0%(-7.46)#3 | 8.8%(-7.20)#1,261 |
| 4. | Spanish Springs | 1.8% | 9.0%(-7.21)#4 | 8.8%(-6.96)#1,620 |
| 5. | Stagecoach | 2.2% | 9.0%(-6.83)#5 | 8.8%(-6.58)#2,182 |
| 6. | Dayton | 2.5% | 9.0%(-6.56)#6 | 8.8%(-6.31)#2,633 |
| 7. | Round Hill Village | 2.8% | 9.0%(-6.27)#7 | 8.8%(-6.01)#3,135 |
| 8. | Ely | 3.6% | 9.0%(-5.43)#8 | 8.8%(-5.18)#4,554 |
| 9. | Sandy Valley | 3.7% | 9.0%(-5.35)#9 | 8.8%(-5.10)#4,678 |
| 10. | Johnson Lane | 3.7% | 9.0%(-5.30)#10 | 8.8%(-5.05)#4,787 |
| 11. | Cold Springs | 3.8% | 9.0%(-5.23)#11 | 8.8%(-4.98)#4,886 |
| 12. | Incline Village | 4.0% | 9.0%(-5.03)#12 | 8.8%(-4.77)#5,208 |
| 13. | Pioche | 4.2% | 9.0%(-4.85)#13 | 8.8%(-4.60)#5,470 |
| 14. | East Valley | 4.3% | 9.0%(-4.73)#14 | 8.8%(-4.48)#5,670 |
| 15. | Summerlin South | 4.5% | 9.0%(-4.50)#15 | 8.8%(-4.25)#6,020 |
| 16. | Fallon Station | 4.5% | 9.0%(-4.49)#16 | 8.8%(-4.24)#6,033 |
| 17. | Moapa Valley | 5.0% | 9.0%(-4.05)#17 | 8.8%(-3.80)#6,713 |
| 18. | Topaz Ranch Estates | 5.0% | 9.0%(-4.04)#18 | 8.8%(-3.78)#6,740 |
| 19. | Spring Creek | 5.0% | 9.0%(-4.02)#19 | 8.8%(-3.77)#6,789 |
| 20. | Gardnerville Ranchos | 5.1% | 9.0%(-3.95)#20 | 8.8%(-3.69)#6,912 |
| 21. | Fallon | 5.2% | 9.0%(-3.81)#21 | 8.8%(-3.56)#7,098 |
| 22. | Caliente | 5.2% | 9.0%(-3.81)#22 | 8.8%(-3.56)#7,099 |
| 23. | Crescent Valley | 5.4% | 9.0%(-3.67)#23 | 8.8%(-3.41)#7,340 |
| 24. | Winnemucca | 5.4% | 9.0%(-3.64)#24 | 8.8%(-3.38)#7,378 |
| 25. | Mesquite | 5.4% | 9.0%(-3.62)#25 | 8.8%(-3.37)#7,413 |
| 26. | Henderson | 5.5% | 9.0%(-3.56)#26 | 8.8%(-3.31)#7,520 |
| 27. | Gardnerville | 5.5% | 9.0%(-3.49)#27 | 8.8%(-3.23)#7,603 |
| 28. | Ruhenstroth | 5.8% | 9.0%(-3.20)#28 | 8.8%(-2.94)#8,056 |
| 29. | Carter Springs | 5.9% | 9.0%(-3.11)#29 | 8.8%(-2.86)#8,197 |
| 30. | Osino | 6.0% | 9.0%(-3.07)#30 | 8.8%(-2.82)#8,247 |
| 31. | Sparks | 6.0% | 9.0%(-3.06)#31 | 8.8%(-2.81)#8,262 |
| 32. | Topaz Lake | 6.1% | 9.0%(-2.98)#32 | 8.8%(-2.72)#8,397 |
| 33. | West Wendover | 6.2% | 9.0%(-2.83)#33 | 8.8%(-2.58)#8,596 |
| 34. | Enterprise | 6.2% | 9.0%(-2.81)#34 | 8.8%(-2.55)#8,622 |
| 35. | Genoa | 6.4% | 9.0%(-2.67)#35 | 8.8%(-2.41)#8,876 |
| 36. | Indian Hills | 6.4% | 9.0%(-2.63)#36 | 8.8%(-2.38)#8,927 |
| 37. | Hawthorne | 6.5% | 9.0%(-2.56)#37 | 8.8%(-2.30)#9,035 |
| 38. | Boulder City | 6.5% | 9.0%(-2.55)#38 | 8.8%(-2.29)#9,048 |
| 39. | Goldfield | 6.6% | 9.0%(-2.48)#39 | 8.8%(-2.22)#9,156 |
| 40. | Stateline | 6.9% | 9.0%(-2.17)#40 | 8.8%(-1.92)#9,543 |
| 41. | Silver Springs | 7.1% | 9.0%(-1.93)#41 | 8.8%(-1.67)#9,858 |
| 42. | Reno | 7.3% | 9.0%(-1.71)#42 | 8.8%(-1.46)#10,167 |
| 43. | Fernley | 7.4% | 9.0%(-1.68)#43 | 8.8%(-1.42)#10,224 |
| 44. | Humboldt River Ranch | 7.5% | 9.0%(-1.51)#44 | 8.8%(-1.25)#10,451 |
| 45. | Minden | 7.7% | 9.0%(-1.32)#45 | 8.8%(-1.06)#10,694 |
| 46. | Carson | 8.1% | 9.0%(-0.910)#46 | 8.8%(-0.655)#11,215 |
| 47. | Elko | 8.1% | 9.0%(-0.906)#47 | 8.8%(-0.651)#11,223 |
| 48. | Nellis Afb | 8.3% | 9.0%(-0.757)#48 | 8.8%(-0.502)#11,420 |
| 49. | Spring Valley | 9.0% | 9.0%(-0.048)#49 | 8.8%(+0.207)#12,289 |
| 50. | Silver Peak | 9.8% | 9.0%(+0.719)#50 | 8.8%(+0.974)#13,175 |
| 51. | North Las Vegas | 9.9% | 9.0%(+0.824)#51 | 8.8%(+1.08)#13,297 |
| 52. | Pahrump | 10.0% | 9.0%(+0.979)#52 | 8.8%(+1.23)#13,495 |
| 53. | Panaca | 10.1% | 9.0%(+1.04)#53 | 8.8%(+1.30)#13,545 |
| 54. | Lakeridge | 10.4% | 9.0%(+1.34)#54 | 8.8%(+1.60)#13,850 |
| 55. | Indian Springs | 10.5% | 9.0%(+1.43)#55 | 8.8%(+1.69)#13,952 |
| 56. | Las Vegas | 10.7% | 9.0%(+1.70)#56 | 8.8%(+1.96)#14,228 |
| 57. | Battle Mountain | 10.7% | 9.0%(+1.71)#57 | 8.8%(+1.97)#14,238 |
| 58. | Moapa Town | 12.3% | 9.0%(+3.30)#58 | 8.8%(+3.56)#15,734 |
| 59. | Amargosa Valley | 12.8% | 9.0%(+3.73)#59 | 8.8%(+3.98)#16,065 |
| 60. | Paradise | 12.8% | 9.0%(+3.81)#60 | 8.8%(+4.06)#16,131 |
| 61. | Whitney | 13.0% | 9.0%(+3.95)#61 | 8.8%(+4.21)#16,249 |
| 62. | Lovelock | 13.1% | 9.0%(+4.05)#62 | 8.8%(+4.31)#16,340 |
| 63. | Smith Valley | 13.8% | 9.0%(+4.74)#63 | 8.8%(+5.00)#16,864 |
| 64. | Sun Valley | 14.1% | 9.0%(+5.03)#64 | 8.8%(+5.28)#17,081 |
| 65. | Wells | 14.6% | 9.0%(+5.57)#65 | 8.8%(+5.83)#17,506 |
| 66. | Laughlin | 15.2% | 9.0%(+6.13)#66 | 8.8%(+6.39)#17,887 |
| 67. | Golden Valley | 15.5% | 9.0%(+6.43)#67 | 8.8%(+6.69)#18,079 |
| 68. | Sunrise Manor | 18.3% | 9.0%(+9.22)#68 | 8.8%(+9.47)#19,591 |
| 69. | Wadsworth | 19.0% | 9.0%(+9.98)#69 | 8.8%(+10.2)#19,977 |
| 70. | Tonopah | 19.6% | 9.0%(+10.6)#70 | 8.8%(+10.9)#20,218 |
| 71. | Winchester | 21.1% | 9.0%(+12.1)#71 | 8.8%(+12.4)#20,839 |
| 72. | Yerington | 21.9% | 9.0%(+12.9)#72 | 8.8%(+13.1)#21,105 |
| 73. | Owyhee | 22.3% | 9.0%(+13.3)#73 | 8.8%(+13.6)#21,268 |
| 74. | Nixon | 24.5% | 9.0%(+15.5)#74 | 8.8%(+15.8)#21,875 |
| 75. | Imlay | 28.1% | 9.0%(+19.1)#75 | 8.8%(+19.3)#22,681 |
| 76. | Walker Lake | 29.2% | 9.0%(+20.1)#76 | 8.8%(+20.4)#22,866 |
| 77. | Sutcliffe | 29.2% | 9.0%(+20.2)#77 | 8.8%(+20.4)#22,879 |
| 78. | Searchlight | 31.4% | 9.0%(+22.4)#78 | 8.8%(+22.6)#23,214 |
| 79. | Schurz | 38.2% | 9.0%(+29.2)#79 | 8.8%(+29.4)#23,886 |
| 80. | Cal Nev Ari | 43.6% | 9.0%(+34.6)#80 | 8.8%(+34.9)#24,275 |
| 81. | Fort Mcdermitt | 50.7% | 9.0%(+41.6)#81 | 8.8%(+41.9)#24,594 |
1
Common Questions
What are the Top 10 Cities with the Lowest Poverty Level Among Families in Nevada?
Top 10 Cities with the Lowest Poverty Level Among Families in Nevada are:
#1
0.0%
#2
0.0%
#3
0.0%
#4
0.0%
#5
0.0%
#6
0.0%
#7
0.0%
#8
0.0%
#9
0.0%
#10
0.0%
What city has the Lowest Poverty Level Among Families in Nevada?
Fish Springs has the Lowest Poverty Level Among Families in Nevada with 0.61%.
What is the Poverty Level Among Families in the State of Nevada?
Poverty Level Among Families in Nevada is 9.0%.
What is the Poverty Level Among Families in the United States?
Poverty Level Among Families in the United States is 8.8%.