Cities with the Lowest Poverty Level Among Families in Arizona
RELATED REPORTS & OPTIONS
Lowest Family Poverty
Arizona
Compare Cities
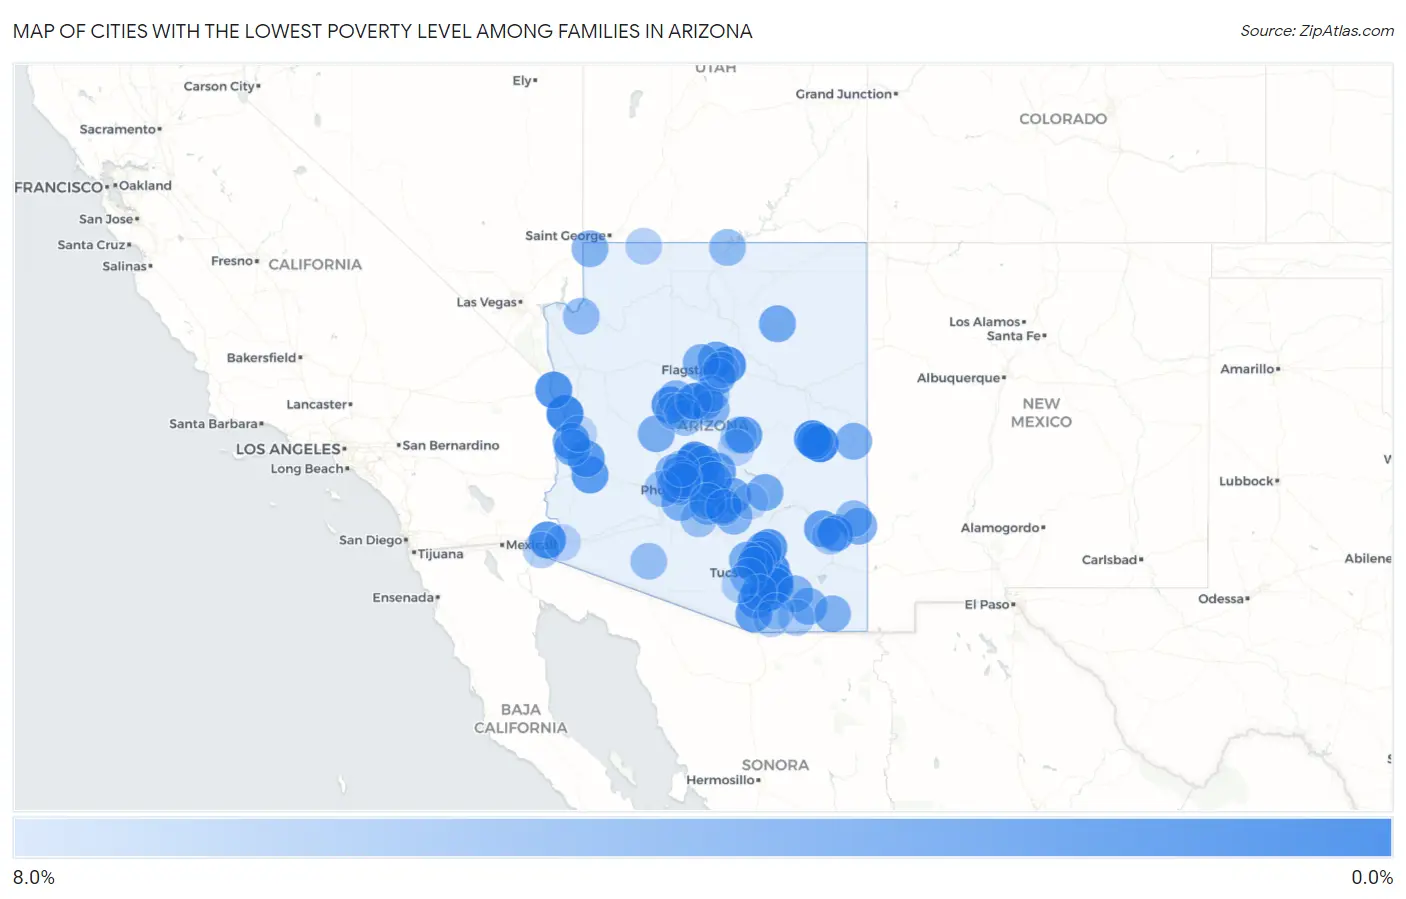
Map of Cities with the Lowest Poverty Level Among Families in Arizona
8.0%
0.0%
Cities with the Lowest Poverty Level Among Families in Arizona
| City | Family Poverty | vs State | vs National | |
| 1. | Pinetop Country Club | 0.29% | 9.2%(-8.91)#1 | 8.8%(-8.49)#19 |
| 2. | Desert Hills | 0.62% | 9.2%(-8.59)#2 | 8.8%(-8.17)#167 |
| 3. | Corona De Tucson | 1.1% | 9.2%(-8.15)#3 | 8.8%(-7.72)#602 |
| 4. | Tanque Verde | 1.3% | 9.2%(-7.86)#4 | 8.8%(-7.43)#943 |
| 5. | Wagon Wheel | 1.4% | 9.2%(-7.83)#5 | 8.8%(-7.41)#976 |
| 6. | Doney Park | 1.5% | 9.2%(-7.72)#6 | 8.8%(-7.30)#1,129 |
| 7. | Sunsites | 1.7% | 9.2%(-7.48)#7 | 8.8%(-7.06)#1,476 |
| 8. | Mohave Valley | 1.9% | 9.2%(-7.33)#8 | 8.8%(-6.90)#1,701 |
| 9. | Donovan Estates | 1.9% | 9.2%(-7.32)#9 | 8.8%(-6.89)#1,717 |
| 10. | Williamson | 2.0% | 9.2%(-7.24)#10 | 8.8%(-6.81)#1,855 |
| 11. | Anthem | 2.1% | 9.2%(-7.08)#11 | 8.8%(-6.66)#2,064 |
| 12. | Oracle | 2.1% | 9.2%(-7.06)#12 | 8.8%(-6.64)#2,097 |
| 13. | Catalina Foothills | 2.1% | 9.2%(-7.06)#13 | 8.8%(-6.63)#2,100 |
| 14. | Clarkdale | 2.2% | 9.2%(-6.98)#14 | 8.8%(-6.55)#2,234 |
| 15. | New River | 2.2% | 9.2%(-6.97)#15 | 8.8%(-6.55)#2,237 |
| 16. | Brenda | 2.3% | 9.2%(-6.93)#16 | 8.8%(-6.50)#2,328 |
| 17. | Rincon Valley | 2.4% | 9.2%(-6.84)#17 | 8.8%(-6.41)#2,459 |
| 18. | Bouse | 2.4% | 9.2%(-6.84)#18 | 8.8%(-6.41)#2,461 |
| 19. | Tucson Mountains | 2.4% | 9.2%(-6.80)#19 | 8.8%(-6.37)#2,534 |
| 20. | Catalina | 2.6% | 9.2%(-6.66)#20 | 8.8%(-6.23)#2,758 |
| 21. | Star Valley | 2.6% | 9.2%(-6.56)#21 | 8.8%(-6.13)#2,932 |
| 22. | Bluewater | 2.7% | 9.2%(-6.55)#22 | 8.8%(-6.13)#2,940 |
| 23. | Green Valley | 2.8% | 9.2%(-6.43)#23 | 8.8%(-6.01)#3,151 |
| 24. | Paradise Valley | 2.9% | 9.2%(-6.36)#24 | 8.8%(-5.93)#3,290 |
| 25. | Queen Creek | 2.9% | 9.2%(-6.34)#25 | 8.8%(-5.92)#3,324 |
| 26. | Pima | 2.9% | 9.2%(-6.33)#26 | 8.8%(-5.91)#3,339 |
| 27. | Tubac | 2.9% | 9.2%(-6.31)#27 | 8.8%(-5.89)#3,359 |
| 28. | Rio Verde | 2.9% | 9.2%(-6.27)#28 | 8.8%(-5.85)#3,436 |
| 29. | Blue Ridge | 2.9% | 9.2%(-6.26)#29 | 8.8%(-5.83)#3,475 |
| 30. | Cornville | 3.2% | 9.2%(-5.97)#30 | 8.8%(-5.54)#3,946 |
| 31. | Carefree | 3.3% | 9.2%(-5.92)#31 | 8.8%(-5.49)#4,025 |
| 32. | Fort Valley | 3.4% | 9.2%(-5.84)#32 | 8.8%(-5.41)#4,168 |
| 33. | Litchfield Park | 3.4% | 9.2%(-5.82)#33 | 8.8%(-5.39)#4,199 |
| 34. | Gold Canyon | 3.4% | 9.2%(-5.78)#34 | 8.8%(-5.35)#4,269 |
| 35. | Vail | 3.6% | 9.2%(-5.65)#35 | 8.8%(-5.23)#4,452 |
| 36. | Timberline-Fernwood | 3.6% | 9.2%(-5.64)#36 | 8.8%(-5.22)#4,460 |
| 37. | Kykotsmovi Village | 3.6% | 9.2%(-5.60)#37 | 8.8%(-5.18)#4,555 |
| 38. | Kachina Village | 3.6% | 9.2%(-5.56)#38 | 8.8%(-5.14)#4,628 |
| 39. | Parker | 3.7% | 9.2%(-5.55)#39 | 8.8%(-5.13)#4,644 |
| 40. | Saddlebrooke | 3.7% | 9.2%(-5.49)#40 | 8.8%(-5.07)#4,748 |
| 41. | Gilbert | 3.8% | 9.2%(-5.40)#41 | 8.8%(-4.97)#4,888 |
| 42. | Claypool | 3.9% | 9.2%(-5.35)#42 | 8.8%(-4.92)#4,975 |
| 43. | Oro Valley | 3.9% | 9.2%(-5.29)#43 | 8.8%(-4.87)#5,042 |
| 44. | Peeples Valley | 4.0% | 9.2%(-5.24)#44 | 8.8%(-4.82)#5,137 |
| 45. | San Jose | 4.0% | 9.2%(-5.21)#45 | 8.8%(-4.78)#5,177 |
| 46. | Red Rock Cdp Pinal County | 4.0% | 9.2%(-5.18)#46 | 8.8%(-4.75)#5,228 |
| 47. | York | 4.0% | 9.2%(-5.17)#47 | 8.8%(-4.75)#5,240 |
| 48. | Marana | 4.1% | 9.2%(-5.06)#48 | 8.8%(-4.63)#5,424 |
| 49. | Parks | 4.2% | 9.2%(-5.03)#49 | 8.8%(-4.60)#5,466 |
| 50. | Goodyear | 4.2% | 9.2%(-5.00)#50 | 8.8%(-4.58)#5,496 |
| 51. | Scottsdale | 4.2% | 9.2%(-4.98)#51 | 8.8%(-4.56)#5,539 |
| 52. | Casas Adobes | 4.3% | 9.2%(-4.92)#52 | 8.8%(-4.50)#5,635 |
| 53. | Tombstone | 4.3% | 9.2%(-4.87)#53 | 8.8%(-4.45)#5,713 |
| 54. | Springerville | 4.4% | 9.2%(-4.84)#54 | 8.8%(-4.41)#5,788 |
| 55. | Mcneal | 4.5% | 9.2%(-4.73)#55 | 8.8%(-4.30)#5,940 |
| 56. | Surprise | 4.5% | 9.2%(-4.73)#56 | 8.8%(-4.30)#5,941 |
| 57. | Red Lake | 4.5% | 9.2%(-4.69)#57 | 8.8%(-4.26)#6,001 |
| 58. | Sun Lakes | 4.6% | 9.2%(-4.65)#58 | 8.8%(-4.22)#6,072 |
| 59. | Florence | 4.6% | 9.2%(-4.63)#59 | 8.8%(-4.20)#6,108 |
| 60. | Pinetop Lakeside | 4.6% | 9.2%(-4.62)#60 | 8.8%(-4.20)#6,113 |
| 61. | Chino Valley | 4.7% | 9.2%(-4.55)#61 | 8.8%(-4.13)#6,230 |
| 62. | Beaver Dam | 4.7% | 9.2%(-4.53)#62 | 8.8%(-4.11)#6,254 |
| 63. | Sun City West | 4.7% | 9.2%(-4.52)#63 | 8.8%(-4.09)#6,286 |
| 64. | Lake Montezuma | 4.9% | 9.2%(-4.35)#64 | 8.8%(-3.92)#6,520 |
| 65. | Benson | 4.9% | 9.2%(-4.33)#65 | 8.8%(-3.91)#6,543 |
| 66. | Fountain Hills | 5.0% | 9.2%(-4.19)#66 | 8.8%(-3.77)#6,793 |
| 67. | Citrus Park | 5.2% | 9.2%(-4.02)#67 | 8.8%(-3.60)#7,050 |
| 68. | Clifton | 5.2% | 9.2%(-4.01)#68 | 8.8%(-3.59)#7,062 |
| 69. | Meadview | 5.3% | 9.2%(-3.93)#69 | 8.8%(-3.51)#7,213 |
| 70. | Sun City | 5.3% | 9.2%(-3.93)#70 | 8.8%(-3.50)#7,224 |
| 71. | Tucson Estates | 5.4% | 9.2%(-3.83)#71 | 8.8%(-3.40)#7,352 |
| 72. | Sahuarita | 5.4% | 9.2%(-3.83)#72 | 8.8%(-3.40)#7,354 |
| 73. | Page | 5.5% | 9.2%(-3.73)#73 | 8.8%(-3.31)#7,518 |
| 74. | Ajo | 5.6% | 9.2%(-3.59)#74 | 8.8%(-3.17)#7,709 |
| 75. | Youngtown | 5.7% | 9.2%(-3.52)#75 | 8.8%(-3.10)#7,823 |
| 76. | Maricopa | 5.9% | 9.2%(-3.35)#76 | 8.8%(-2.92)#8,085 |
| 77. | Chandler | 5.9% | 9.2%(-3.30)#77 | 8.8%(-2.87)#8,176 |
| 78. | Sedona | 6.0% | 9.2%(-3.24)#78 | 8.8%(-2.82)#8,250 |
| 79. | Dewey Humboldt | 6.0% | 9.2%(-3.21)#79 | 8.8%(-2.79)#8,280 |
| 80. | Buckeye | 6.1% | 9.2%(-3.14)#80 | 8.8%(-2.72)#8,408 |
| 81. | Peoria | 6.1% | 9.2%(-3.12)#81 | 8.8%(-2.70)#8,426 |
| 82. | Solomon | 6.2% | 9.2%(-2.96)#82 | 8.8%(-2.53)#8,674 |
| 83. | San Tan Valley | 6.3% | 9.2%(-2.90)#83 | 8.8%(-2.47)#8,799 |
| 84. | Gadsden | 6.5% | 9.2%(-2.72)#84 | 8.8%(-2.30)#9,040 |
| 85. | Prescott | 6.6% | 9.2%(-2.62)#85 | 8.8%(-2.20)#9,190 |
| 86. | Cactus Flats | 6.6% | 9.2%(-2.56)#86 | 8.8%(-2.14)#9,260 |
| 87. | Payson | 6.7% | 9.2%(-2.55)#87 | 8.8%(-2.12)#9,267 |
| 88. | Centennial Park | 6.7% | 9.2%(-2.49)#88 | 8.8%(-2.06)#9,369 |
| 89. | Three Points | 6.8% | 9.2%(-2.40)#89 | 8.8%(-1.98)#9,477 |
| 90. | Sierra Vista | 6.8% | 9.2%(-2.36)#90 | 8.8%(-1.93)#9,525 |
| 91. | Patagonia | 7.0% | 9.2%(-2.18)#91 | 8.8%(-1.76)#9,746 |
| 92. | Prescott Valley | 7.0% | 9.2%(-2.18)#92 | 8.8%(-1.75)#9,750 |
| 93. | Sonoita | 7.1% | 9.2%(-2.15)#93 | 8.8%(-1.72)#9,787 |
| 94. | Deer Creek | 7.1% | 9.2%(-2.06)#94 | 8.8%(-1.64)#9,925 |
| 95. | Flagstaff | 7.2% | 9.2%(-2.01)#95 | 8.8%(-1.58)#9,991 |
| 96. | Fortuna Foothills | 7.3% | 9.2%(-1.95)#96 | 8.8%(-1.52)#10,070 |
| 97. | J-Six Ranchettes | 7.3% | 9.2%(-1.86)#97 | 8.8%(-1.44)#10,202 |
| 98. | Jerome | 7.4% | 9.2%(-1.80)#98 | 8.8%(-1.37)#10,291 |
| 99. | Superior | 7.4% | 9.2%(-1.78)#99 | 8.8%(-1.35)#10,330 |
| 100. | Parker Strip | 7.5% | 9.2%(-1.75)#100 | 8.8%(-1.32)#10,351 |
Common Questions
What are the Top 10 Cities with the Lowest Poverty Level Among Families in Arizona?
Top 10 Cities with the Lowest Poverty Level Among Families in Arizona are:
#1
0.29%
#2
0.62%
#3
1.1%
#4
1.3%
#5
1.4%
#6
1.5%
#7
1.9%
#8
1.9%
#9
2.0%
#10
2.1%
What city has the Lowest Poverty Level Among Families in Arizona?
Pinetop Country Club has the Lowest Poverty Level Among Families in Arizona with 0.29%.
What is the Poverty Level Among Families in the State of Arizona?
Poverty Level Among Families in Arizona is 9.2%.
What is the Poverty Level Among Families in the United States?
Poverty Level Among Families in the United States is 8.8%.