Cities with the Lowest Poverty Level Among Families in Virginia
RELATED REPORTS & OPTIONS
Lowest Family Poverty
Virginia
Compare Cities
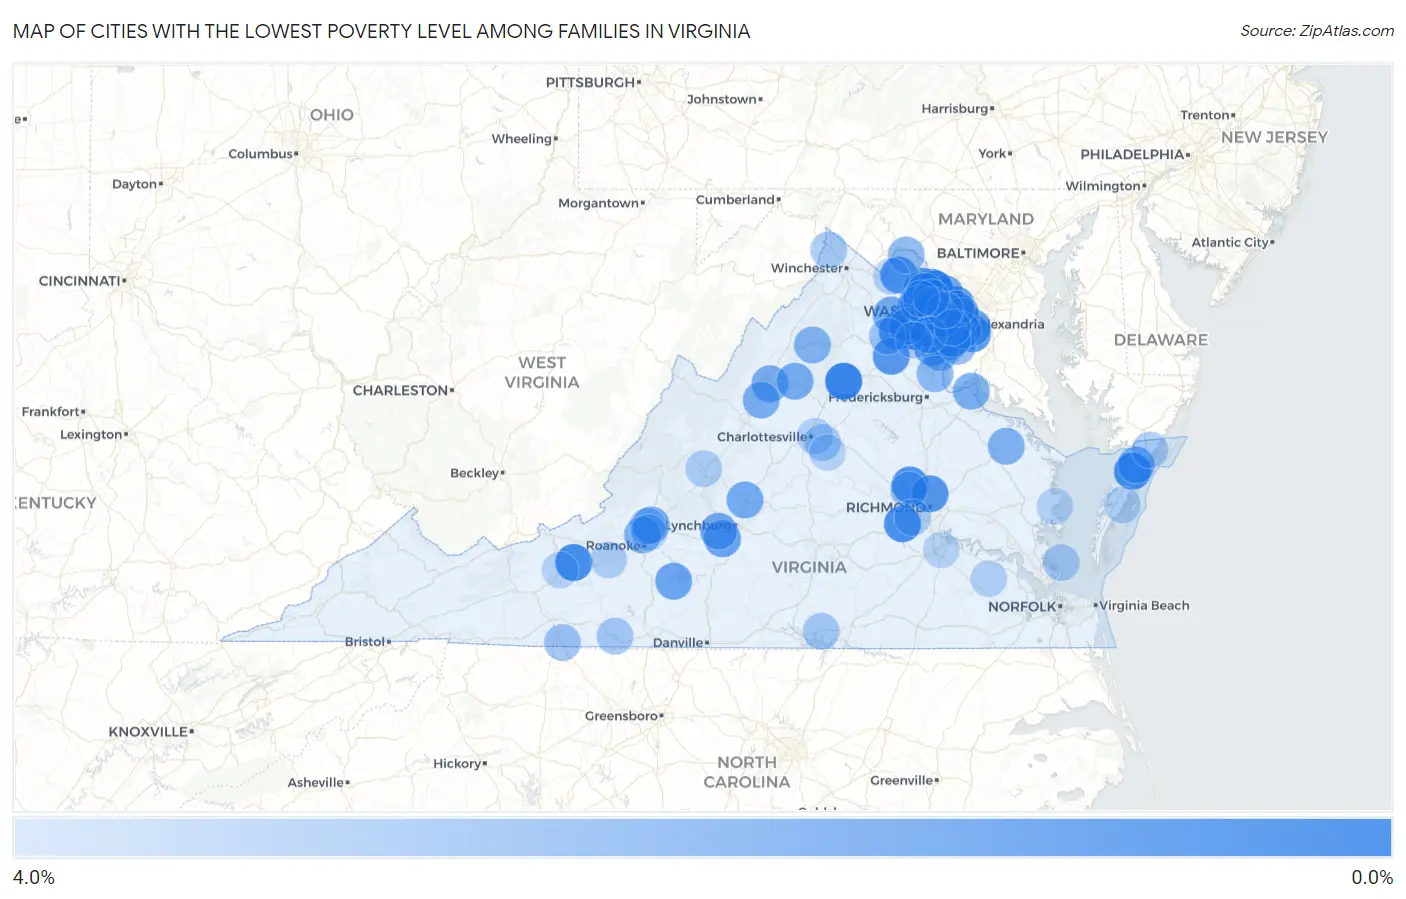
Map of Cities with the Lowest Poverty Level Among Families in Virginia
4.0%
0.0%
Cities with the Lowest Poverty Level Among Families in Virginia
| City | Family Poverty | vs State | vs National | |
| 1. | Brightwood | 0.24% | 6.8%(-6.55)#1 | 8.8%(-8.54)#13 |
| 2. | South Run | 0.31% | 6.8%(-6.49)#2 | 8.8%(-8.47)#21 |
| 3. | Fairfax Station | 0.38% | 6.8%(-6.42)#3 | 8.8%(-8.40)#43 |
| 4. | Countryside | 0.44% | 6.8%(-6.36)#4 | 8.8%(-8.35)#57 |
| 5. | Hayfield | 0.50% | 6.8%(-6.29)#5 | 8.8%(-8.28)#83 |
| 6. | Parksley | 0.50% | 6.8%(-6.29)#6 | 8.8%(-8.28)#84 |
| 7. | Linton Hall | 0.51% | 6.8%(-6.28)#7 | 8.8%(-8.27)#95 |
| 8. | Fairlawn | 0.58% | 6.8%(-6.21)#8 | 8.8%(-8.20)#143 |
| 9. | Brambleton | 0.60% | 6.8%(-6.20)#9 | 8.8%(-8.19)#154 |
| 10. | New Baltimore | 0.66% | 6.8%(-6.13)#10 | 8.8%(-8.12)#196 |
| 11. | Woodlake | 0.67% | 6.8%(-6.13)#11 | 8.8%(-8.12)#197 |
| 12. | Occoquan | 0.72% | 6.8%(-6.07)#12 | 8.8%(-8.06)#250 |
| 13. | Wyndham | 0.77% | 6.8%(-6.02)#13 | 8.8%(-8.01)#295 |
| 14. | Rose Hill Cdp Fairfax County | 0.86% | 6.8%(-5.93)#14 | 8.8%(-7.92)#379 |
| 15. | Dranesville | 0.92% | 6.8%(-5.88)#15 | 8.8%(-7.87)#444 |
| 16. | Mantua | 0.93% | 6.8%(-5.87)#16 | 8.8%(-7.85)#458 |
| 17. | Mclean | 0.95% | 6.8%(-5.85)#17 | 8.8%(-7.83)#472 |
| 18. | Chamberlayne | 0.96% | 6.8%(-5.83)#18 | 8.8%(-7.82)#488 |
| 19. | Burke | 0.99% | 6.8%(-5.81)#19 | 8.8%(-7.79)#522 |
| 20. | Stone Ridge | 1.0% | 6.8%(-5.79)#20 | 8.8%(-7.77)#536 |
| 21. | Wolf Trap | 1.0% | 6.8%(-5.79)#21 | 8.8%(-7.77)#539 |
| 22. | Fort Hunt | 1.0% | 6.8%(-5.78)#22 | 8.8%(-7.76)#544 |
| 23. | Bealeton | 1.0% | 6.8%(-5.78)#23 | 8.8%(-7.76)#545 |
| 24. | Purcellville | 1.0% | 6.8%(-5.77)#24 | 8.8%(-7.76)#554 |
| 25. | Broadlands | 1.1% | 6.8%(-5.72)#25 | 8.8%(-7.71)#622 |
| 26. | Belmont | 1.1% | 6.8%(-5.66)#26 | 8.8%(-7.64)#681 |
| 27. | Union Mill | 1.2% | 6.8%(-5.61)#27 | 8.8%(-7.60)#742 |
| 28. | Belle Haven | 1.2% | 6.8%(-5.60)#28 | 8.8%(-7.59)#748 |
| 29. | Great Falls | 1.3% | 6.8%(-5.48)#29 | 8.8%(-7.46)#903 |
| 30. | Independent Hill | 1.3% | 6.8%(-5.45)#30 | 8.8%(-7.44)#933 |
| 31. | Timberlake | 1.4% | 6.8%(-5.37)#31 | 8.8%(-7.36)#1,041 |
| 32. | Cascades | 1.5% | 6.8%(-5.30)#32 | 8.8%(-7.29)#1,140 |
| 33. | Union Hall | 1.5% | 6.8%(-5.25)#33 | 8.8%(-7.24)#1,215 |
| 34. | Falls Church | 1.6% | 6.8%(-5.20)#34 | 8.8%(-7.19)#1,282 |
| 35. | Crosspointe | 1.6% | 6.8%(-5.18)#35 | 8.8%(-7.17)#1,313 |
| 36. | Troutville | 1.6% | 6.8%(-5.16)#36 | 8.8%(-7.14)#1,341 |
| 37. | Forest | 1.6% | 6.8%(-5.15)#37 | 8.8%(-7.14)#1,346 |
| 38. | Haymarket | 1.7% | 6.8%(-5.11)#38 | 8.8%(-7.10)#1,406 |
| 39. | Amherst | 1.8% | 6.8%(-5.02)#39 | 8.8%(-7.01)#1,543 |
| 40. | Bloxom | 1.8% | 6.8%(-5.02)#40 | 8.8%(-7.01)#1,548 |
| 41. | The Plains | 1.8% | 6.8%(-5.01)#41 | 8.8%(-7.00)#1,571 |
| 42. | Massanetta Springs | 1.8% | 6.8%(-5.01)#42 | 8.8%(-6.99)#1,575 |
| 43. | Newington Forest | 1.8% | 6.8%(-5.01)#43 | 8.8%(-6.99)#1,578 |
| 44. | Ashburn | 1.8% | 6.8%(-4.98)#44 | 8.8%(-6.96)#1,614 |
| 45. | Elkton | 1.8% | 6.8%(-4.96)#45 | 8.8%(-6.95)#1,638 |
| 46. | Weyers Cave | 1.9% | 6.8%(-4.94)#46 | 8.8%(-6.93)#1,657 |
| 47. | Long Branch | 1.9% | 6.8%(-4.91)#47 | 8.8%(-6.90)#1,710 |
| 48. | Hollins | 1.9% | 6.8%(-4.90)#48 | 8.8%(-6.89)#1,731 |
| 49. | Midlothian | 1.9% | 6.8%(-4.90)#49 | 8.8%(-6.88)#1,737 |
| 50. | Dahlgren | 1.9% | 6.8%(-4.89)#50 | 8.8%(-6.88)#1,749 |
| 51. | Warsaw | 2.0% | 6.8%(-4.77)#51 | 8.8%(-6.75)#1,929 |
| 52. | County Center | 2.0% | 6.8%(-4.76)#52 | 8.8%(-6.75)#1,939 |
| 53. | Luray | 2.1% | 6.8%(-4.73)#53 | 8.8%(-6.72)#1,982 |
| 54. | Franklin Farm | 2.1% | 6.8%(-4.68)#54 | 8.8%(-6.67)#2,050 |
| 55. | Lake Barcroft | 2.1% | 6.8%(-4.67)#55 | 8.8%(-6.66)#2,059 |
| 56. | Newington | 2.2% | 6.8%(-4.63)#56 | 8.8%(-6.62)#2,128 |
| 57. | Lovettsville | 2.3% | 6.8%(-4.51)#57 | 8.8%(-6.50)#2,325 |
| 58. | Montclair | 2.3% | 6.8%(-4.51)#58 | 8.8%(-6.50)#2,331 |
| 59. | Aquia Harbour | 2.3% | 6.8%(-4.47)#59 | 8.8%(-6.46)#2,377 |
| 60. | Mason Neck | 2.4% | 6.8%(-4.40)#60 | 8.8%(-6.38)#2,506 |
| 61. | Burke Centre | 2.4% | 6.8%(-4.39)#61 | 8.8%(-6.38)#2,509 |
| 62. | Manassas Park | 2.4% | 6.8%(-4.38)#62 | 8.8%(-6.37)#2,535 |
| 63. | Kings Park West | 2.4% | 6.8%(-4.38)#63 | 8.8%(-6.37)#2,536 |
| 64. | Chantilly | 2.4% | 6.8%(-4.36)#64 | 8.8%(-6.35)#2,562 |
| 65. | Kingstowne | 2.5% | 6.8%(-4.34)#65 | 8.8%(-6.33)#2,605 |
| 66. | Laurel Hill | 2.5% | 6.8%(-4.30)#66 | 8.8%(-6.28)#2,673 |
| 67. | Sully Square | 2.5% | 6.8%(-4.25)#67 | 8.8%(-6.23)#2,757 |
| 68. | Pimmit Hills | 2.6% | 6.8%(-4.20)#68 | 8.8%(-6.19)#2,831 |
| 69. | Short Pump | 2.6% | 6.8%(-4.19)#69 | 8.8%(-6.18)#2,854 |
| 70. | Gainesville | 2.6% | 6.8%(-4.17)#70 | 8.8%(-6.15)#2,885 |
| 71. | Cana | 2.6% | 6.8%(-4.15)#71 | 8.8%(-6.14)#2,926 |
| 72. | George Mason | 2.7% | 6.8%(-4.14)#72 | 8.8%(-6.13)#2,936 |
| 73. | Arcola | 2.7% | 6.8%(-4.10)#73 | 8.8%(-6.09)#3,017 |
| 74. | Warrenton | 2.7% | 6.8%(-4.09)#74 | 8.8%(-6.07)#3,038 |
| 75. | Floris | 2.8% | 6.8%(-3.97)#75 | 8.8%(-5.96)#3,256 |
| 76. | Buckhall | 2.8% | 6.8%(-3.97)#76 | 8.8%(-5.95)#3,258 |
| 77. | Patrick Springs | 2.9% | 6.8%(-3.92)#77 | 8.8%(-5.91)#3,340 |
| 78. | Boydton | 2.9% | 6.8%(-3.90)#78 | 8.8%(-5.88)#3,379 |
| 79. | Rivanna | 2.9% | 6.8%(-3.85)#79 | 8.8%(-5.84)#3,449 |
| 80. | Daleville | 3.0% | 6.8%(-3.83)#80 | 8.8%(-5.82)#3,495 |
| 81. | Lake Holiday | 3.0% | 6.8%(-3.83)#81 | 8.8%(-5.82)#3,501 |
| 82. | West Springfield | 3.0% | 6.8%(-3.80)#82 | 8.8%(-5.79)#3,550 |
| 83. | Poquoson | 3.0% | 6.8%(-3.80)#83 | 8.8%(-5.79)#3,555 |
| 84. | Wattsville | 3.0% | 6.8%(-3.79)#84 | 8.8%(-5.78)#3,567 |
| 85. | Oakton | 3.1% | 6.8%(-3.72)#85 | 8.8%(-5.70)#3,684 |
| 86. | East Lexington | 3.1% | 6.8%(-3.70)#86 | 8.8%(-5.69)#3,709 |
| 87. | Oak Grove | 3.1% | 6.8%(-3.69)#87 | 8.8%(-5.68)#3,719 |
| 88. | Nokesville | 3.1% | 6.8%(-3.67)#88 | 8.8%(-5.66)#3,761 |
| 89. | Quinby | 3.2% | 6.8%(-3.64)#89 | 8.8%(-5.62)#3,819 |
| 90. | Shawsville | 3.2% | 6.8%(-3.61)#90 | 8.8%(-5.60)#3,855 |
| 91. | Rockwood | 3.2% | 6.8%(-3.61)#91 | 8.8%(-5.59)#3,865 |
| 92. | Dendron | 3.2% | 6.8%(-3.57)#92 | 8.8%(-5.56)#3,924 |
| 93. | Loudoun Valley Estates | 3.2% | 6.8%(-3.55)#93 | 8.8%(-5.54)#3,950 |
| 94. | Round Hill | 3.2% | 6.8%(-3.55)#94 | 8.8%(-5.53)#3,956 |
| 95. | Pantops | 3.3% | 6.8%(-3.50)#95 | 8.8%(-5.49)#4,039 |
| 96. | Deltaville | 3.3% | 6.8%(-3.49)#96 | 8.8%(-5.48)#4,055 |
| 97. | Cloverdale | 3.3% | 6.8%(-3.47)#97 | 8.8%(-5.46)#4,091 |
| 98. | Fort Lee | 3.3% | 6.8%(-3.46)#98 | 8.8%(-5.45)#4,100 |
| 99. | Dublin | 3.4% | 6.8%(-3.42)#99 | 8.8%(-5.40)#4,184 |
| 100. | Lake Monticello | 3.4% | 6.8%(-3.41)#100 | 8.8%(-5.40)#4,189 |
Common Questions
What are the Top 10 Cities with the Lowest Poverty Level Among Families in Virginia?
Top 10 Cities with the Lowest Poverty Level Among Families in Virginia are:
#1
0.24%
#2
0.31%
#3
0.38%
#4
0.44%
#5
0.50%
#6
0.50%
#7
0.51%
#8
0.58%
#9
0.60%
#10
0.66%
What city has the Lowest Poverty Level Among Families in Virginia?
Brightwood has the Lowest Poverty Level Among Families in Virginia with 0.24%.
What is the Poverty Level Among Families in the State of Virginia?
Poverty Level Among Families in Virginia is 6.8%.
What is the Poverty Level Among Families in the United States?
Poverty Level Among Families in the United States is 8.8%.