Cities with the Lowest Poverty Level Among Families in Utah
RELATED REPORTS & OPTIONS
Lowest Family Poverty
Utah
Compare Cities
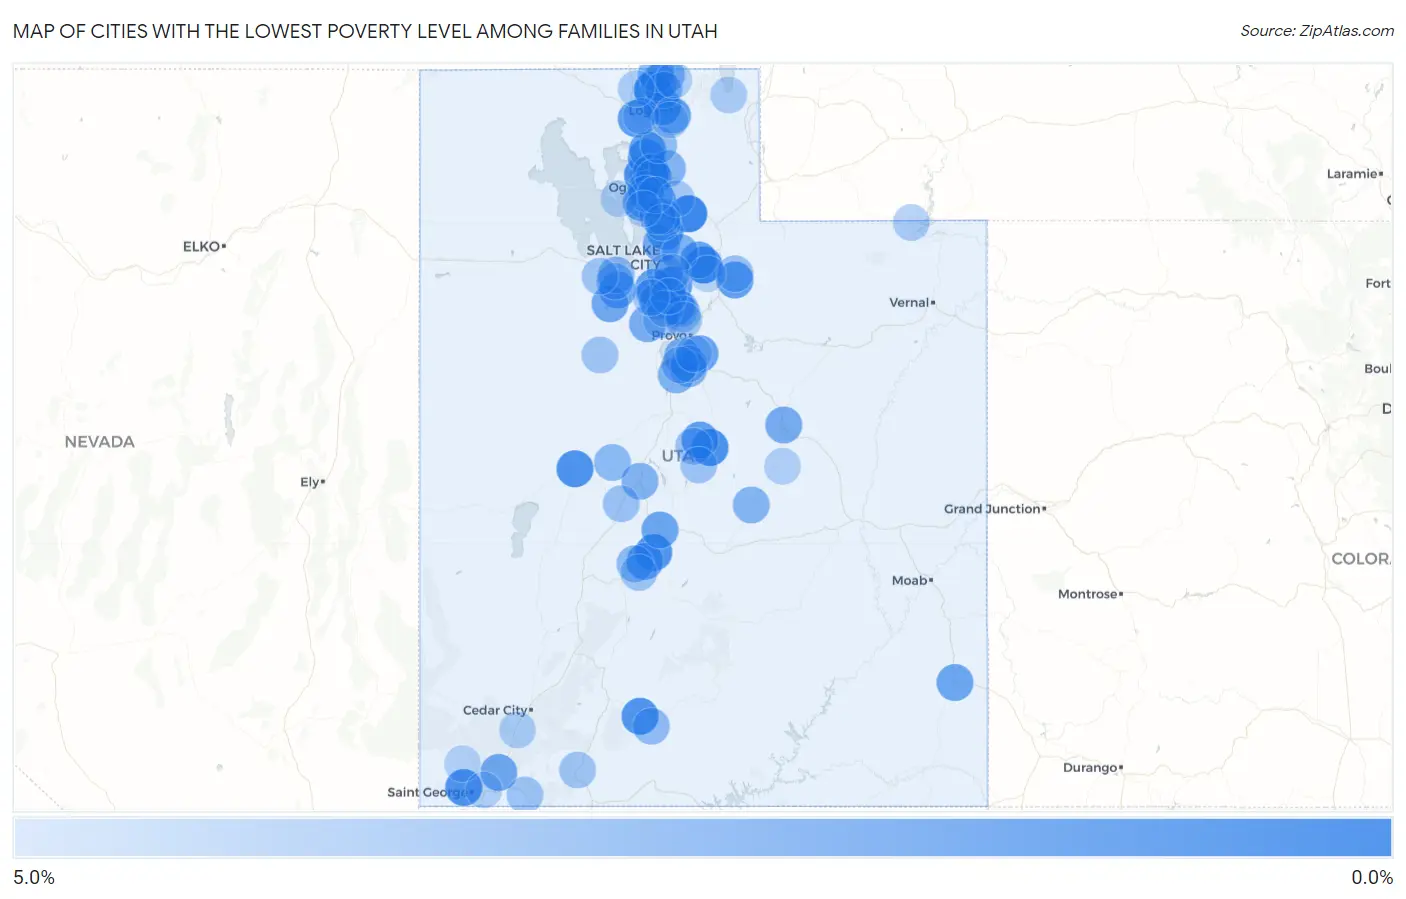
Map of Cities with the Lowest Poverty Level Among Families in Utah
5.0%
0.0%
Cities with the Lowest Poverty Level Among Families in Utah
| City | Family Poverty | vs State | vs National | |
| 1. | Farr West | 0.39% | 5.7%(-5.26)#1 | 8.8%(-8.39)#45 |
| 2. | Newton | 0.49% | 5.7%(-5.17)#2 | 8.8%(-8.30)#77 |
| 3. | Morgan | 0.50% | 5.7%(-5.15)#3 | 8.8%(-8.28)#86 |
| 4. | Snyderville | 0.74% | 5.7%(-4.91)#4 | 8.8%(-8.04)#263 |
| 5. | Plain City | 0.89% | 5.7%(-4.77)#5 | 8.8%(-7.89)#407 |
| 6. | Spring City | 0.94% | 5.7%(-4.72)#6 | 8.8%(-7.84)#463 |
| 7. | Hinckley | 1.0% | 5.7%(-4.62)#7 | 8.8%(-7.75)#560 |
| 8. | Santa Clara | 1.1% | 5.7%(-4.60)#8 | 8.8%(-7.73)#596 |
| 9. | Glenwood | 1.1% | 5.7%(-4.50)#9 | 8.8%(-7.63)#694 |
| 10. | Tropic | 1.2% | 5.7%(-4.49)#10 | 8.8%(-7.62)#715 |
| 11. | Centerville | 1.3% | 5.7%(-4.31)#11 | 8.8%(-7.43)#941 |
| 12. | Benson | 1.4% | 5.7%(-4.25)#12 | 8.8%(-7.38)#1,004 |
| 13. | Elwood | 1.5% | 5.7%(-4.15)#13 | 8.8%(-7.28)#1,147 |
| 14. | Granite | 1.5% | 5.7%(-4.12)#14 | 8.8%(-7.24)#1,205 |
| 15. | Willard | 1.6% | 5.7%(-4.05)#15 | 8.8%(-7.18)#1,295 |
| 16. | Moroni | 1.7% | 5.7%(-3.99)#16 | 8.8%(-7.12)#1,379 |
| 17. | Perry | 1.7% | 5.7%(-3.96)#17 | 8.8%(-7.09)#1,411 |
| 18. | South Jordan | 1.7% | 5.7%(-3.96)#18 | 8.8%(-7.09)#1,412 |
| 19. | Francis | 1.7% | 5.7%(-3.94)#19 | 8.8%(-7.07)#1,453 |
| 20. | Pleasant View | 1.8% | 5.7%(-3.88)#20 | 8.8%(-7.01)#1,542 |
| 21. | Highland | 1.8% | 5.7%(-3.86)#21 | 8.8%(-6.99)#1,580 |
| 22. | Annabella | 1.9% | 5.7%(-3.80)#22 | 8.8%(-6.93)#1,658 |
| 23. | West Point | 1.9% | 5.7%(-3.79)#23 | 8.8%(-6.92)#1,682 |
| 24. | Mapleton | 1.9% | 5.7%(-3.79)#24 | 8.8%(-6.91)#1,684 |
| 25. | Summit Park | 1.9% | 5.7%(-3.77)#25 | 8.8%(-6.90)#1,708 |
| 26. | Tooele | 1.9% | 5.7%(-3.72)#26 | 8.8%(-6.85)#1,796 |
| 27. | South Weber | 2.0% | 5.7%(-3.64)#27 | 8.8%(-6.77)#1,906 |
| 28. | Aurora | 2.0% | 5.7%(-3.63)#28 | 8.8%(-6.76)#1,923 |
| 29. | Monticello | 2.0% | 5.7%(-3.63)#29 | 8.8%(-6.75)#1,926 |
| 30. | Leeds | 2.1% | 5.7%(-3.57)#30 | 8.8%(-6.70)#2,003 |
| 31. | Stockton | 2.2% | 5.7%(-3.50)#31 | 8.8%(-6.63)#2,105 |
| 32. | West Haven | 2.3% | 5.7%(-3.31)#32 | 8.8%(-6.44)#2,411 |
| 33. | Carbonville | 2.4% | 5.7%(-3.30)#33 | 8.8%(-6.43)#2,441 |
| 34. | Eagle Mountain | 2.4% | 5.7%(-3.29)#34 | 8.8%(-6.41)#2,455 |
| 35. | Benjamin | 2.4% | 5.7%(-3.23)#35 | 8.8%(-6.35)#2,559 |
| 36. | North Salt Lake | 2.4% | 5.7%(-3.22)#36 | 8.8%(-6.35)#2,563 |
| 37. | Emigration Canyon | 2.5% | 5.7%(-3.12)#37 | 8.8%(-6.25)#2,738 |
| 38. | Elk Ridge | 2.6% | 5.7%(-3.03)#38 | 8.8%(-6.16)#2,882 |
| 39. | Clinton | 2.6% | 5.7%(-3.03)#39 | 8.8%(-6.15)#2,887 |
| 40. | Fruit Heights | 2.6% | 5.7%(-3.01)#40 | 8.8%(-6.14)#2,925 |
| 41. | Santaquin | 2.7% | 5.7%(-3.00)#41 | 8.8%(-6.13)#2,947 |
| 42. | Scipio | 2.7% | 5.7%(-3.00)#42 | 8.8%(-6.13)#2,950 |
| 43. | Liberty | 2.7% | 5.7%(-2.95)#43 | 8.8%(-6.08)#3,025 |
| 44. | Lewiston | 2.7% | 5.7%(-2.92)#44 | 8.8%(-6.04)#3,087 |
| 45. | Harrisville | 2.8% | 5.7%(-2.87)#45 | 8.8%(-6.00)#3,170 |
| 46. | Riverton | 2.8% | 5.7%(-2.87)#46 | 8.8%(-6.00)#3,172 |
| 47. | Ferron | 2.8% | 5.7%(-2.85)#47 | 8.8%(-5.98)#3,206 |
| 48. | Bluffdale | 2.8% | 5.7%(-2.81)#48 | 8.8%(-5.94)#3,276 |
| 49. | Millville | 2.8% | 5.7%(-2.81)#49 | 8.8%(-5.94)#3,286 |
| 50. | Trenton | 2.9% | 5.7%(-2.76)#50 | 8.8%(-5.88)#3,373 |
| 51. | Stansbury Park | 3.0% | 5.7%(-2.70)#51 | 8.8%(-5.83)#3,485 |
| 52. | Elsinore | 3.0% | 5.7%(-2.69)#52 | 8.8%(-5.82)#3,502 |
| 53. | Cornish | 3.0% | 5.7%(-2.67)#53 | 8.8%(-5.80)#3,536 |
| 54. | Oak City | 3.0% | 5.7%(-2.66)#54 | 8.8%(-5.79)#3,543 |
| 55. | Salem | 3.0% | 5.7%(-2.65)#55 | 8.8%(-5.78)#3,565 |
| 56. | Henrieville | 3.1% | 5.7%(-2.58)#56 | 8.8%(-5.70)#3,678 |
| 57. | Erda | 3.1% | 5.7%(-2.55)#57 | 8.8%(-5.68)#3,713 |
| 58. | Amalga | 3.1% | 5.7%(-2.55)#58 | 8.8%(-5.68)#3,716 |
| 59. | Mantua | 3.2% | 5.7%(-2.50)#59 | 8.8%(-5.62)#3,817 |
| 60. | Payson | 3.2% | 5.7%(-2.47)#60 | 8.8%(-5.60)#3,850 |
| 61. | Kaysville | 3.2% | 5.7%(-2.44)#61 | 8.8%(-5.56)#3,905 |
| 62. | Cedar Hills | 3.2% | 5.7%(-2.41)#62 | 8.8%(-5.54)#3,945 |
| 63. | Wales | 3.4% | 5.7%(-2.28)#63 | 8.8%(-5.41)#4,176 |
| 64. | Sandy | 3.4% | 5.7%(-2.26)#64 | 8.8%(-5.39)#4,211 |
| 65. | Kamas | 3.4% | 5.7%(-2.26)#65 | 8.8%(-5.38)#4,213 |
| 66. | Murray | 3.4% | 5.7%(-2.26)#66 | 8.8%(-5.38)#4,216 |
| 67. | Holden | 3.4% | 5.7%(-2.21)#67 | 8.8%(-5.33)#4,293 |
| 68. | Apple Valley | 3.5% | 5.7%(-2.18)#68 | 8.8%(-5.31)#4,332 |
| 69. | Roy | 3.5% | 5.7%(-2.17)#69 | 8.8%(-5.30)#4,341 |
| 70. | Ephraim | 3.5% | 5.7%(-2.14)#70 | 8.8%(-5.27)#4,394 |
| 71. | Holladay | 3.5% | 5.7%(-2.12)#71 | 8.8%(-5.24)#4,427 |
| 72. | Orderville | 3.6% | 5.7%(-2.10)#72 | 8.8%(-5.23)#4,448 |
| 73. | Monroe | 3.6% | 5.7%(-2.10)#73 | 8.8%(-5.23)#4,450 |
| 74. | Vernon | 3.6% | 5.7%(-2.08)#74 | 8.8%(-5.21)#4,498 |
| 75. | Pleasant Grove | 3.6% | 5.7%(-2.08)#75 | 8.8%(-5.20)#4,516 |
| 76. | Grantsville | 3.6% | 5.7%(-2.07)#76 | 8.8%(-5.20)#4,534 |
| 77. | Saratoga Springs | 3.6% | 5.7%(-2.04)#77 | 8.8%(-5.17)#4,579 |
| 78. | Lehi | 3.6% | 5.7%(-2.03)#78 | 8.8%(-5.15)#4,596 |
| 79. | Lindon | 3.7% | 5.7%(-1.93)#79 | 8.8%(-5.06)#4,763 |
| 80. | Mountain Green | 3.7% | 5.7%(-1.92)#80 | 8.8%(-5.05)#4,776 |
| 81. | Draper | 3.8% | 5.7%(-1.87)#81 | 8.8%(-5.00)#4,848 |
| 82. | Providence | 3.8% | 5.7%(-1.84)#82 | 8.8%(-4.97)#4,893 |
| 83. | Herriman | 3.8% | 5.7%(-1.83)#83 | 8.8%(-4.96)#4,910 |
| 84. | Manila | 3.9% | 5.7%(-1.76)#84 | 8.8%(-4.89)#5,020 |
| 85. | Deweyville | 3.9% | 5.7%(-1.76)#85 | 8.8%(-4.89)#5,021 |
| 86. | Plymouth | 4.0% | 5.7%(-1.69)#86 | 8.8%(-4.82)#5,125 |
| 87. | Kanarraville | 4.0% | 5.7%(-1.69)#87 | 8.8%(-4.82)#5,127 |
| 88. | Laketown | 4.0% | 5.7%(-1.69)#88 | 8.8%(-4.82)#5,128 |
| 89. | Richmond | 4.0% | 5.7%(-1.66)#89 | 8.8%(-4.79)#5,166 |
| 90. | Spanish Fork | 4.0% | 5.7%(-1.61)#90 | 8.8%(-4.74)#5,256 |
| 91. | Washington Terrace | 4.1% | 5.7%(-1.56)#91 | 8.8%(-4.69)#5,332 |
| 92. | Hooper | 4.1% | 5.7%(-1.56)#92 | 8.8%(-4.69)#5,338 |
| 93. | Cleveland | 4.1% | 5.7%(-1.54)#93 | 8.8%(-4.67)#5,364 |
| 94. | Dammeron Valley | 4.1% | 5.7%(-1.53)#94 | 8.8%(-4.66)#5,373 |
| 95. | East Basin | 4.2% | 5.7%(-1.49)#95 | 8.8%(-4.62)#5,434 |
| 96. | Washington | 4.2% | 5.7%(-1.48)#96 | 8.8%(-4.61)#5,464 |
| 97. | Nibley | 4.2% | 5.7%(-1.44)#97 | 8.8%(-4.57)#5,515 |
| 98. | Park City | 4.2% | 5.7%(-1.42)#98 | 8.8%(-4.55)#5,550 |
| 99. | Farmington | 4.2% | 5.7%(-1.41)#99 | 8.8%(-4.54)#5,566 |
| 100. | Syracuse | 4.3% | 5.7%(-1.38)#100 | 8.8%(-4.51)#5,626 |
Common Questions
What are the Top 10 Cities with the Lowest Poverty Level Among Families in Utah?
Top 10 Cities with the Lowest Poverty Level Among Families in Utah are:
#1
0.39%
#2
0.49%
#3
0.50%
#4
0.74%
#5
0.89%
#6
0.94%
#7
1.0%
#8
1.1%
#9
1.1%
#10
1.2%
What city has the Lowest Poverty Level Among Families in Utah?
Farr West has the Lowest Poverty Level Among Families in Utah with 0.39%.
What is the Poverty Level Among Families in the State of Utah?
Poverty Level Among Families in Utah is 5.7%.
What is the Poverty Level Among Families in the United States?
Poverty Level Among Families in the United States is 8.8%.