Cities with the Lowest Poverty Level Among Families in Kentucky
RELATED REPORTS & OPTIONS
Lowest Family Poverty
Kentucky
Compare Cities
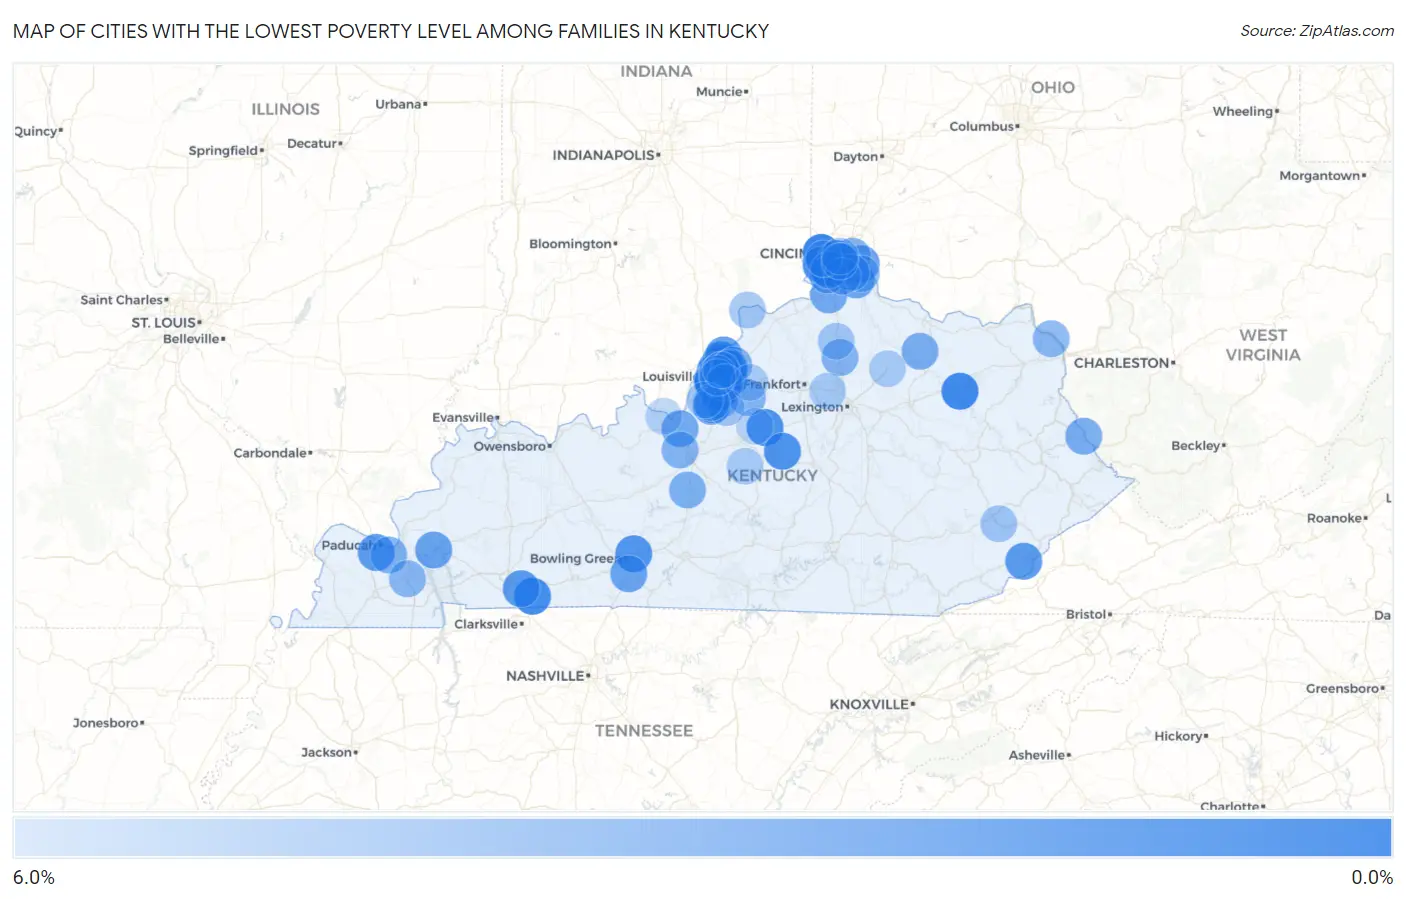
Map of Cities with the Lowest Poverty Level Among Families in Kentucky
6.0%
0.0%
Cities with the Lowest Poverty Level Among Families in Kentucky
| City | Family Poverty | vs State | vs National | |
| 1. | Indian Hills | 0.58% | 11.7%(-11.1)#1 | 8.8%(-8.20)#147 |
| 2. | Francisville | 0.59% | 11.7%(-11.1)#2 | 8.8%(-8.19)#148 |
| 3. | Oakbrook | 0.63% | 11.7%(-11.1)#3 | 8.8%(-8.15)#174 |
| 4. | Douglass Hills | 0.68% | 11.7%(-11.0)#4 | 8.8%(-8.10)#213 |
| 5. | Northfield | 0.69% | 11.7%(-11.0)#5 | 8.8%(-8.09)#219 |
| 6. | Bellemeade | 0.69% | 11.7%(-11.0)#6 | 8.8%(-8.09)#220 |
| 7. | Norbourne Estates | 0.70% | 11.7%(-11.0)#7 | 8.8%(-8.08)#230 |
| 8. | Kingsley | 0.82% | 11.7%(-10.9)#8 | 8.8%(-7.96)#341 |
| 9. | Thruston | 0.88% | 11.7%(-10.8)#9 | 8.8%(-7.90)#405 |
| 10. | Richlawn | 0.97% | 11.7%(-10.8)#10 | 8.8%(-7.81)#497 |
| 11. | West Van Lear | 0.98% | 11.7%(-10.7)#11 | 8.8%(-7.81)#504 |
| 12. | Lakeview Heights | 0.98% | 11.7%(-10.7)#12 | 8.8%(-7.80)#514 |
| 13. | Green Spring | 1.0% | 11.7%(-10.7)#13 | 8.8%(-7.78)#535 |
| 14. | Meadow Vale | 1.1% | 11.7%(-10.7)#14 | 8.8%(-7.73)#589 |
| 15. | Brownsboro Farm | 1.1% | 11.7%(-10.7)#15 | 8.8%(-7.73)#590 |
| 16. | Anchorage | 1.1% | 11.7%(-10.7)#16 | 8.8%(-7.71)#616 |
| 17. | Glenview | 1.1% | 11.7%(-10.6)#17 | 8.8%(-7.71)#625 |
| 18. | Burlington | 1.1% | 11.7%(-10.6)#18 | 8.8%(-7.65)#671 |
| 19. | Trenton | 1.1% | 11.7%(-10.6)#19 | 8.8%(-7.63)#696 |
| 20. | Seneca Gardens | 1.2% | 11.7%(-10.6)#20 | 8.8%(-7.63)#702 |
| 21. | Manor Creek | 1.2% | 11.7%(-10.5)#21 | 8.8%(-7.58)#767 |
| 22. | Prospect | 1.3% | 11.7%(-10.5)#22 | 8.8%(-7.51)#850 |
| 23. | Hurstbourne | 1.3% | 11.7%(-10.4)#23 | 8.8%(-7.46)#910 |
| 24. | Langdon Place | 1.3% | 11.7%(-10.4)#24 | 8.8%(-7.46)#911 |
| 25. | Bancroft | 1.4% | 11.7%(-10.3)#25 | 8.8%(-7.39)#988 |
| 26. | Hollow Creek | 1.4% | 11.7%(-10.3)#26 | 8.8%(-7.39)#997 |
| 27. | Villa Hills | 1.4% | 11.7%(-10.3)#27 | 8.8%(-7.38)#998 |
| 28. | River Bluff | 1.4% | 11.7%(-10.3)#28 | 8.8%(-7.35)#1,048 |
| 29. | Chaplin | 1.5% | 11.7%(-10.2)#29 | 8.8%(-7.29)#1,133 |
| 30. | Mackville | 1.5% | 11.7%(-10.2)#30 | 8.8%(-7.27)#1,169 |
| 31. | Maryhill Estates | 1.5% | 11.7%(-10.2)#31 | 8.8%(-7.24)#1,210 |
| 32. | Wellington | 1.6% | 11.7%(-10.2)#32 | 8.8%(-7.21)#1,258 |
| 33. | Blue Ridge Manor | 1.6% | 11.7%(-10.1)#33 | 8.8%(-7.15)#1,335 |
| 34. | Plum Springs | 1.7% | 11.7%(-10.1)#34 | 8.8%(-7.13)#1,358 |
| 35. | Strathmoor Village | 1.8% | 11.7%(-9.95)#35 | 8.8%(-7.01)#1,559 |
| 36. | Norwood | 1.8% | 11.7%(-9.91)#36 | 8.8%(-6.96)#1,612 |
| 37. | Glenview Hills | 2.0% | 11.7%(-9.76)#37 | 8.8%(-6.82)#1,835 |
| 38. | Benham | 2.0% | 11.7%(-9.71)#38 | 8.8%(-6.77)#1,898 |
| 39. | Hendron | 2.0% | 11.7%(-9.71)#39 | 8.8%(-6.77)#1,900 |
| 40. | Pembroke | 2.0% | 11.7%(-9.69)#40 | 8.8%(-6.75)#1,938 |
| 41. | Fox Chase | 2.1% | 11.7%(-9.67)#41 | 8.8%(-6.73)#1,966 |
| 42. | Goshen | 2.3% | 11.7%(-9.39)#42 | 8.8%(-6.45)#2,406 |
| 43. | Hurstbourne Acres | 2.4% | 11.7%(-9.34)#43 | 8.8%(-6.40)#2,470 |
| 44. | Creekside | 2.5% | 11.7%(-9.22)#44 | 8.8%(-6.28)#2,687 |
| 45. | Melbourne | 2.6% | 11.7%(-9.16)#45 | 8.8%(-6.22)#2,781 |
| 46. | Kuttawa | 2.6% | 11.7%(-9.12)#46 | 8.8%(-6.17)#2,862 |
| 47. | Plano | 2.6% | 11.7%(-9.11)#47 | 8.8%(-6.17)#2,869 |
| 48. | Claryville | 2.8% | 11.7%(-8.89)#48 | 8.8%(-5.95)#3,268 |
| 49. | Old Brownsboro Place | 2.9% | 11.7%(-8.83)#49 | 8.8%(-5.88)#3,375 |
| 50. | Verona | 3.0% | 11.7%(-8.73)#50 | 8.8%(-5.79)#3,551 |
| 51. | Edgewood | 3.0% | 11.7%(-8.69)#51 | 8.8%(-5.75)#3,616 |
| 52. | Fort Knox | 3.1% | 11.7%(-8.67)#52 | 8.8%(-5.73)#3,642 |
| 53. | St Regis Park | 3.1% | 11.7%(-8.60)#53 | 8.8%(-5.66)#3,759 |
| 54. | Warfield | 3.3% | 11.7%(-8.45)#54 | 8.8%(-5.50)#4,013 |
| 55. | Ewing | 3.3% | 11.7%(-8.39)#55 | 8.8%(-5.45)#4,120 |
| 56. | Spring Mill | 3.5% | 11.7%(-8.24)#56 | 8.8%(-5.29)#4,362 |
| 57. | Moorland | 3.5% | 11.7%(-8.20)#57 | 8.8%(-5.26)#4,400 |
| 58. | Upton | 3.5% | 11.7%(-8.20)#58 | 8.8%(-5.25)#4,413 |
| 59. | Reidland | 3.6% | 11.7%(-8.16)#59 | 8.8%(-5.22)#4,472 |
| 60. | Lincolnshire | 3.6% | 11.7%(-8.15)#60 | 8.8%(-5.21)#4,506 |
| 61. | Crestwood | 3.6% | 11.7%(-8.14)#61 | 8.8%(-5.20)#4,520 |
| 62. | Fort Thomas | 3.6% | 11.7%(-8.11)#62 | 8.8%(-5.16)#4,581 |
| 63. | Fort Wright | 3.6% | 11.7%(-8.08)#63 | 8.8%(-5.14)#4,625 |
| 64. | Beechwood Village | 3.7% | 11.7%(-8.07)#64 | 8.8%(-5.13)#4,640 |
| 65. | Sadieville | 3.7% | 11.7%(-8.07)#65 | 8.8%(-5.12)#4,649 |
| 66. | Briarwood | 3.7% | 11.7%(-8.02)#66 | 8.8%(-5.08)#4,717 |
| 67. | Sycamore | 3.7% | 11.7%(-8.02)#67 | 8.8%(-5.08)#4,730 |
| 68. | Union | 3.7% | 11.7%(-8.00)#68 | 8.8%(-5.06)#4,762 |
| 69. | Rineyville | 3.8% | 11.7%(-7.97)#69 | 8.8%(-5.02)#4,814 |
| 70. | Elk Creek | 3.8% | 11.7%(-7.94)#70 | 8.8%(-5.00)#4,859 |
| 71. | Fincastle | 3.8% | 11.7%(-7.90)#71 | 8.8%(-4.96)#4,913 |
| 72. | Benton | 3.9% | 11.7%(-7.80)#72 | 8.8%(-4.86)#5,068 |
| 73. | Russell | 4.0% | 11.7%(-7.77)#73 | 8.8%(-4.83)#5,108 |
| 74. | Coldstream | 4.0% | 11.7%(-7.68)#74 | 8.8%(-4.74)#5,255 |
| 75. | Forest Hills | 4.1% | 11.7%(-7.64)#75 | 8.8%(-4.70)#5,313 |
| 76. | Alexandria | 4.1% | 11.7%(-7.59)#76 | 8.8%(-4.65)#5,388 |
| 77. | Ryland Heights | 4.2% | 11.7%(-7.49)#77 | 8.8%(-4.55)#5,548 |
| 78. | Heritage Creek | 4.3% | 11.7%(-7.39)#78 | 8.8%(-4.45)#5,716 |
| 79. | Florence | 4.3% | 11.7%(-7.39)#79 | 8.8%(-4.44)#5,719 |
| 80. | Independence | 4.7% | 11.7%(-7.01)#80 | 8.8%(-4.07)#6,321 |
| 81. | Hebron | 4.8% | 11.7%(-6.97)#81 | 8.8%(-4.02)#6,357 |
| 82. | Windy Hills | 4.8% | 11.7%(-6.96)#82 | 8.8%(-4.02)#6,363 |
| 83. | Jeffersontown | 4.8% | 11.7%(-6.90)#83 | 8.8%(-3.95)#6,476 |
| 84. | Diablock | 4.8% | 11.7%(-6.90)#84 | 8.8%(-3.95)#6,480 |
| 85. | Bromley | 4.9% | 11.7%(-6.84)#85 | 8.8%(-3.89)#6,572 |
| 86. | Milton | 4.9% | 11.7%(-6.83)#86 | 8.8%(-3.89)#6,579 |
| 87. | Corinth | 4.9% | 11.7%(-6.81)#87 | 8.8%(-3.86)#6,623 |
| 88. | Pioneer Village | 5.0% | 11.7%(-6.76)#88 | 8.8%(-3.81)#6,693 |
| 89. | Mount Washington | 5.0% | 11.7%(-6.75)#89 | 8.8%(-3.81)#6,705 |
| 90. | Hunters Hollow | 5.0% | 11.7%(-6.72)#90 | 8.8%(-3.78)#6,755 |
| 91. | Hollyvilla | 5.2% | 11.7%(-6.52)#91 | 8.8%(-3.57)#7,082 |
| 92. | Midway | 5.2% | 11.7%(-6.51)#92 | 8.8%(-3.56)#7,088 |
| 93. | Loretto | 5.3% | 11.7%(-6.46)#93 | 8.8%(-3.52)#7,165 |
| 94. | Millersburg | 5.3% | 11.7%(-6.39)#94 | 8.8%(-3.45)#7,296 |
| 95. | Simpsonville | 5.4% | 11.7%(-6.32)#95 | 8.8%(-3.37)#7,410 |
| 96. | St Matthews | 5.5% | 11.7%(-6.24)#96 | 8.8%(-3.29)#7,538 |
| 97. | Doe Valley | 5.7% | 11.7%(-6.02)#97 | 8.8%(-3.07)#7,858 |
| 98. | Bloomfield | 5.8% | 11.7%(-5.89)#98 | 8.8%(-2.94)#8,061 |
| 99. | Fort Mitchell | 5.9% | 11.7%(-5.85)#99 | 8.8%(-2.91)#8,102 |
| 100. | Barbourmeade | 5.9% | 11.7%(-5.81)#100 | 8.8%(-2.87)#8,182 |
Common Questions
What are the Top 10 Cities with the Lowest Poverty Level Among Families in Kentucky?
Top 10 Cities with the Lowest Poverty Level Among Families in Kentucky are:
#1
0.58%
#2
0.59%
#3
0.63%
#4
0.68%
#5
0.69%
#6
0.69%
#7
0.70%
#8
0.82%
#9
0.97%
#10
0.98%
What city has the Lowest Poverty Level Among Families in Kentucky?
Indian Hills has the Lowest Poverty Level Among Families in Kentucky with 0.58%.
What is the Poverty Level Among Families in the State of Kentucky?
Poverty Level Among Families in Kentucky is 11.7%.
What is the Poverty Level Among Families in the United States?
Poverty Level Among Families in the United States is 8.8%.