Cities with the Lowest Poverty Level Among Families in Washington
RELATED REPORTS & OPTIONS
Lowest Family Poverty
Washington
Compare Cities
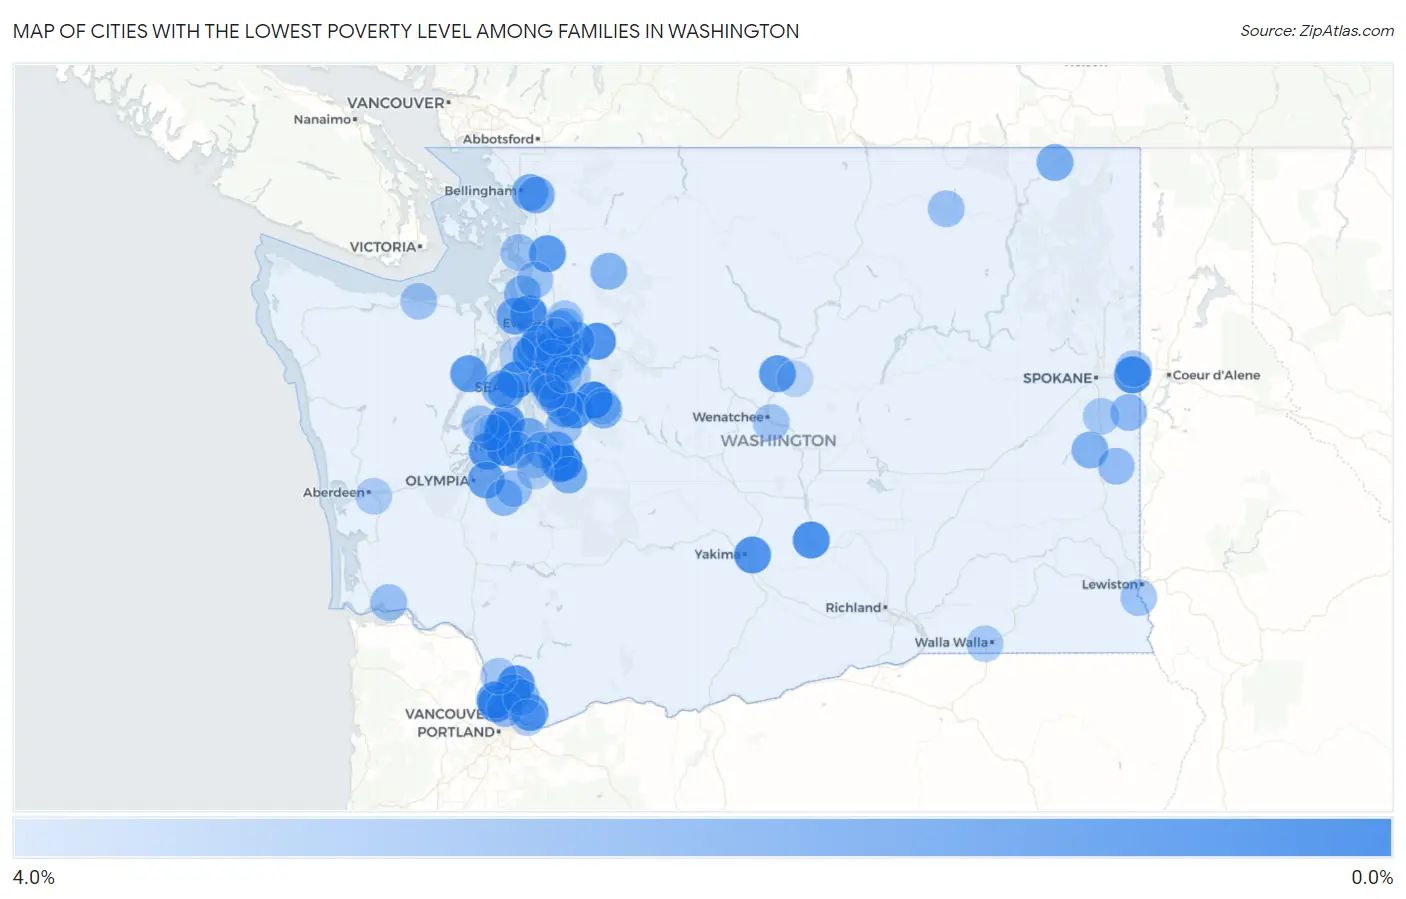
Map of Cities with the Lowest Poverty Level Among Families in Washington
4.0%
0.0%
Cities with the Lowest Poverty Level Among Families in Washington
| City | Family Poverty | vs State | vs National | |
| 1. | Snoqualmie | 0.33% | 6.3%(-6.02)#1 | 8.8%(-8.45)#31 |
| 2. | Prairie Heights | 0.45% | 6.3%(-5.90)#2 | 8.8%(-8.33)#64 |
| 3. | Rosedale | 0.51% | 6.3%(-5.84)#3 | 8.8%(-8.28)#89 |
| 4. | Bainbridge Island | 0.61% | 6.3%(-5.74)#4 | 8.8%(-8.17)#161 |
| 5. | Fox Island | 0.70% | 6.3%(-5.65)#5 | 8.8%(-8.08)#229 |
| 6. | Langley | 0.71% | 6.3%(-5.64)#6 | 8.8%(-8.07)#236 |
| 7. | Tehaleh | 0.76% | 6.3%(-5.59)#7 | 8.8%(-8.02)#282 |
| 8. | Liberty Lake | 0.77% | 6.3%(-5.58)#8 | 8.8%(-8.01)#293 |
| 9. | Artondale | 0.78% | 6.3%(-5.57)#9 | 8.8%(-8.00)#301 |
| 10. | Desert Aire | 0.82% | 6.3%(-5.53)#10 | 8.8%(-7.96)#338 |
| 11. | Woodway | 0.83% | 6.3%(-5.52)#11 | 8.8%(-7.95)#352 |
| 12. | Sultan | 0.85% | 6.3%(-5.50)#12 | 8.8%(-7.93)#367 |
| 13. | Terrace Heights | 0.94% | 6.3%(-5.41)#13 | 8.8%(-7.84)#465 |
| 14. | Mirrormont | 1.00% | 6.3%(-5.35)#14 | 8.8%(-7.78)#527 |
| 15. | Lake Shore | 1.0% | 6.3%(-5.32)#15 | 8.8%(-7.76)#553 |
| 16. | Lewisville | 1.0% | 6.3%(-5.31)#16 | 8.8%(-7.75)#567 |
| 17. | Lexington | 1.1% | 6.3%(-5.30)#17 | 8.8%(-7.73)#588 |
| 18. | Prairie Ridge | 1.1% | 6.3%(-5.30)#18 | 8.8%(-7.73)#593 |
| 19. | Longbranch | 1.1% | 6.3%(-5.29)#19 | 8.8%(-7.73)#594 |
| 20. | Purdy | 1.1% | 6.3%(-5.29)#20 | 8.8%(-7.72)#606 |
| 21. | Fern Prairie | 1.2% | 6.3%(-5.19)#21 | 8.8%(-7.62)#704 |
| 22. | Clearview | 1.2% | 6.3%(-5.17)#22 | 8.8%(-7.61)#725 |
| 23. | Brinnon | 1.2% | 6.3%(-5.17)#23 | 8.8%(-7.61)#729 |
| 24. | Big Lake | 1.2% | 6.3%(-5.17)#24 | 8.8%(-7.60)#736 |
| 25. | Entiat | 1.2% | 6.3%(-5.15)#25 | 8.8%(-7.59)#754 |
| 26. | Beaux Arts Village | 1.2% | 6.3%(-5.11)#26 | 8.8%(-7.55)#813 |
| 27. | Lake Forest Park | 1.2% | 6.3%(-5.11)#27 | 8.8%(-7.54)#816 |
| 28. | Meadow Glade | 1.3% | 6.3%(-5.03)#28 | 8.8%(-7.46)#906 |
| 29. | Felida | 1.3% | 6.3%(-5.02)#29 | 8.8%(-7.46)#913 |
| 30. | Picnic Point | 1.4% | 6.3%(-4.93)#30 | 8.8%(-7.36)#1,030 |
| 31. | Tanglewilde | 1.4% | 6.3%(-4.92)#31 | 8.8%(-7.35)#1,053 |
| 32. | Alderwood Manor | 1.5% | 6.3%(-4.87)#32 | 8.8%(-7.31)#1,117 |
| 33. | High Bridge | 1.5% | 6.3%(-4.87)#33 | 8.8%(-7.30)#1,121 |
| 34. | East Renton Highlands | 1.5% | 6.3%(-4.82)#34 | 8.8%(-7.25)#1,193 |
| 35. | Lake Tapps | 1.6% | 6.3%(-4.77)#35 | 8.8%(-7.20)#1,263 |
| 36. | Enetai | 1.6% | 6.3%(-4.76)#36 | 8.8%(-7.19)#1,272 |
| 37. | Freeland | 1.6% | 6.3%(-4.74)#37 | 8.8%(-7.17)#1,307 |
| 38. | Monroe North | 1.7% | 6.3%(-4.68)#38 | 8.8%(-7.11)#1,389 |
| 39. | Bothell East | 1.7% | 6.3%(-4.63)#39 | 8.8%(-7.06)#1,461 |
| 40. | Geneva | 1.8% | 6.3%(-4.54)#40 | 8.8%(-6.97)#1,604 |
| 41. | Maltby | 1.8% | 6.3%(-4.51)#41 | 8.8%(-6.95)#1,635 |
| 42. | Sudden Valley | 1.9% | 6.3%(-4.49)#42 | 8.8%(-6.92)#1,676 |
| 43. | Brier | 1.9% | 6.3%(-4.48)#43 | 8.8%(-6.91)#1,685 |
| 44. | Woodinville | 1.9% | 6.3%(-4.48)#44 | 8.8%(-6.91)#1,691 |
| 45. | Bothell West | 1.9% | 6.3%(-4.46)#45 | 8.8%(-6.90)#1,711 |
| 46. | Clyde Hill | 1.9% | 6.3%(-4.45)#46 | 8.8%(-6.89)#1,733 |
| 47. | Cottage Lake | 1.9% | 6.3%(-4.45)#47 | 8.8%(-6.88)#1,744 |
| 48. | Suncrest | 1.9% | 6.3%(-4.42)#48 | 8.8%(-6.86)#1,791 |
| 49. | Carbonado | 1.9% | 6.3%(-4.40)#49 | 8.8%(-6.83)#1,822 |
| 50. | Northport | 2.0% | 6.3%(-4.39)#50 | 8.8%(-6.82)#1,839 |
| 51. | Riverbend | 2.0% | 6.3%(-4.38)#51 | 8.8%(-6.81)#1,849 |
| 52. | Dash Point | 2.0% | 6.3%(-4.36)#52 | 8.8%(-6.80)#1,870 |
| 53. | Malden | 2.1% | 6.3%(-4.27)#53 | 8.8%(-6.70)#2,010 |
| 54. | Medina | 2.1% | 6.3%(-4.25)#54 | 8.8%(-6.68)#2,032 |
| 55. | Camano | 2.1% | 6.3%(-4.21)#55 | 8.8%(-6.64)#2,088 |
| 56. | Fircrest | 2.2% | 6.3%(-4.19)#56 | 8.8%(-6.62)#2,125 |
| 57. | Minnehaha | 2.2% | 6.3%(-4.15)#57 | 8.8%(-6.58)#2,178 |
| 58. | Swede Heaven | 2.2% | 6.3%(-4.14)#58 | 8.8%(-6.57)#2,189 |
| 59. | Hockinson | 2.2% | 6.3%(-4.11)#59 | 8.8%(-6.55)#2,247 |
| 60. | Yelm | 2.2% | 6.3%(-4.11)#60 | 8.8%(-6.54)#2,249 |
| 61. | Fobes Hill | 2.3% | 6.3%(-4.10)#61 | 8.8%(-6.53)#2,270 |
| 62. | Edgewood | 2.3% | 6.3%(-4.08)#62 | 8.8%(-6.51)#2,291 |
| 63. | Edmonds | 2.3% | 6.3%(-4.07)#63 | 8.8%(-6.50)#2,326 |
| 64. | Rocky Point | 2.3% | 6.3%(-4.05)#64 | 8.8%(-6.48)#2,350 |
| 65. | Newcastle | 2.4% | 6.3%(-4.00)#65 | 8.8%(-6.43)#2,431 |
| 66. | Rockford | 2.4% | 6.3%(-3.99)#66 | 8.8%(-6.42)#2,449 |
| 67. | Mill Creek East | 2.4% | 6.3%(-3.96)#67 | 8.8%(-6.40)#2,488 |
| 68. | Cathcart | 2.5% | 6.3%(-3.86)#68 | 8.8%(-6.29)#2,659 |
| 69. | Oakesdale | 2.5% | 6.3%(-3.85)#69 | 8.8%(-6.28)#2,685 |
| 70. | Roy | 2.6% | 6.3%(-3.77)#70 | 8.8%(-6.21)#2,806 |
| 71. | Republic | 2.6% | 6.3%(-3.76)#71 | 8.8%(-6.20)#2,825 |
| 72. | La Conner | 2.6% | 6.3%(-3.76)#72 | 8.8%(-6.19)#2,835 |
| 73. | Allyn | 2.6% | 6.3%(-3.75)#73 | 8.8%(-6.18)#2,857 |
| 74. | Rosburg | 2.6% | 6.3%(-3.74)#74 | 8.8%(-6.17)#2,864 |
| 75. | Asotin | 2.7% | 6.3%(-3.66)#75 | 8.8%(-6.10)#3,006 |
| 76. | Stanwood | 2.7% | 6.3%(-3.63)#76 | 8.8%(-6.07)#3,045 |
| 77. | Covington | 2.7% | 6.3%(-3.63)#77 | 8.8%(-6.06)#3,064 |
| 78. | Bunk Foss | 2.7% | 6.3%(-3.63)#78 | 8.8%(-6.06)#3,066 |
| 79. | Meadowdale | 2.7% | 6.3%(-3.62)#79 | 8.8%(-6.05)#3,081 |
| 80. | Port Angeles East | 2.8% | 6.3%(-3.59)#80 | 8.8%(-6.03)#3,120 |
| 81. | Bothell | 2.8% | 6.3%(-3.58)#81 | 8.8%(-6.01)#3,136 |
| 82. | South Wenatchee | 2.8% | 6.3%(-3.57)#82 | 8.8%(-6.00)#3,154 |
| 83. | La Center | 2.9% | 6.3%(-3.50)#83 | 8.8%(-5.93)#3,292 |
| 84. | Otis Orchards East Farms | 2.9% | 6.3%(-3.48)#84 | 8.8%(-5.91)#3,332 |
| 85. | Lake Stevens | 2.9% | 6.3%(-3.46)#85 | 8.8%(-5.89)#3,357 |
| 86. | Spangle | 2.9% | 6.3%(-3.45)#86 | 8.8%(-5.88)#3,378 |
| 87. | Summit | 2.9% | 6.3%(-3.45)#87 | 8.8%(-5.88)#3,385 |
| 88. | Erlands Point | 2.9% | 6.3%(-3.44)#88 | 8.8%(-5.87)#3,399 |
| 89. | Union Hill Novelty Hill | 2.9% | 6.3%(-3.40)#89 | 8.8%(-5.83)#3,470 |
| 90. | Garrett | 3.0% | 6.3%(-3.39)#90 | 8.8%(-5.82)#3,491 |
| 91. | Cosmopolis | 3.0% | 6.3%(-3.36)#91 | 8.8%(-5.79)#3,546 |
| 92. | Camas | 3.0% | 6.3%(-3.32)#92 | 8.8%(-5.76)#3,588 |
| 93. | North Bend | 3.1% | 6.3%(-3.29)#93 | 8.8%(-5.72)#3,655 |
| 94. | Frederickson | 3.1% | 6.3%(-3.27)#94 | 8.8%(-5.70)#3,687 |
| 95. | Key Center | 3.2% | 6.3%(-3.18)#95 | 8.8%(-5.61)#3,837 |
| 96. | Eastmont | 3.2% | 6.3%(-3.15)#96 | 8.8%(-5.58)#3,877 |
| 97. | Mercer Island | 3.2% | 6.3%(-3.11)#97 | 8.8%(-5.54)#3,951 |
| 98. | Waterville | 3.3% | 6.3%(-3.06)#98 | 8.8%(-5.50)#4,022 |
| 99. | Kingston | 3.3% | 6.3%(-3.06)#99 | 8.8%(-5.49)#4,036 |
| 100. | Redmond | 3.3% | 6.3%(-3.05)#100 | 8.8%(-5.48)#4,051 |
Common Questions
What are the Top 10 Cities with the Lowest Poverty Level Among Families in Washington?
Top 10 Cities with the Lowest Poverty Level Among Families in Washington are:
#1
0.33%
#2
0.45%
#3
0.51%
#4
0.61%
#5
0.70%
#6
0.71%
#7
0.77%
#8
0.78%
#9
0.82%
#10
0.83%
What city has the Lowest Poverty Level Among Families in Washington?
Snoqualmie has the Lowest Poverty Level Among Families in Washington with 0.33%.
What is the Poverty Level Among Families in the State of Washington?
Poverty Level Among Families in Washington is 6.3%.
What is the Poverty Level Among Families in the United States?
Poverty Level Among Families in the United States is 8.8%.