San Martin, CA Map & Demographics
San Martin Map
San Martin Overview
$56,005
PER CAPITA INCOME
$150,208
AVG FAMILY INCOME
$141,296
AVG HOUSEHOLD INCOME
23.7%
WAGE / INCOME GAP [ % ]
76.3¢/ $1
WAGE / INCOME GAP [ $ ]
0.43
INEQUALITY / GINI INDEX
6,289
TOTAL POPULATION
3,220
MALE POPULATION
3,069
FEMALE POPULATION
104.92
MALES / 100 FEMALES
95.31
FEMALES / 100 MALES
52.1
MEDIAN AGE
3.1
AVG FAMILY SIZE
2.9
AVG HOUSEHOLD SIZE
3,415
LABOR FORCE [ PEOPLE ]
61.2%
PERCENT IN LABOR FORCE
5.9%
UNEMPLOYMENT RATE
San Martin Zip Codes
Income in San Martin
Income Overview in San Martin
Per Capita Income in San Martin is $56,005, while median incomes of families and households are $150,208 and $141,296 respectively.
| Characteristic | Number | Measure |
| Per Capita Income | 6,289 | $56,005 |
| Median Family Income | 1,675 | $150,208 |
| Mean Family Income | 1,675 | $180,201 |
| Median Household Income | 2,036 | $141,296 |
| Mean Household Income | 2,036 | $169,005 |
| Income Deficit | 1,675 | $0 |
| Wage / Income Gap (%) | 6,289 | 23.72% |
| Wage / Income Gap ($) | 6,289 | 76.28¢ per $1 |
| Gini / Inequality Index | 6,289 | 0.43 |
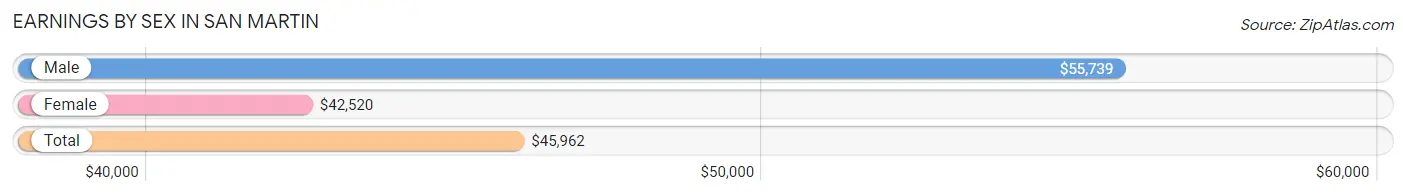
Earnings by Sex in San Martin
Average Earnings in San Martin are $45,962, $55,739 for men and $42,520 for women, a difference of 23.7%.
| Sex | Number | Average Earnings |
| Male | 1,771 (52.4%) | $55,739 |
| Female | 1,609 (47.6%) | $42,520 |
| Total | 3,380 (100.0%) | $45,962 |
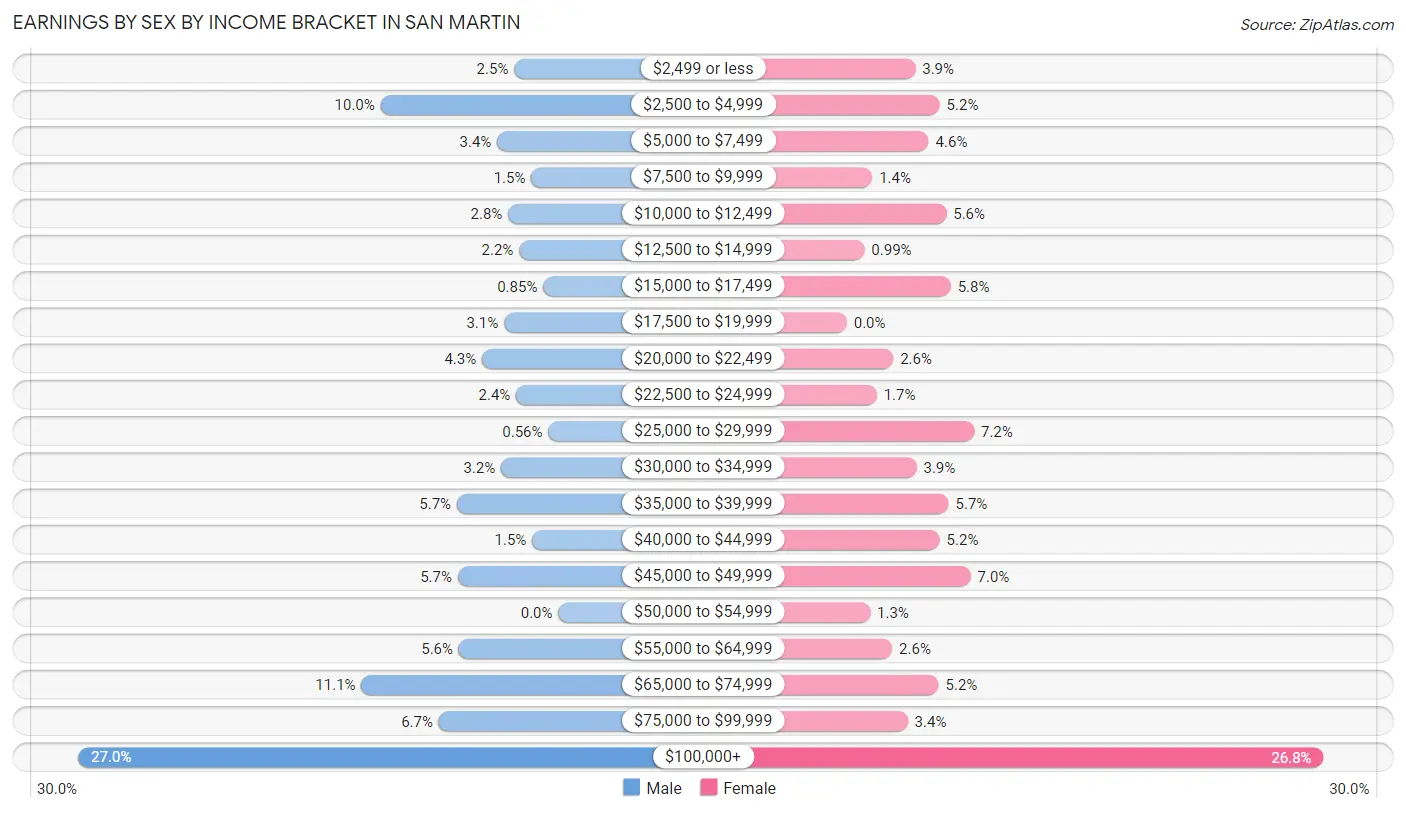
Earnings by Sex by Income Bracket in San Martin
The most common earnings brackets in San Martin are $100,000+ for men (478 | 27.0%) and $100,000+ for women (431 | 26.8%).
| Income | Male | Female |
| $2,499 or less | 44 (2.5%) | 62 (3.8%) |
| $2,500 to $4,999 | 177 (10.0%) | 84 (5.2%) |
| $5,000 to $7,499 | 61 (3.4%) | 74 (4.6%) |
| $7,500 to $9,999 | 27 (1.5%) | 23 (1.4%) |
| $10,000 to $12,499 | 50 (2.8%) | 90 (5.6%) |
| $12,500 to $14,999 | 39 (2.2%) | 16 (1.0%) |
| $15,000 to $17,499 | 15 (0.9%) | 94 (5.8%) |
| $17,500 to $19,999 | 54 (3.0%) | 0 (0.0%) |
| $20,000 to $22,499 | 76 (4.3%) | 42 (2.6%) |
| $22,500 to $24,999 | 42 (2.4%) | 27 (1.7%) |
| $25,000 to $29,999 | 10 (0.6%) | 115 (7.1%) |
| $30,000 to $34,999 | 57 (3.2%) | 63 (3.9%) |
| $35,000 to $39,999 | 101 (5.7%) | 92 (5.7%) |
| $40,000 to $44,999 | 26 (1.5%) | 84 (5.2%) |
| $45,000 to $49,999 | 100 (5.7%) | 112 (7.0%) |
| $50,000 to $54,999 | 0 (0.0%) | 21 (1.3%) |
| $55,000 to $64,999 | 99 (5.6%) | 41 (2.5%) |
| $65,000 to $74,999 | 196 (11.1%) | 83 (5.2%) |
| $75,000 to $99,999 | 119 (6.7%) | 55 (3.4%) |
| $100,000+ | 478 (27.0%) | 431 (26.8%) |
| Total | 1,771 (100.0%) | 1,609 (100.0%) |
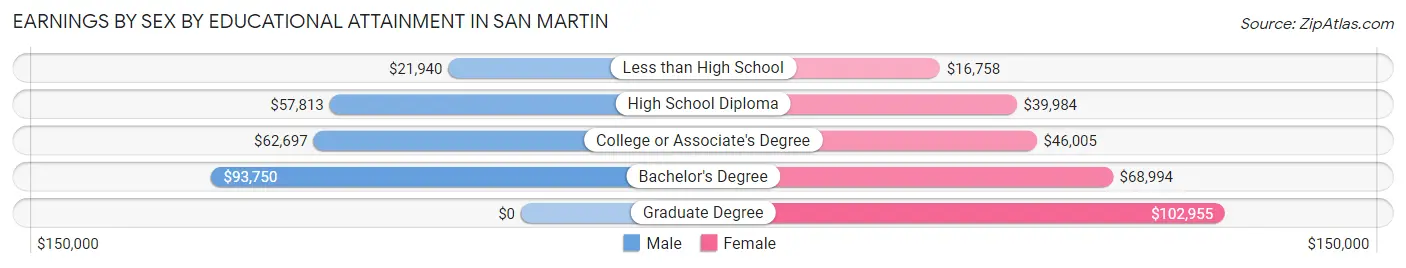
Earnings by Sex by Educational Attainment in San Martin
Average earnings in San Martin are $62,356 for men and $45,800 for women, a difference of 26.6%. Men with an educational attainment of bachelor's degree enjoy the highest average annual earnings of $93,750, while those with less than high school education earn the least with $21,940. Women with an educational attainment of graduate degree earn the most with the average annual earnings of $102,955, while those with less than high school education have the smallest earnings of $16,758.
| Educational Attainment | Male Income | Female Income |
| Less than High School | $21,940 | $16,758 |
| High School Diploma | $57,813 | $39,984 |
| College or Associate's Degree | $62,697 | $46,005 |
| Bachelor's Degree | $93,750 | $68,994 |
| Graduate Degree | - | - |
| Total | $62,356 | $45,800 |
Family Income in San Martin
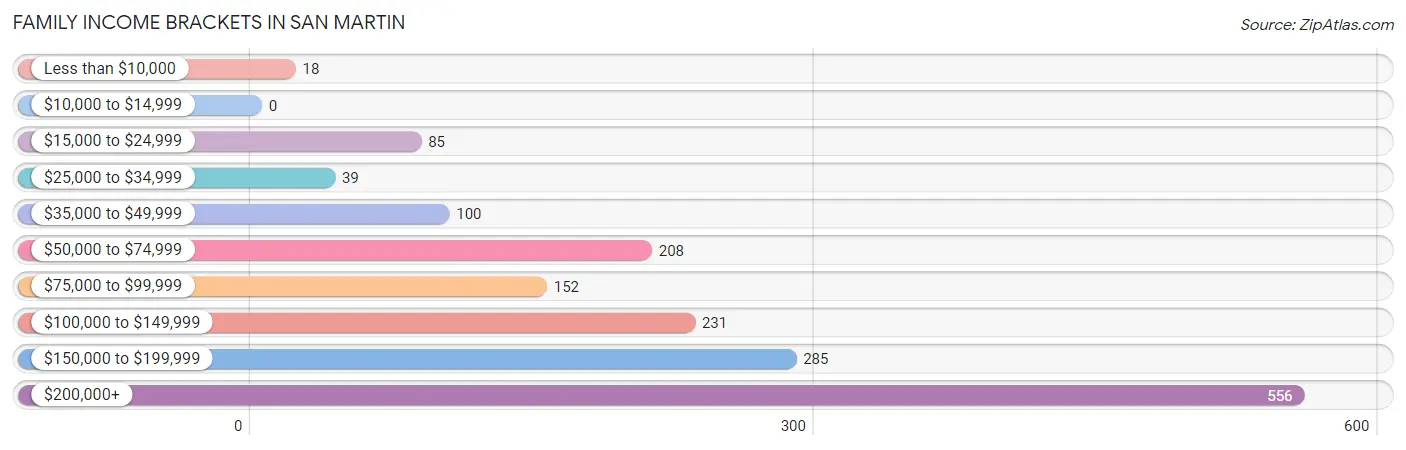
Family Income Brackets in San Martin
According to the San Martin family income data, there are 556 families falling into the $200,000+ income range, which is the most common income bracket and makes up 33.2% of all families.
| Income Bracket | # Families | % Families |
| Less than $10,000 | 18 | 1.1% |
| $10,000 to $14,999 | 0 | 0.0% |
| $15,000 to $24,999 | 85 | 5.1% |
| $25,000 to $34,999 | 39 | 2.3% |
| $35,000 to $49,999 | 100 | 6.0% |
| $50,000 to $74,999 | 208 | 12.4% |
| $75,000 to $99,999 | 152 | 9.1% |
| $100,000 to $149,999 | 231 | 13.8% |
| $150,000 to $199,999 | 285 | 17.0% |
| $200,000+ | 556 | 33.2% |
Family Income by Famaliy Size in San Martin
6-person families (42 | 2.5%) account for the highest median family income in San Martin with $250,001 per family, while 2-person families (693 | 41.4%) have the highest median income of $55,703 per family member.

| Income Bracket | # Families | Median Income |
| 2-Person Families | 693 (41.4%) | $111,406 |
| 3-Person Families | 508 (30.3%) | $157,017 |
| 4-Person Families | 330 (19.7%) | $96,979 |
| 5-Person Families | 78 (4.7%) | $196,250 |
| 6-Person Families | 42 (2.5%) | $250,001 |
| 7+ Person Families | 24 (1.4%) | $0 |
| Total | 1,675 (100.0%) | $150,208 |
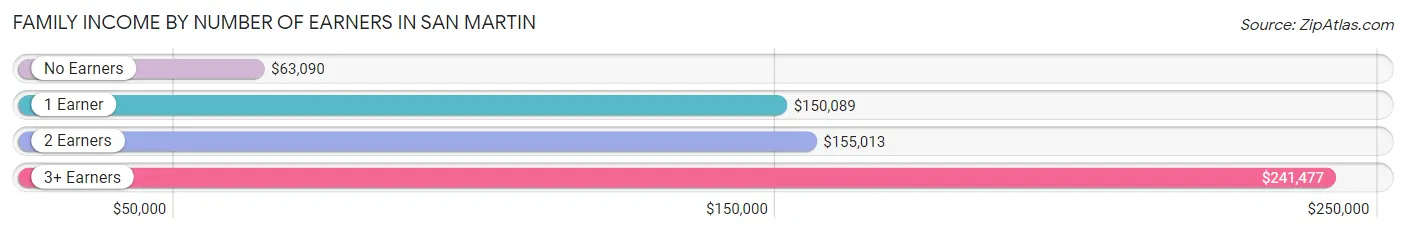
Family Income by Number of Earners in San Martin
The median family income in San Martin is $150,208, with families comprising 3+ earners (233) having the highest median family income of $241,477, while families with no earners (294) have the lowest median family income of $63,090, accounting for 13.9% and 17.5% of families, respectively.
| Number of Earners | # Families | Median Income |
| No Earners | 294 (17.5%) | $63,090 |
| 1 Earner | 497 (29.7%) | $150,089 |
| 2 Earners | 651 (38.9%) | $155,013 |
| 3+ Earners | 233 (13.9%) | $241,477 |
| Total | 1,675 (100.0%) | $150,208 |
Household Income in San Martin
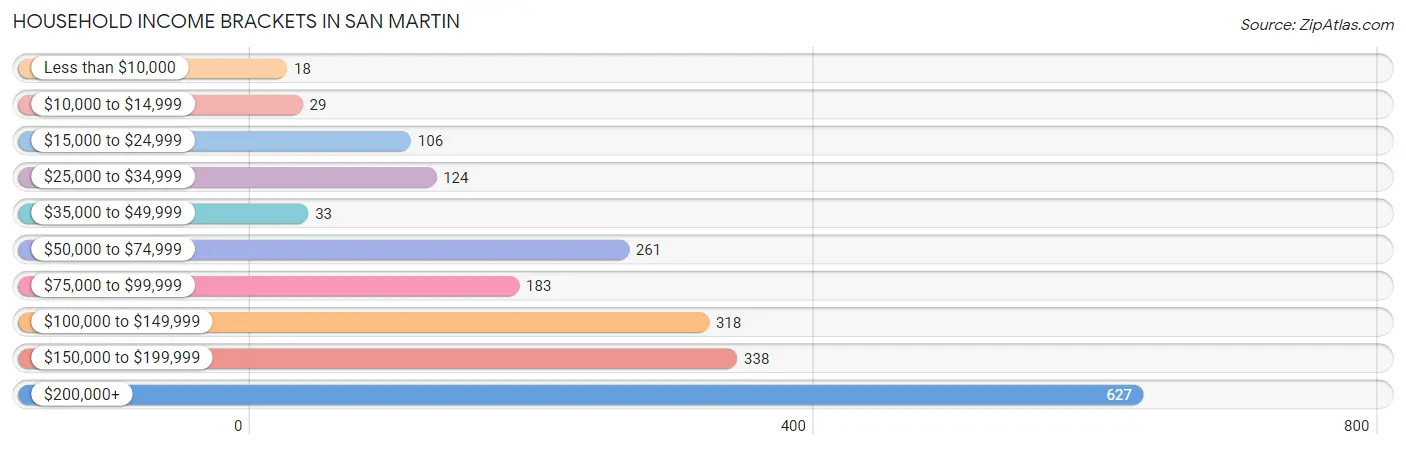
Household Income Brackets in San Martin
With 627 households falling in the category, the $200,000+ income range is the most frequent in San Martin, accounting for 30.8% of all households. In contrast, only 18 households (0.9%) fall into the less than $10,000 income bracket, making it the least populous group.
| Income Bracket | # Households | % Households |
| Less than $10,000 | 18 | 0.9% |
| $10,000 to $14,999 | 29 | 1.4% |
| $15,000 to $24,999 | 106 | 5.2% |
| $25,000 to $34,999 | 124 | 6.1% |
| $35,000 to $49,999 | 33 | 1.6% |
| $50,000 to $74,999 | 261 | 12.8% |
| $75,000 to $99,999 | 183 | 9.0% |
| $100,000 to $149,999 | 318 | 15.6% |
| $150,000 to $199,999 | 338 | 16.6% |
| $200,000+ | 627 | 30.8% |
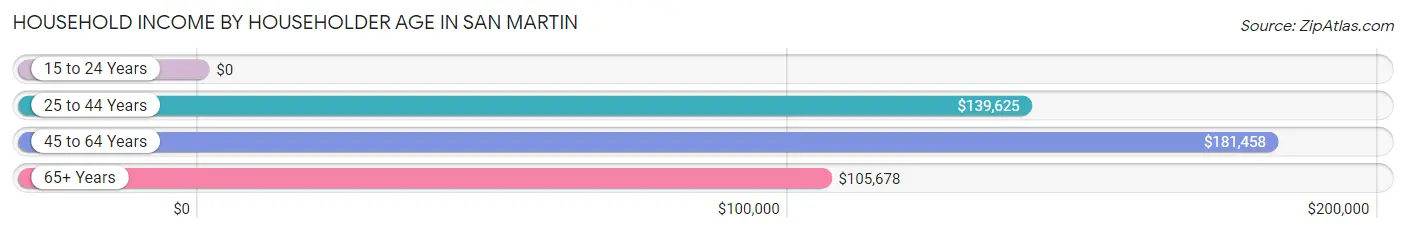
Household Income by Householder Age in San Martin
The median household income in San Martin is $141,296, with the highest median household income of $181,458 found in the 45 to 64 years age bracket for the primary householder. A total of 749 households (36.8%) fall into this category.
| Income Bracket | # Households | Median Income |
| 15 to 24 Years | 0 (0.0%) | $0 |
| 25 to 44 Years | 401 (19.7%) | $139,625 |
| 45 to 64 Years | 749 (36.8%) | $181,458 |
| 65+ Years | 886 (43.5%) | $105,678 |
| Total | 2,036 (100.0%) | $141,296 |
Poverty in San Martin
Income Below Poverty by Sex and Age in San Martin
With 11.8% poverty level for males and 2.6% for females among the residents of San Martin, under 5 year old males and 12 to 14 year old females are the most vulnerable to poverty, with 25 males (100.0%) and 23 females (25.0%) in their respective age groups living below the poverty level.
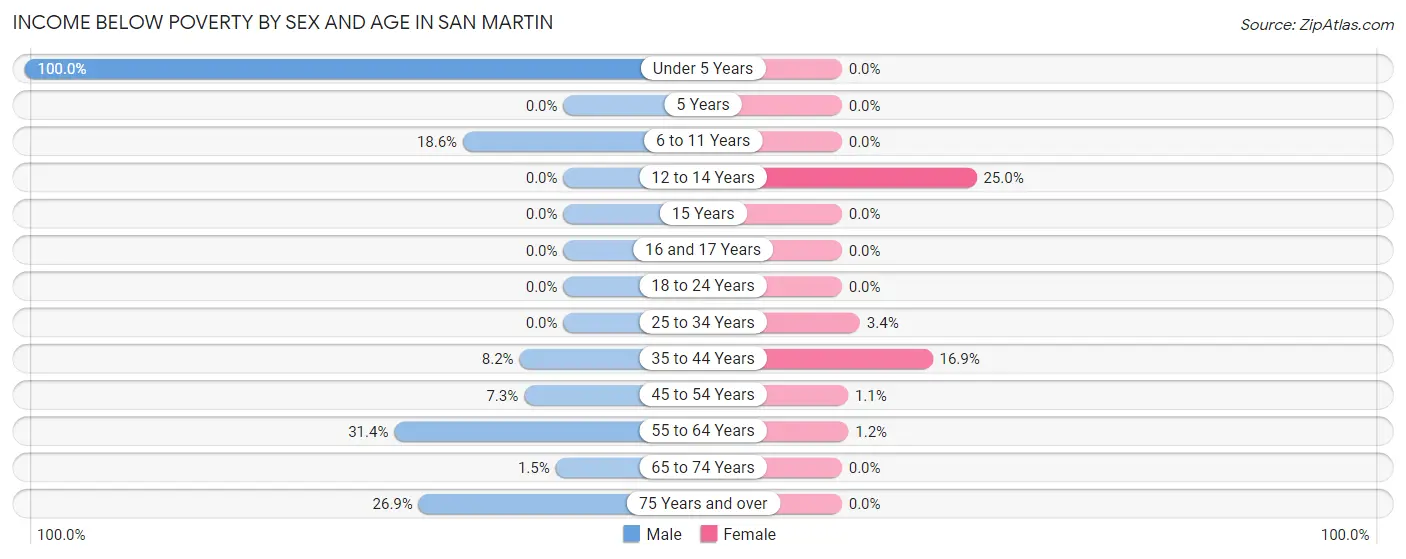
| Age Bracket | Male | Female |
| Under 5 Years | 25 (100.0%) | 0 (0.0%) |
| 5 Years | 0 (0.0%) | 0 (0.0%) |
| 6 to 11 Years | 22 (18.6%) | 0 (0.0%) |
| 12 to 14 Years | 0 (0.0%) | 23 (25.0%) |
| 15 Years | 0 (0.0%) | 0 (0.0%) |
| 16 and 17 Years | 0 (0.0%) | 0 (0.0%) |
| 18 to 24 Years | 0 (0.0%) | 0 (0.0%) |
| 25 to 34 Years | 0 (0.0%) | 13 (3.4%) |
| 35 to 44 Years | 33 (8.2%) | 31 (16.9%) |
| 45 to 54 Years | 36 (7.3%) | 6 (1.1%) |
| 55 to 64 Years | 188 (31.4%) | 7 (1.2%) |
| 65 to 74 Years | 8 (1.5%) | 0 (0.0%) |
| 75 Years and over | 65 (26.9%) | 0 (0.0%) |
| Total | 377 (11.8%) | 80 (2.6%) |
Income Above Poverty by Sex and Age in San Martin
According to the poverty statistics in San Martin, males aged 12 to 14 years and females aged under 5 years are the age groups that are most secure financially, with 100.0% of males and 100.0% of females in these age groups living above the poverty line.
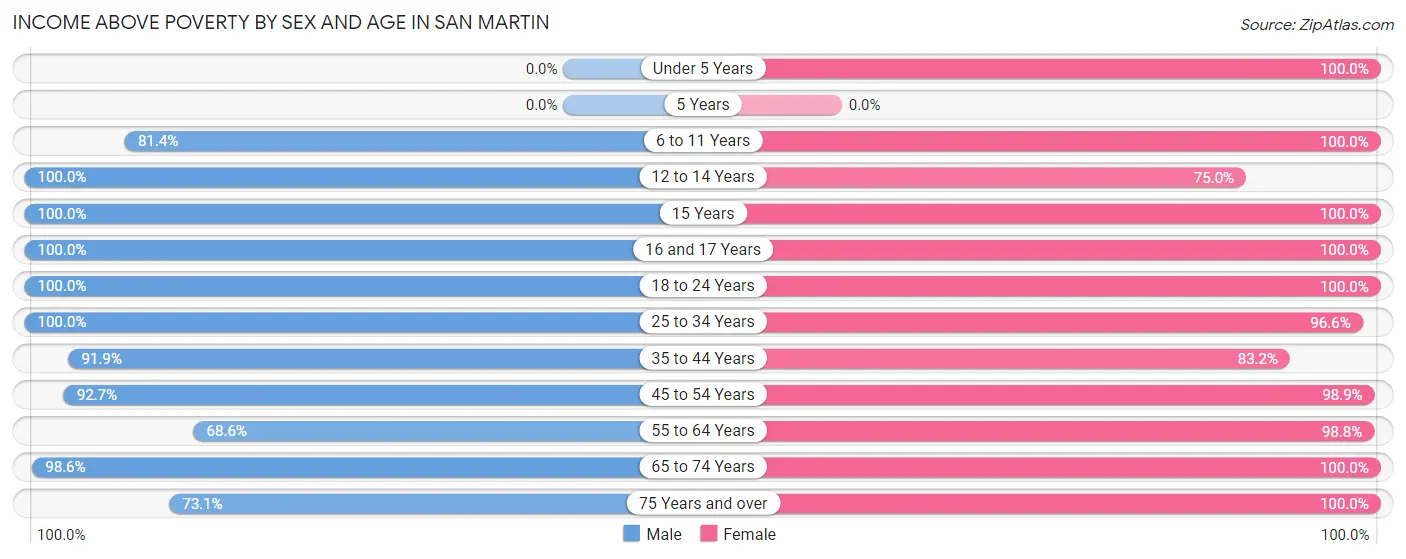
| Age Bracket | Male | Female |
| Under 5 Years | 0 (0.0%) | 120 (100.0%) |
| 5 Years | 0 (0.0%) | 0 (0.0%) |
| 6 to 11 Years | 96 (81.4%) | 94 (100.0%) |
| 12 to 14 Years | 135 (100.0%) | 69 (75.0%) |
| 15 Years | 51 (100.0%) | 73 (100.0%) |
| 16 and 17 Years | 57 (100.0%) | 132 (100.0%) |
| 18 to 24 Years | 219 (100.0%) | 178 (100.0%) |
| 25 to 34 Years | 310 (100.0%) | 374 (96.6%) |
| 35 to 44 Years | 372 (91.8%) | 153 (83.2%) |
| 45 to 54 Years | 458 (92.7%) | 521 (98.9%) |
| 55 to 64 Years | 411 (68.6%) | 569 (98.8%) |
| 65 to 74 Years | 543 (98.6%) | 439 (100.0%) |
| 75 Years and over | 177 (73.1%) | 257 (100.0%) |
| Total | 2,829 (88.2%) | 2,979 (97.4%) |
Income Below Poverty Among Married-Couple Families in San Martin
The poverty statistics for married-couple families in San Martin show that 2.0% or 26 of the total 1,293 families live below the poverty line. Families with 3 or 4 children have the highest poverty rate of 100.0%, comprising of 19 families. On the other hand, families with 1 or 2 children have the lowest poverty rate of 0.0%, which includes 0 families.
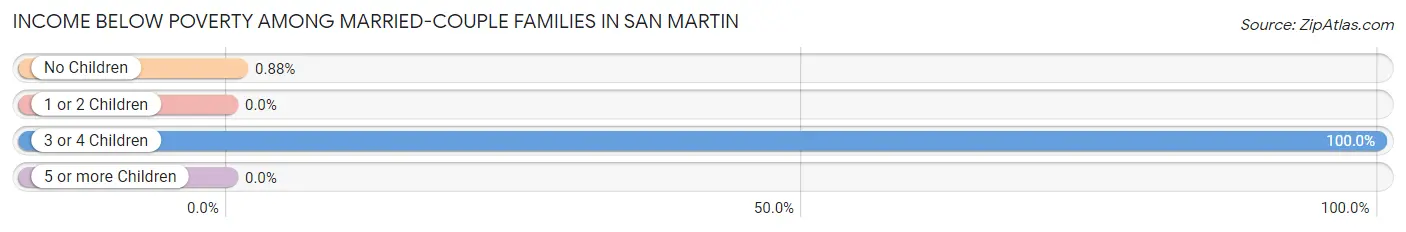
| Children | Above Poverty | Below Poverty |
| No Children | 791 (99.1%) | 7 (0.9%) |
| 1 or 2 Children | 476 (100.0%) | 0 (0.0%) |
| 3 or 4 Children | 0 (0.0%) | 19 (100.0%) |
| 5 or more Children | 0 (0.0%) | 0 (0.0%) |
| Total | 1,267 (98.0%) | 26 (2.0%) |
Income Below Poverty Among Single-Parent Households in San Martin
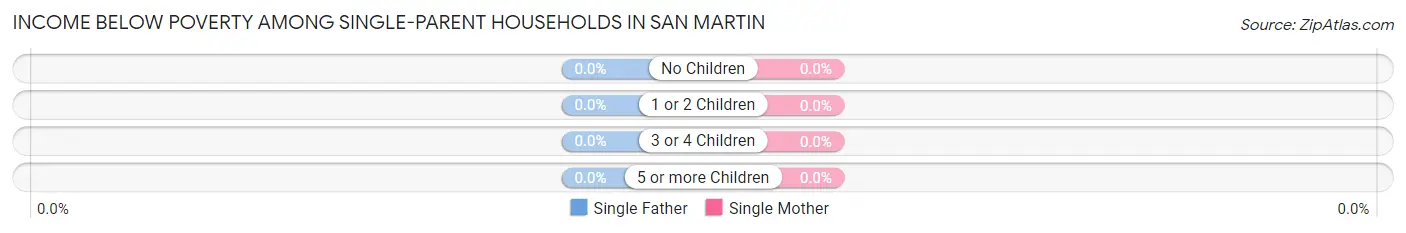
| Children | Single Father | Single Mother |
| No Children | 0 (0.0%) | 0 (0.0%) |
| 1 or 2 Children | 0 (0.0%) | 0 (0.0%) |
| 3 or 4 Children | 0 (0.0%) | 0 (0.0%) |
| 5 or more Children | 0 (0.0%) | 0 (0.0%) |
| Total | 0 (0.0%) | 0 (0.0%) |
Income Below Poverty Among Married-Couple vs Single-Parent Households in San Martin
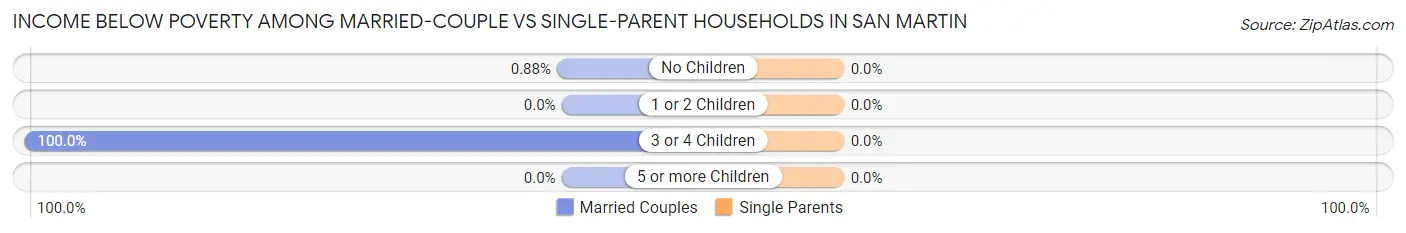
| Children | Married-Couple Families | Single-Parent Households |
| No Children | 7 (0.9%) | 0 (0.0%) |
| 1 or 2 Children | 0 (0.0%) | 0 (0.0%) |
| 3 or 4 Children | 19 (100.0%) | 0 (0.0%) |
| 5 or more Children | 0 (0.0%) | 0 (0.0%) |
| Total | 26 (2.0%) | 0 (0.0%) |
Race in San Martin
The most populous races in San Martin are White / Caucasian (3,893 | 61.9%), Hispanic or Latino (2,557 | 40.7%), and Two or more Races (1,310 | 20.8%).
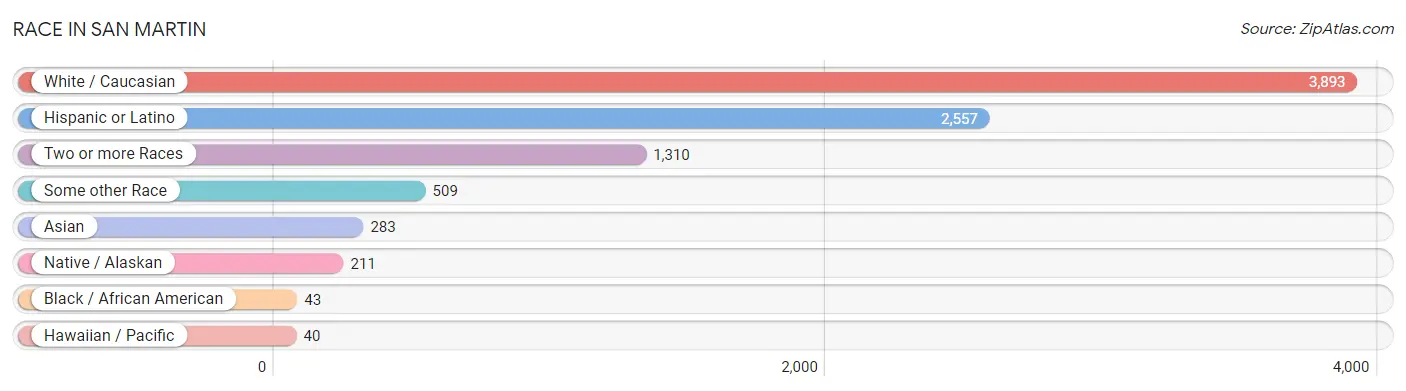
| Race | # Population | % Population |
| Asian | 283 | 4.5% |
| Black / African American | 43 | 0.7% |
| Hawaiian / Pacific | 40 | 0.6% |
| Hispanic or Latino | 2,557 | 40.7% |
| Native / Alaskan | 211 | 3.4% |
| White / Caucasian | 3,893 | 61.9% |
| Two or more Races | 1,310 | 20.8% |
| Some other Race | 509 | 8.1% |
| Total | 6,289 | 100.0% |
Ancestry in San Martin
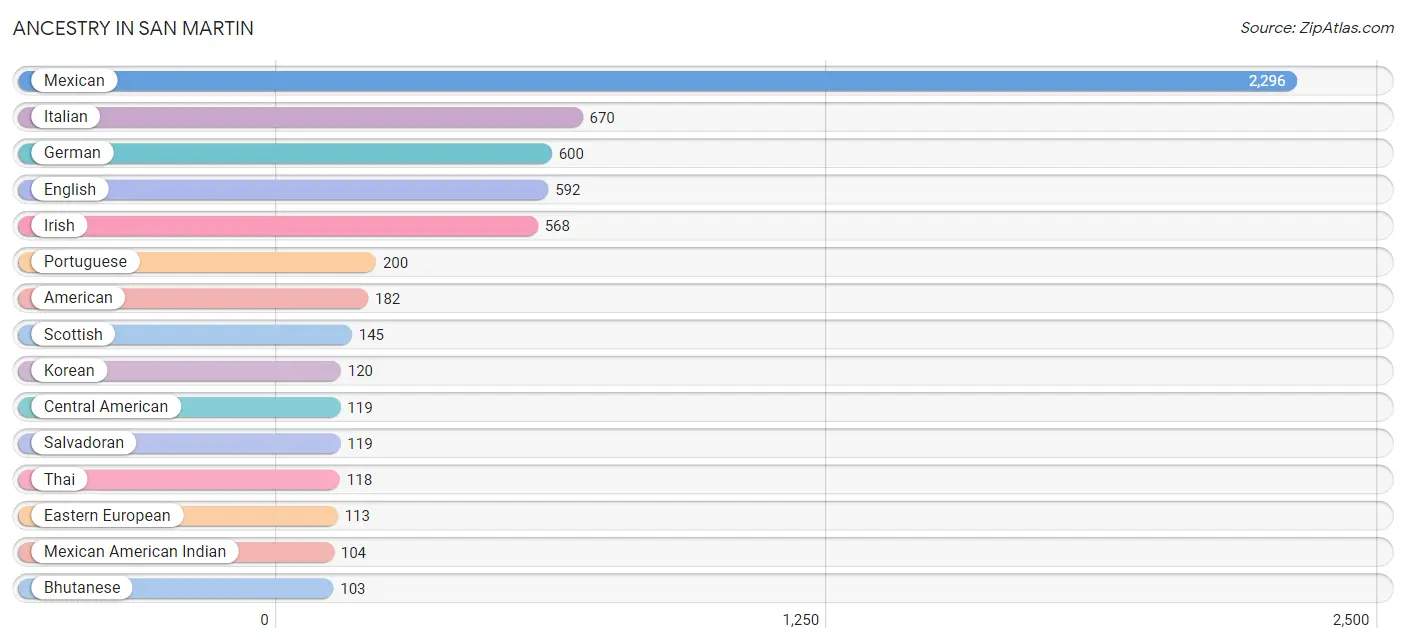
The most populous ancestries reported in San Martin are Mexican (2,296 | 36.5%), Italian (670 | 10.6%), German (600 | 9.5%), English (592 | 9.4%), and Irish (568 | 9.0%), together accounting for 75.1% of all San Martin residents.
| Ancestry | # Population | % Population |
| Alaskan Athabascan | 10 | 0.2% |
| American | 182 | 2.9% |
| Apache | 39 | 0.6% |
| Arab | 10 | 0.2% |
| Argentinean | 20 | 0.3% |
| Armenian | 19 | 0.3% |
| Austrian | 8 | 0.1% |
| Bhutanese | 103 | 1.6% |
| British | 71 | 1.1% |
| Central American | 119 | 1.9% |
| Central American Indian | 97 | 1.5% |
| Chilean | 35 | 0.6% |
| Choctaw | 11 | 0.2% |
| Cuban | 9 | 0.1% |
| Danish | 52 | 0.8% |
| Dutch | 83 | 1.3% |
| Eastern European | 113 | 1.8% |
| English | 592 | 9.4% |
| European | 103 | 1.6% |
| French | 102 | 1.6% |
| French Canadian | 61 | 1.0% |
| German | 600 | 9.5% |
| Indian (Asian) | 55 | 0.9% |
| Iranian | 10 | 0.2% |
| Irish | 568 | 9.0% |
| Italian | 670 | 10.6% |
| Korean | 120 | 1.9% |
| Lebanese | 10 | 0.2% |
| Macedonian | 47 | 0.7% |
| Mexican | 2,296 | 36.5% |
| Mexican American Indian | 104 | 1.7% |
| Native Hawaiian | 40 | 0.6% |
| Norwegian | 68 | 1.1% |
| Polish | 72 | 1.1% |
| Portuguese | 200 | 3.2% |
| Puerto Rican | 19 | 0.3% |
| Russian | 40 | 0.6% |
| Salvadoran | 119 | 1.9% |
| Scandinavian | 18 | 0.3% |
| Scotch-Irish | 39 | 0.6% |
| Scottish | 145 | 2.3% |
| South American | 55 | 0.9% |
| Spaniard | 58 | 0.9% |
| Sri Lankan | 17 | 0.3% |
| Swedish | 8 | 0.1% |
| Swiss | 37 | 0.6% |
| Thai | 118 | 1.9% |
| Ukrainian | 9 | 0.1% |
| Welsh | 45 | 0.7% |
| Yugoslavian | 23 | 0.4% | View All 50 Rows |
Immigrants in San Martin
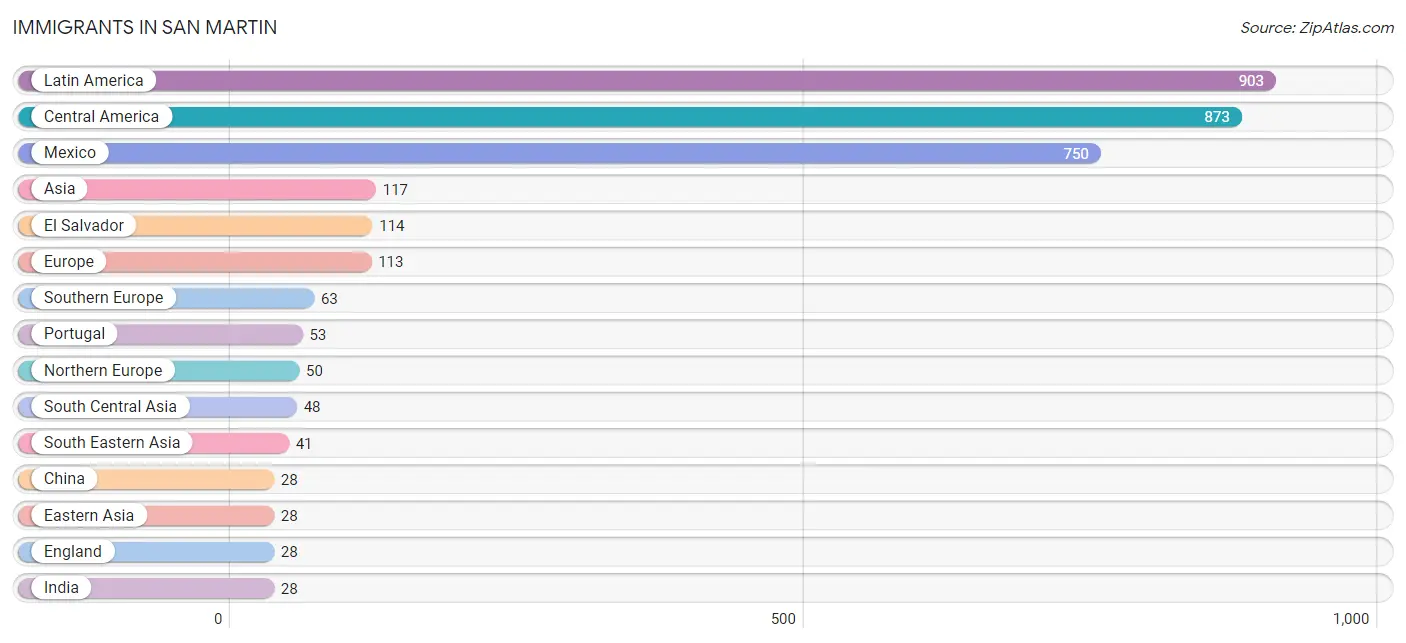
The most numerous immigrant groups reported in San Martin came from Latin America (903 | 14.4%), Central America (873 | 13.9%), Mexico (750 | 11.9%), Asia (117 | 1.9%), and El Salvador (114 | 1.8%), together accounting for 43.8% of all San Martin residents.
| Immigration Origin | # Population | % Population |
| Argentina | 10 | 0.2% |
| Asia | 117 | 1.9% |
| Caribbean | 9 | 0.1% |
| Central America | 873 | 13.9% |
| Chile | 11 | 0.2% |
| China | 28 | 0.4% |
| Cuba | 9 | 0.1% |
| Eastern Asia | 28 | 0.4% |
| El Salvador | 114 | 1.8% |
| England | 28 | 0.4% |
| Europe | 113 | 1.8% |
| Honduras | 9 | 0.1% |
| India | 28 | 0.4% |
| Iran | 20 | 0.3% |
| Italy | 10 | 0.2% |
| Latin America | 903 | 14.4% |
| Mexico | 750 | 11.9% |
| Northern Europe | 50 | 0.8% |
| Philippines | 9 | 0.1% |
| Portugal | 53 | 0.8% |
| Scotland | 22 | 0.4% |
| Singapore | 21 | 0.3% |
| South America | 21 | 0.3% |
| South Central Asia | 48 | 0.8% |
| South Eastern Asia | 41 | 0.6% |
| Southern Europe | 63 | 1.0% |
| Vietnam | 11 | 0.2% | View All 27 Rows |
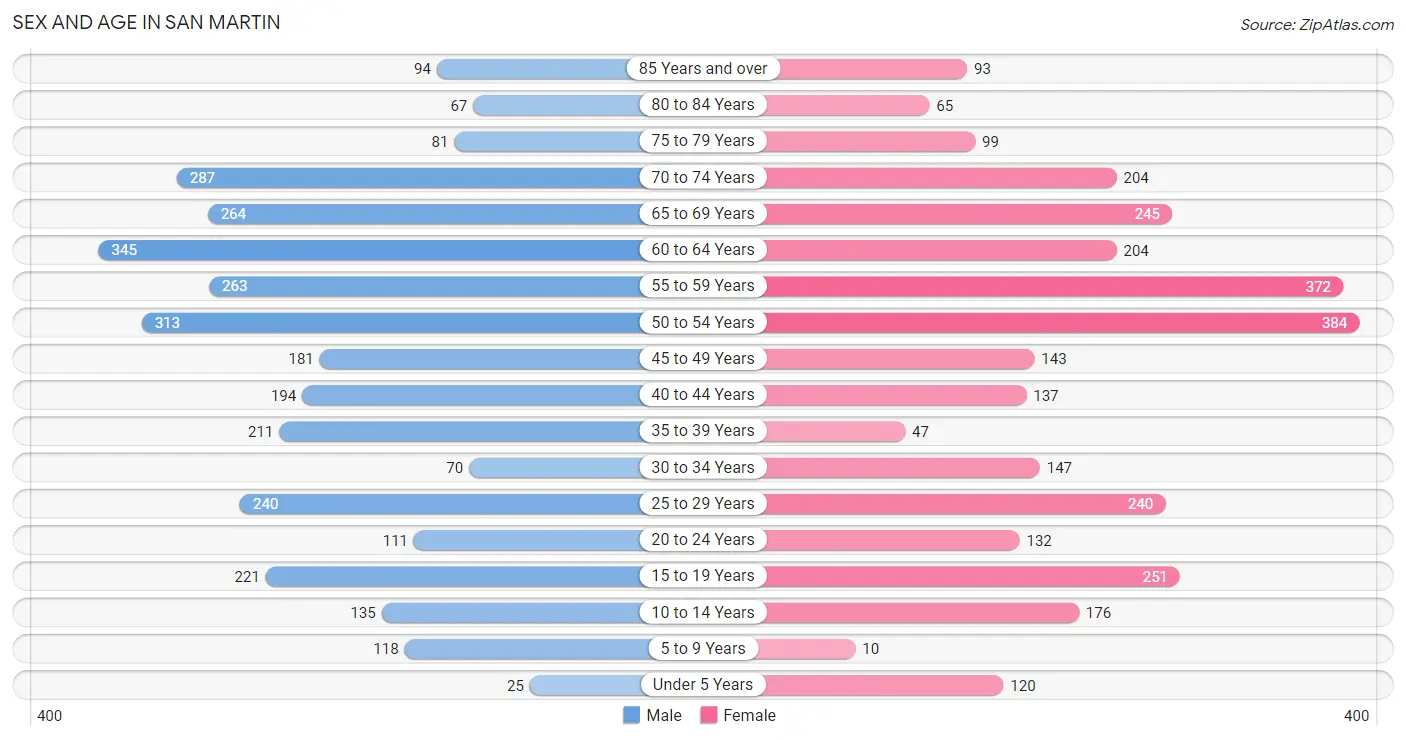
Sex and Age in San Martin
Sex and Age in San Martin
The most populous age groups in San Martin are 60 to 64 Years (345 | 10.7%) for men and 50 to 54 Years (384 | 12.5%) for women.
| Age Bracket | Male | Female |
| Under 5 Years | 25 (0.8%) | 120 (3.9%) |
| 5 to 9 Years | 118 (3.7%) | 10 (0.3%) |
| 10 to 14 Years | 135 (4.2%) | 176 (5.7%) |
| 15 to 19 Years | 221 (6.9%) | 251 (8.2%) |
| 20 to 24 Years | 111 (3.5%) | 132 (4.3%) |
| 25 to 29 Years | 240 (7.4%) | 240 (7.8%) |
| 30 to 34 Years | 70 (2.2%) | 147 (4.8%) |
| 35 to 39 Years | 211 (6.6%) | 47 (1.5%) |
| 40 to 44 Years | 194 (6.0%) | 137 (4.5%) |
| 45 to 49 Years | 181 (5.6%) | 143 (4.7%) |
| 50 to 54 Years | 313 (9.7%) | 384 (12.5%) |
| 55 to 59 Years | 263 (8.2%) | 372 (12.1%) |
| 60 to 64 Years | 345 (10.7%) | 204 (6.7%) |
| 65 to 69 Years | 264 (8.2%) | 245 (8.0%) |
| 70 to 74 Years | 287 (8.9%) | 204 (6.7%) |
| 75 to 79 Years | 81 (2.5%) | 99 (3.2%) |
| 80 to 84 Years | 67 (2.1%) | 65 (2.1%) |
| 85 Years and over | 94 (2.9%) | 93 (3.0%) |
| Total | 3,220 (100.0%) | 3,069 (100.0%) |
Families and Households in San Martin
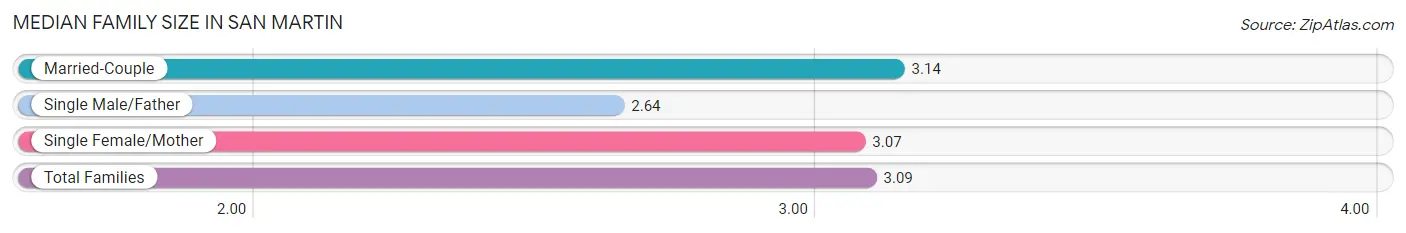
Median Family Size in San Martin
The median family size in San Martin is 3.09 persons per family, with married-couple families (1,293 | 77.2%) accounting for the largest median family size of 3.14 persons per family. On the other hand, single male/father families (128 | 7.6%) represent the smallest median family size with 2.64 persons per family.
| Family Type | # Families | Family Size |
| Married-Couple | 1,293 (77.2%) | 3.14 |
| Single Male/Father | 128 (7.6%) | 2.64 |
| Single Female/Mother | 254 (15.2%) | 3.07 |
| Total Families | 1,675 (100.0%) | 3.09 |
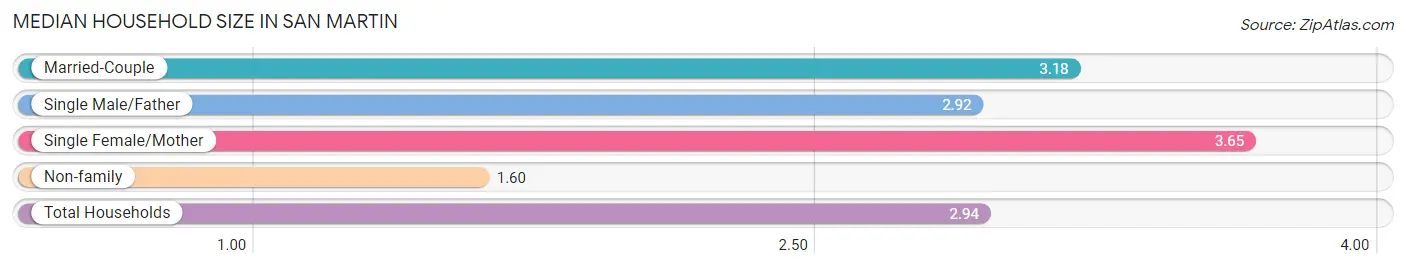
Median Household Size in San Martin
The median household size in San Martin is 2.94 persons per household, with single female/mother households (254 | 12.5%) accounting for the largest median household size of 3.65 persons per household. non-family households (361 | 17.7%) represent the smallest median household size with 1.60 persons per household.
| Household Type | # Households | Household Size |
| Married-Couple | 1,293 (63.5%) | 3.18 |
| Single Male/Father | 128 (6.3%) | 2.92 |
| Single Female/Mother | 254 (12.5%) | 3.65 |
| Non-family | 361 (17.7%) | 1.60 |
| Total Households | 2,036 (100.0%) | 2.94 |
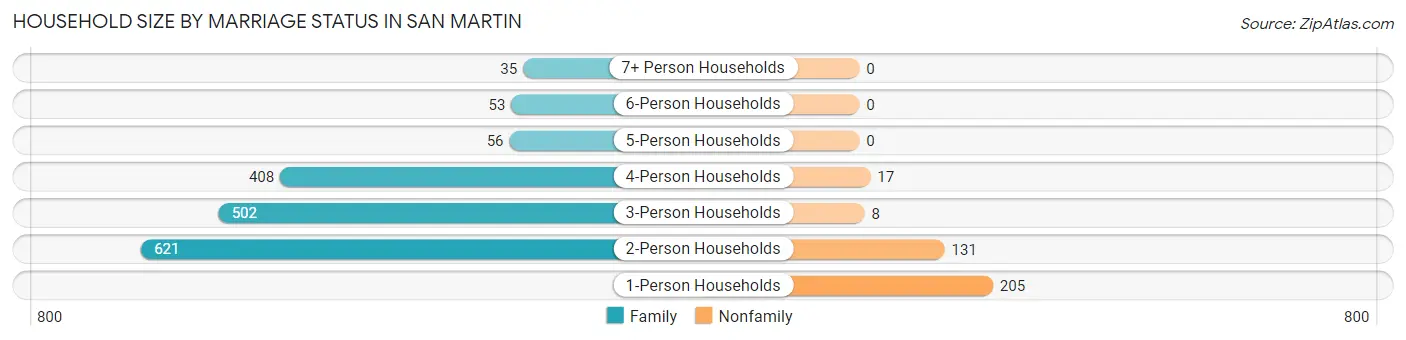
Household Size by Marriage Status in San Martin
Out of a total of 2,036 households in San Martin, 1,675 (82.3%) are family households, while 361 (17.7%) are nonfamily households. The most numerous type of family households are 2-person households, comprising 621, and the most common type of nonfamily households are 1-person households, comprising 205.
| Household Size | Family Households | Nonfamily Households |
| 1-Person Households | - | 205 (10.1%) |
| 2-Person Households | 621 (30.5%) | 131 (6.4%) |
| 3-Person Households | 502 (24.7%) | 8 (0.4%) |
| 4-Person Households | 408 (20.0%) | 17 (0.8%) |
| 5-Person Households | 56 (2.8%) | 0 (0.0%) |
| 6-Person Households | 53 (2.6%) | 0 (0.0%) |
| 7+ Person Households | 35 (1.7%) | 0 (0.0%) |
| Total | 1,675 (82.3%) | 361 (17.7%) |
Female Fertility in San Martin
Fertility by Age in San Martin
| Age Bracket | Women with Births | Births / 1,000 Women |
| 15 to 19 years | 0 (0.0%) | 0.0 |
| 20 to 34 years | 0 (0.0%) | 0.0 |
| 35 to 50 years | 0 (0.0%) | 0.0 |
| Total | 0 (0.0%) | 0.0 |
Fertility by Age by Marriage Status in San Martin
| Age Bracket | Married | Unmarried |
| 15 to 19 years | 0 (0.0%) | 0 (0.0%) |
| 20 to 34 years | 0 (0.0%) | 0 (0.0%) |
| 35 to 50 years | 0 (0.0%) | 0 (0.0%) |
| Total | 0 (0.0%) | 0 (0.0%) |
Fertility by Education in San Martin
| Educational Attainment | Women with Births | Births / 1,000 Women |
| Less than High School | 0 (0.0%) | 0.0 |
| High School Diploma | 0 (0.0%) | 0.0 |
| College or Associate's Degree | 0 (0.0%) | 0.0 |
| Bachelor's Degree | 0 (0.0%) | 0.0 |
| Graduate Degree | 0 (0.0%) | 0.0 |
| Total | 0 (0.0%) | 0.0 |
Fertility by Education by Marriage Status in San Martin
| Educational Attainment | Married | Unmarried |
| Less than High School | 0 (0.0%) | 0 (0.0%) |
| High School Diploma | 0 (0.0%) | 0 (0.0%) |
| College or Associate's Degree | 0 (0.0%) | 0 (0.0%) |
| Bachelor's Degree | 0 (0.0%) | 0 (0.0%) |
| Graduate Degree | 0 (0.0%) | 0 (0.0%) |
| Total | 0 (0.0%) | 0 (0.0%) |
Employment Characteristics in San Martin
Employment by Class of Employer in San Martin
Among the 3,173 employed individuals in San Martin, private company employees (1,991 | 62.7%), self-employed (not incorporated) (364 | 11.5%), and self-employed (incorporated) (317 | 10.0%) make up the most common classes of employment.
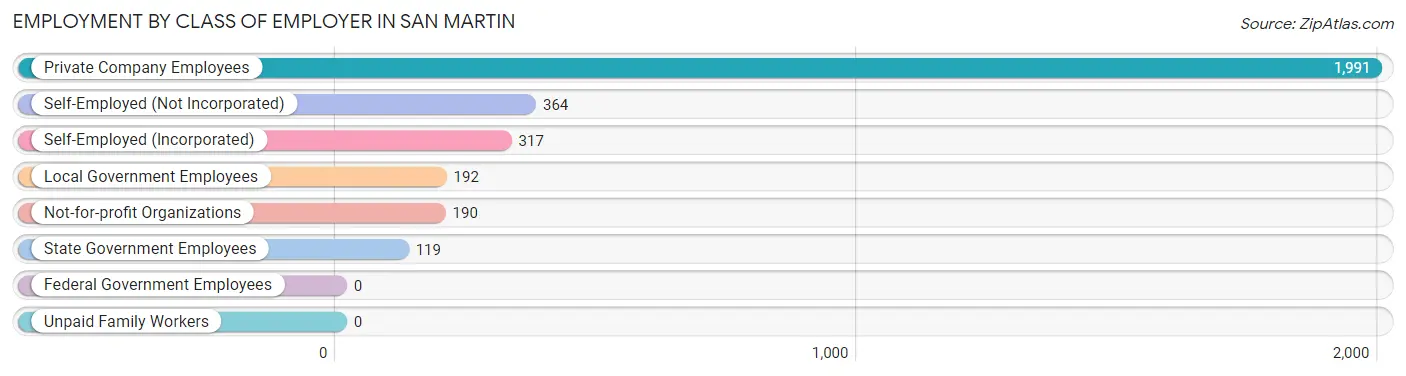
| Employer Class | # Employees | % Employees |
| Private Company Employees | 1,991 | 62.7% |
| Self-Employed (Incorporated) | 317 | 10.0% |
| Self-Employed (Not Incorporated) | 364 | 11.5% |
| Not-for-profit Organizations | 190 | 6.0% |
| Local Government Employees | 192 | 6.0% |
| State Government Employees | 119 | 3.7% |
| Federal Government Employees | 0 | 0.0% |
| Unpaid Family Workers | 0 | 0.0% |
| Total | 3,173 | 100.0% |
Employment Status by Age in San Martin
According to the labor force statistics for San Martin, out of the total population over 16 years of age (5,580), 61.2% or 3,415 individuals are in the labor force, with 5.9% or 201 of them unemployed. The age group with the highest labor force participation rate is 25 to 29 years, with 96.0% or 461 individuals in the labor force. Within the labor force, the 20 to 24 years age range has the highest percentage of unemployed individuals, with 34.2% or 55 of them being unemployed.
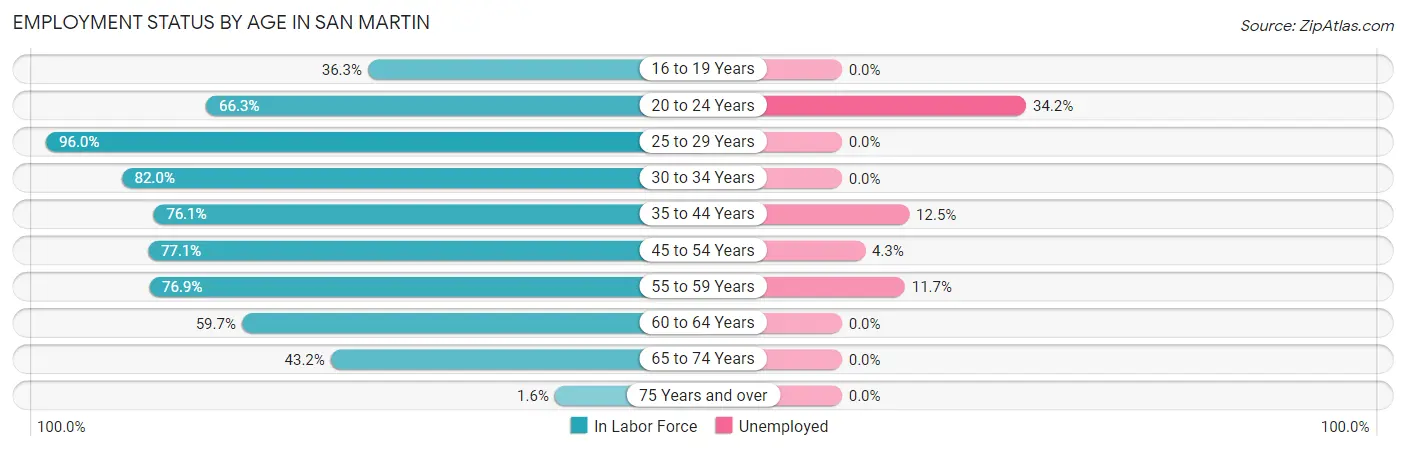
| Age Bracket | In Labor Force | Unemployed |
| 16 to 19 Years | 126 (36.3%) | 0 (0.0%) |
| 20 to 24 Years | 161 (66.3%) | 55 (34.2%) |
| 25 to 29 Years | 461 (96.0%) | 0 (0.0%) |
| 30 to 34 Years | 178 (82.0%) | 0 (0.0%) |
| 35 to 44 Years | 448 (76.1%) | 56 (12.5%) |
| 45 to 54 Years | 787 (77.1%) | 34 (4.3%) |
| 55 to 59 Years | 488 (76.9%) | 57 (11.7%) |
| 60 to 64 Years | 328 (59.7%) | 0 (0.0%) |
| 65 to 74 Years | 432 (43.2%) | 0 (0.0%) |
| 75 Years and over | 8 (1.6%) | 0 (0.0%) |
| Total | 3,415 (61.2%) | 201 (5.9%) |
Employment Status by Educational Attainment in San Martin
According to labor force statistics for San Martin, 77.1% of individuals (2,692) out of the total population between 25 and 64 years of age (3,491) are in the labor force, with 5.5% or 148 of them being unemployed. The group with the highest labor force participation rate are those with the educational attainment of bachelor's degree or higher, with 87.1% or 809 individuals in the labor force. Within the labor force, individuals with less than high school education have the highest percentage of unemployment, with 11.3% or 17 of them being unemployed.
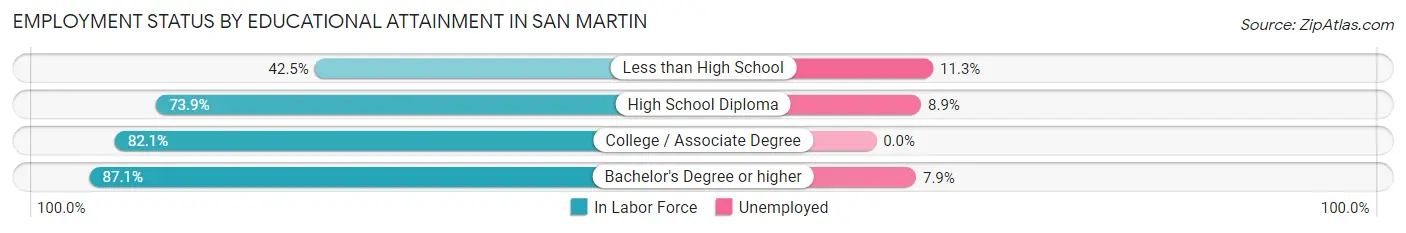
| Educational Attainment | In Labor Force | Unemployed |
| Less than High School | 150 (42.5%) | 40 (11.3%) |
| High School Diploma | 738 (73.9%) | 89 (8.9%) |
| College / Associate Degree | 993 (82.1%) | 0 (0.0%) |
| Bachelor's Degree or higher | 809 (87.1%) | 73 (7.9%) |
| Total | 2,692 (77.1%) | 192 (5.5%) |
Employment Occupations by Sex in San Martin
Management, Business, Science and Arts Occupations
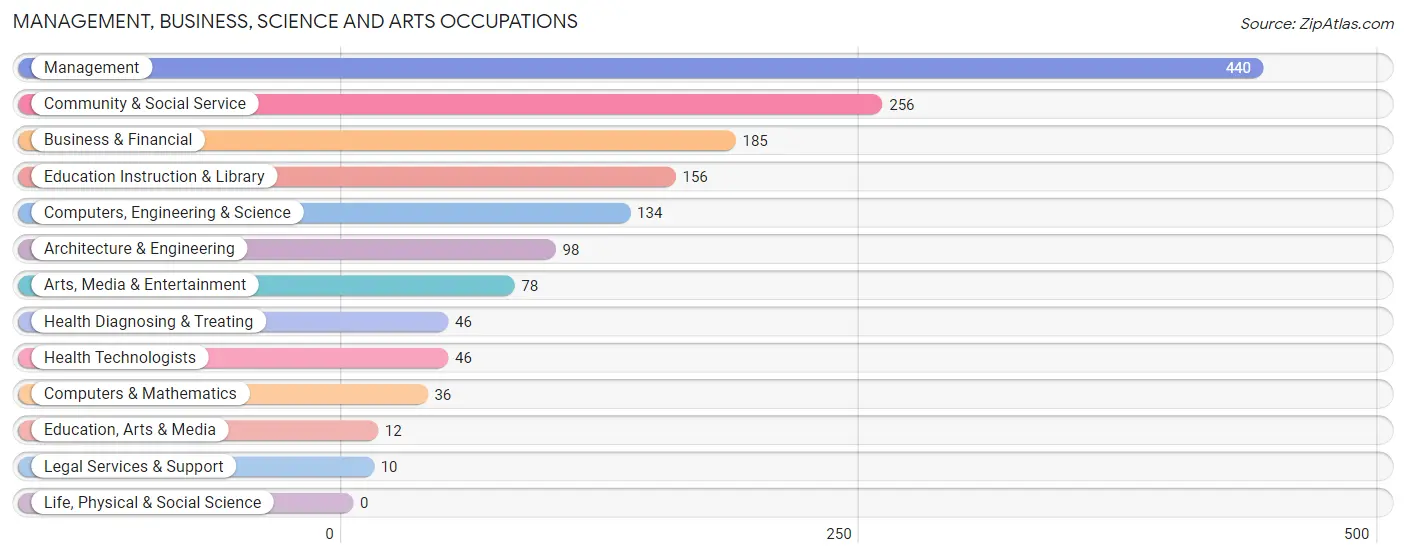
The most common Management, Business, Science and Arts occupations in San Martin are Management (440 | 13.7%), Community & Social Service (256 | 8.0%), Business & Financial (185 | 5.8%), Education Instruction & Library (156 | 4.9%), and Computers, Engineering & Science (134 | 4.2%).
Management, Business, Science and Arts Occupations by Sex
Within the Management, Business, Science and Arts occupations in San Martin, the most male-oriented occupations are Architecture & Engineering (100.0%), Computers, Engineering & Science (80.6%), and Education, Arts & Media (66.7%), while the most female-oriented occupations are Legal Services & Support (100.0%), Health Diagnosing & Treating (76.1%), and Health Technologists (76.1%).
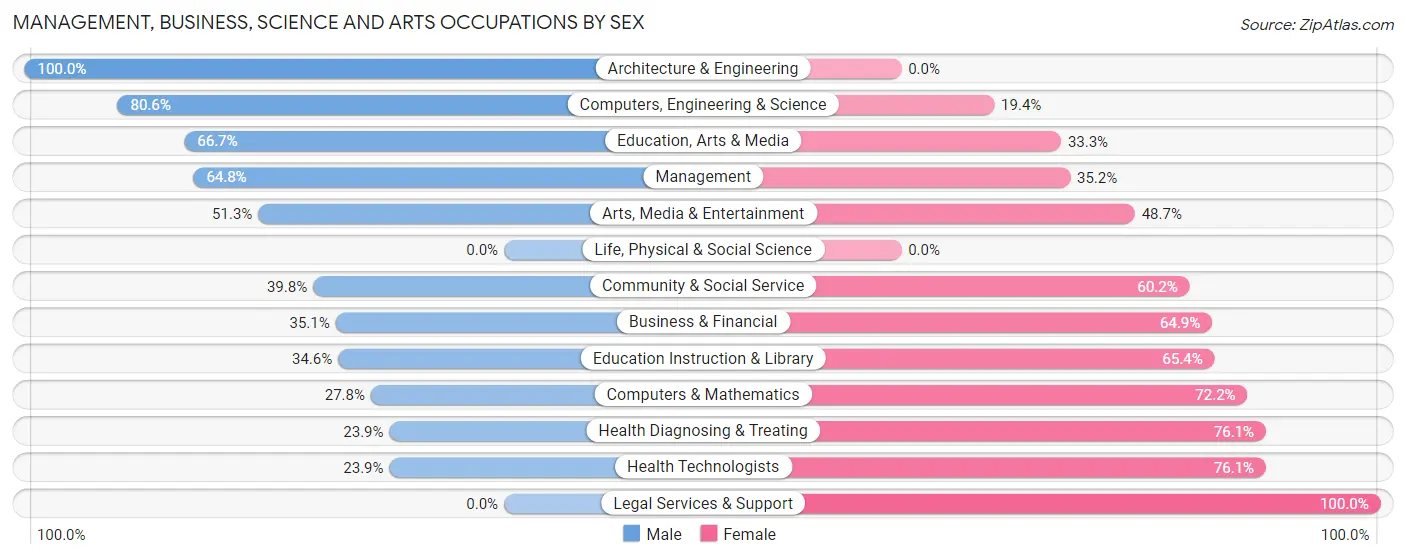
| Occupation | Male | Female |
| Management | 285 (64.8%) | 155 (35.2%) |
| Business & Financial | 65 (35.1%) | 120 (64.9%) |
| Computers, Engineering & Science | 108 (80.6%) | 26 (19.4%) |
| Computers & Mathematics | 10 (27.8%) | 26 (72.2%) |
| Architecture & Engineering | 98 (100.0%) | 0 (0.0%) |
| Life, Physical & Social Science | 0 (0.0%) | 0 (0.0%) |
| Community & Social Service | 102 (39.8%) | 154 (60.2%) |
| Education, Arts & Media | 8 (66.7%) | 4 (33.3%) |
| Legal Services & Support | 0 (0.0%) | 10 (100.0%) |
| Education Instruction & Library | 54 (34.6%) | 102 (65.4%) |
| Arts, Media & Entertainment | 40 (51.3%) | 38 (48.7%) |
| Health Diagnosing & Treating | 11 (23.9%) | 35 (76.1%) |
| Health Technologists | 11 (23.9%) | 35 (76.1%) |
| Total (Category) | 571 (53.8%) | 490 (46.2%) |
| Total (Overall) | 1,689 (52.5%) | 1,526 (47.5%) |
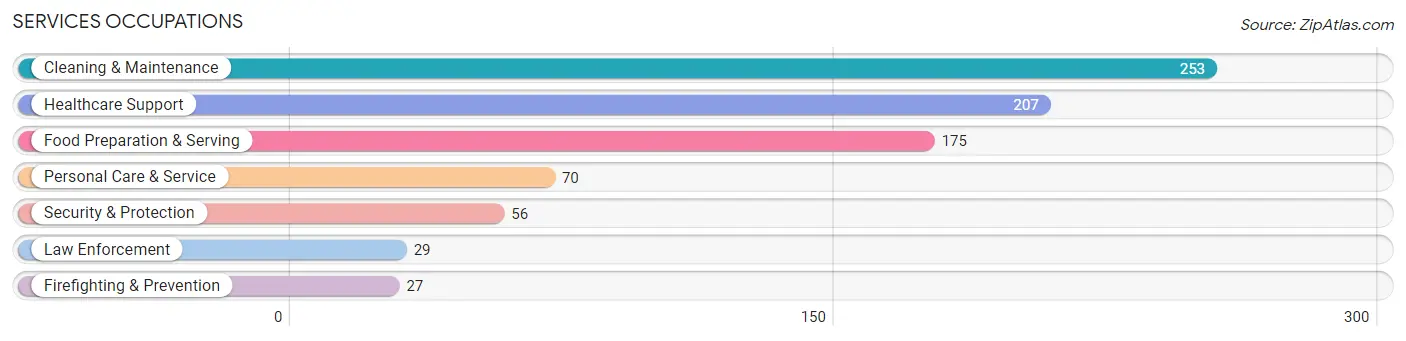
Services Occupations
The most common Services occupations in San Martin are Cleaning & Maintenance (253 | 7.9%), Healthcare Support (207 | 6.4%), Food Preparation & Serving (175 | 5.4%), Personal Care & Service (70 | 2.2%), and Security & Protection (56 | 1.7%).
Services Occupations by Sex
Within the Services occupations in San Martin, the most male-oriented occupations are Security & Protection (100.0%), Firefighting & Prevention (100.0%), and Law Enforcement (100.0%), while the most female-oriented occupations are Healthcare Support (100.0%), Personal Care & Service (100.0%), and Food Preparation & Serving (64.6%).
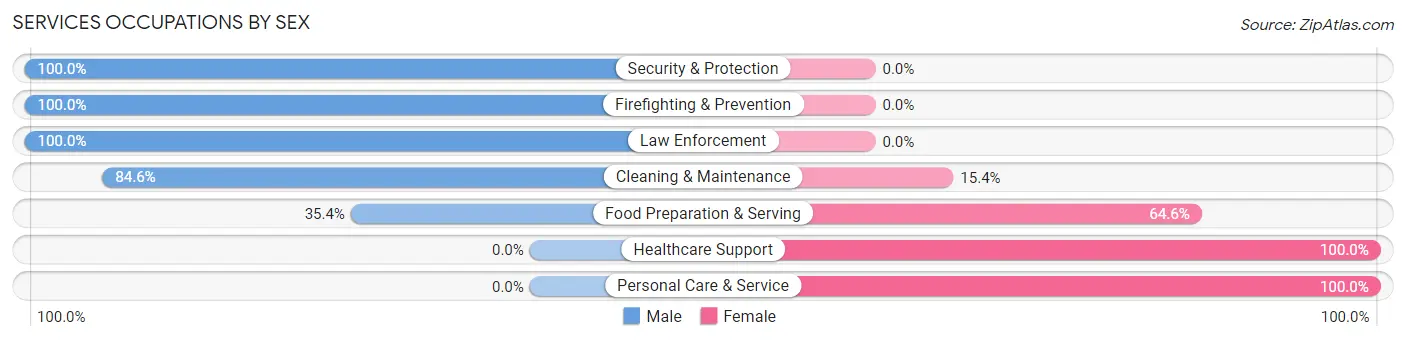
| Occupation | Male | Female |
| Healthcare Support | 0 (0.0%) | 207 (100.0%) |
| Security & Protection | 56 (100.0%) | 0 (0.0%) |
| Firefighting & Prevention | 27 (100.0%) | 0 (0.0%) |
| Law Enforcement | 29 (100.0%) | 0 (0.0%) |
| Food Preparation & Serving | 62 (35.4%) | 113 (64.6%) |
| Cleaning & Maintenance | 214 (84.6%) | 39 (15.4%) |
| Personal Care & Service | 0 (0.0%) | 70 (100.0%) |
| Total (Category) | 332 (43.6%) | 429 (56.4%) |
| Total (Overall) | 1,689 (52.5%) | 1,526 (47.5%) |
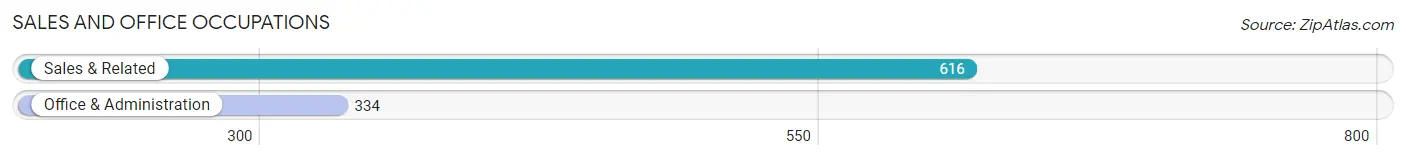
Sales and Office Occupations
The most common Sales and Office occupations in San Martin are Sales & Related (616 | 19.2%), and Office & Administration (334 | 10.4%).
Sales and Office Occupations by Sex
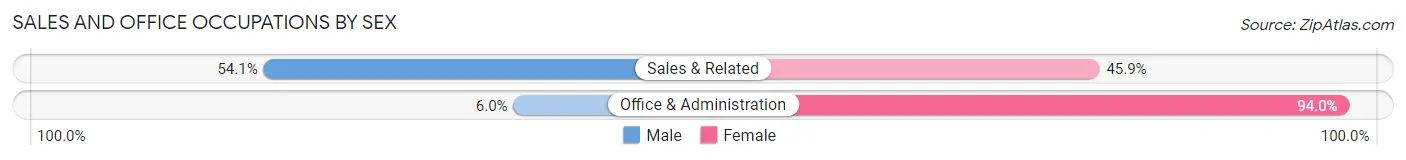
| Occupation | Male | Female |
| Sales & Related | 333 (54.1%) | 283 (45.9%) |
| Office & Administration | 20 (6.0%) | 314 (94.0%) |
| Total (Category) | 353 (37.2%) | 597 (62.8%) |
| Total (Overall) | 1,689 (52.5%) | 1,526 (47.5%) |
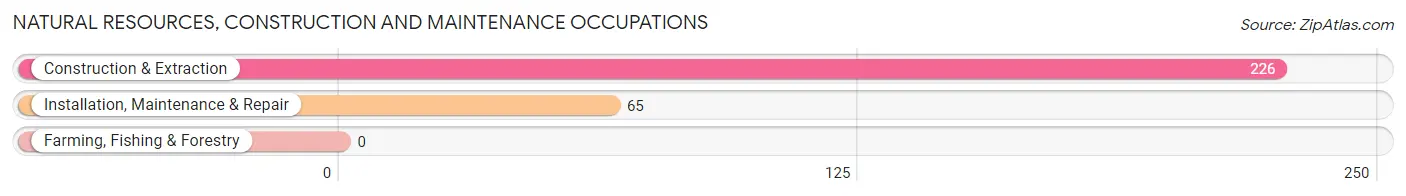
Natural Resources, Construction and Maintenance Occupations
The most common Natural Resources, Construction and Maintenance occupations in San Martin are Construction & Extraction (226 | 7.0%), and Installation, Maintenance & Repair (65 | 2.0%).
Natural Resources, Construction and Maintenance Occupations by Sex
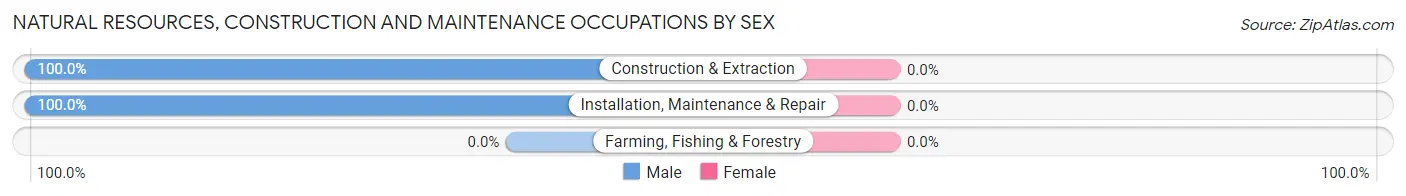
| Occupation | Male | Female |
| Farming, Fishing & Forestry | 0 (0.0%) | 0 (0.0%) |
| Construction & Extraction | 226 (100.0%) | 0 (0.0%) |
| Installation, Maintenance & Repair | 65 (100.0%) | 0 (0.0%) |
| Total (Category) | 291 (100.0%) | 0 (0.0%) |
| Total (Overall) | 1,689 (52.5%) | 1,526 (47.5%) |
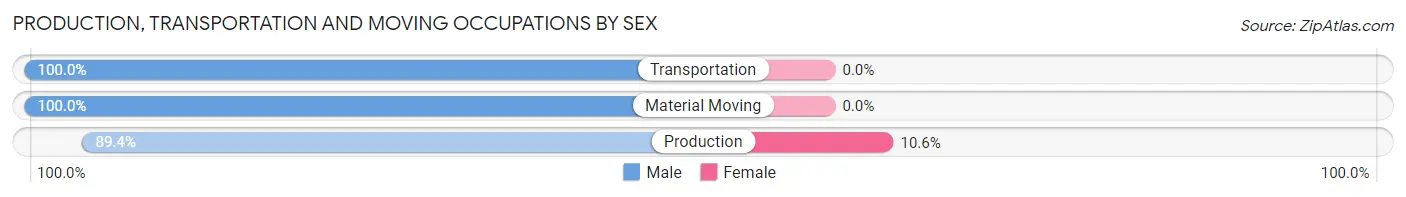
Production, Transportation and Moving Occupations
The most common Production, Transportation and Moving occupations in San Martin are Production (94 | 2.9%), Material Moving (38 | 1.2%), and Transportation (20 | 0.6%).
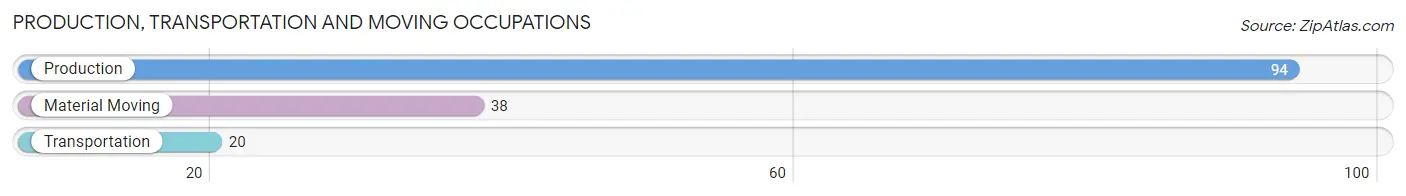
Production, Transportation and Moving Occupations by Sex
| Occupation | Male | Female |
| Production | 84 (89.4%) | 10 (10.6%) |
| Transportation | 20 (100.0%) | 0 (0.0%) |
| Material Moving | 38 (100.0%) | 0 (0.0%) |
| Total (Category) | 142 (93.4%) | 10 (6.6%) |
| Total (Overall) | 1,689 (52.5%) | 1,526 (47.5%) |
Employment Industries by Sex in San Martin
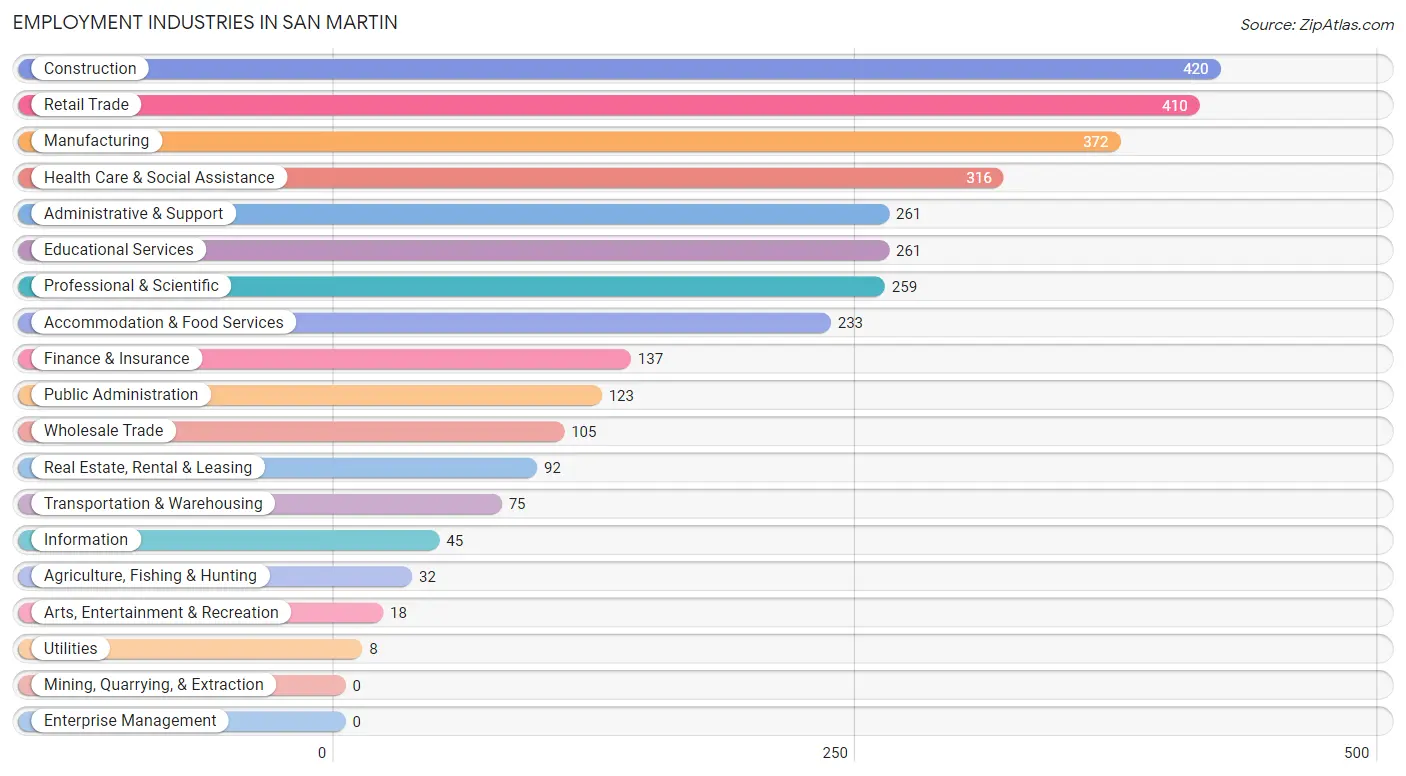
Employment Industries in San Martin
The major employment industries in San Martin include Construction (420 | 13.1%), Retail Trade (410 | 12.8%), Manufacturing (372 | 11.6%), Health Care & Social Assistance (316 | 9.8%), and Administrative & Support (261 | 8.1%).
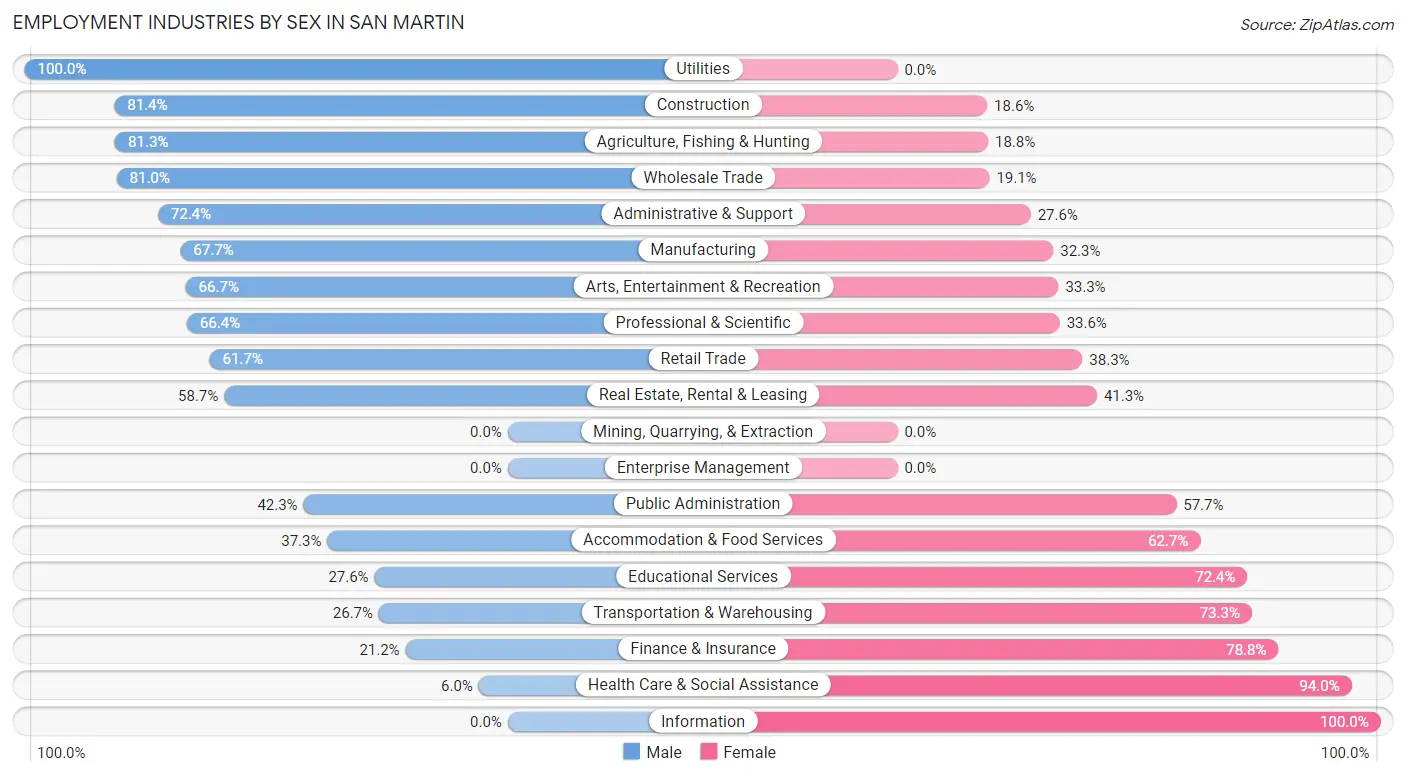
Employment Industries by Sex in San Martin
The San Martin industries that see more men than women are Utilities (100.0%), Construction (81.4%), and Agriculture, Fishing & Hunting (81.2%), whereas the industries that tend to have a higher number of women are Information (100.0%), Health Care & Social Assistance (94.0%), and Finance & Insurance (78.8%).
| Industry | Male | Female |
| Agriculture, Fishing & Hunting | 26 (81.2%) | 6 (18.8%) |
| Mining, Quarrying, & Extraction | 0 (0.0%) | 0 (0.0%) |
| Construction | 342 (81.4%) | 78 (18.6%) |
| Manufacturing | 252 (67.7%) | 120 (32.3%) |
| Wholesale Trade | 85 (80.9%) | 20 (19.1%) |
| Retail Trade | 253 (61.7%) | 157 (38.3%) |
| Transportation & Warehousing | 20 (26.7%) | 55 (73.3%) |
| Utilities | 8 (100.0%) | 0 (0.0%) |
| Information | 0 (0.0%) | 45 (100.0%) |
| Finance & Insurance | 29 (21.2%) | 108 (78.8%) |
| Real Estate, Rental & Leasing | 54 (58.7%) | 38 (41.3%) |
| Professional & Scientific | 172 (66.4%) | 87 (33.6%) |
| Enterprise Management | 0 (0.0%) | 0 (0.0%) |
| Administrative & Support | 189 (72.4%) | 72 (27.6%) |
| Educational Services | 72 (27.6%) | 189 (72.4%) |
| Health Care & Social Assistance | 19 (6.0%) | 297 (94.0%) |
| Arts, Entertainment & Recreation | 12 (66.7%) | 6 (33.3%) |
| Accommodation & Food Services | 87 (37.3%) | 146 (62.7%) |
| Public Administration | 52 (42.3%) | 71 (57.7%) |
| Total | 1,689 (52.5%) | 1,526 (47.5%) |
Education in San Martin
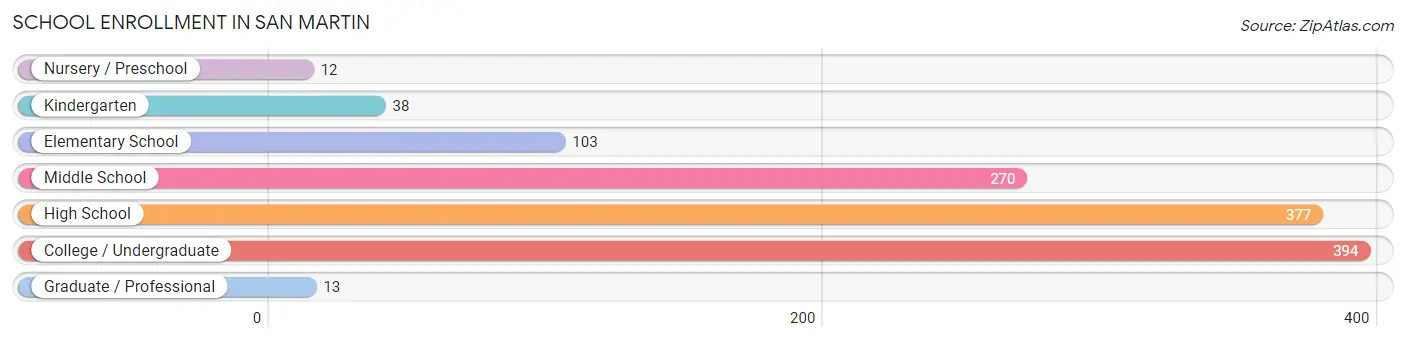
School Enrollment in San Martin
The most common levels of schooling among the 1,207 students in San Martin are college / undergraduate (394 | 32.6%), high school (377 | 31.2%), and middle school (270 | 22.4%).
| School Level | # Students | % Students |
| Nursery / Preschool | 12 | 1.0% |
| Kindergarten | 38 | 3.2% |
| Elementary School | 103 | 8.5% |
| Middle School | 270 | 22.4% |
| High School | 377 | 31.2% |
| College / Undergraduate | 394 | 32.6% |
| Graduate / Professional | 13 | 1.1% |
| Total | 1,207 | 100.0% |
School Enrollment by Age by Funding Source in San Martin
Out of a total of 1,207 students who are enrolled in schools in San Martin, 202 (16.7%) attend a private institution, while the remaining 1,005 (83.3%) are enrolled in public schools. The age group of 3 to 4 year olds has the highest likelihood of being enrolled in private schools, with 12 (100.0% in the age bracket) enrolled. Conversely, the age group of 25 to 34 year olds has the lowest likelihood of being enrolled in a private school, with 46 (100.0% in the age bracket) attending a public institution.
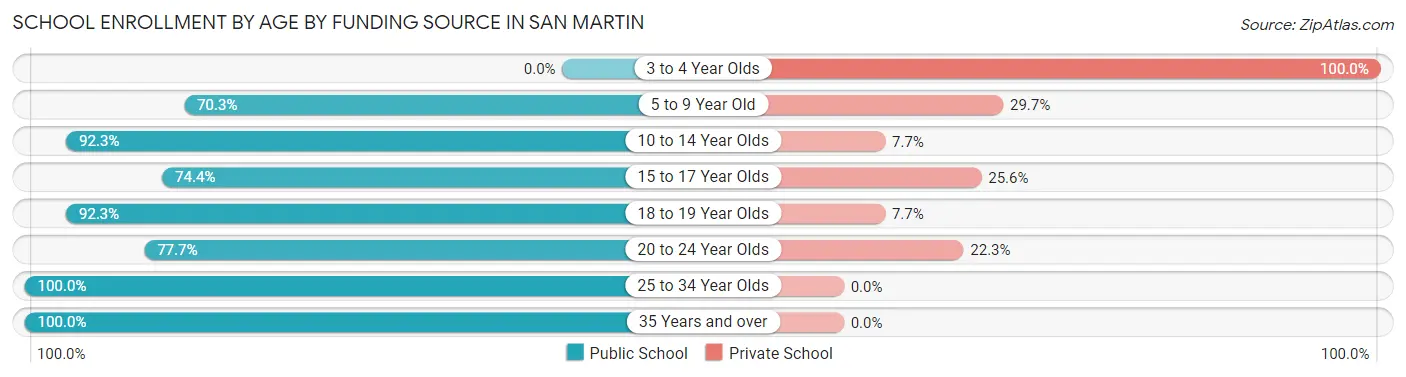
| Age Bracket | Public School | Private School |
| 3 to 4 Year Olds | 0 (0.0%) | 12 (100.0%) |
| 5 to 9 Year Old | 90 (70.3%) | 38 (29.7%) |
| 10 to 14 Year Olds | 287 (92.3%) | 24 (7.7%) |
| 15 to 17 Year Olds | 235 (74.4%) | 81 (25.6%) |
| 18 to 19 Year Olds | 144 (92.3%) | 12 (7.7%) |
| 20 to 24 Year Olds | 122 (77.7%) | 35 (22.3%) |
| 25 to 34 Year Olds | 46 (100.0%) | 0 (0.0%) |
| 35 Years and over | 81 (100.0%) | 0 (0.0%) |
| Total | 1,005 (83.3%) | 202 (16.7%) |
Educational Attainment by Field of Study in San Martin
Business (326 | 21.4%), engineering (227 | 14.9%), social sciences (164 | 10.8%), computers & mathematics (103 | 6.8%), and science & technology (102 | 6.7%) are the most common fields of study among 1,522 individuals in San Martin who have obtained a bachelor's degree or higher.
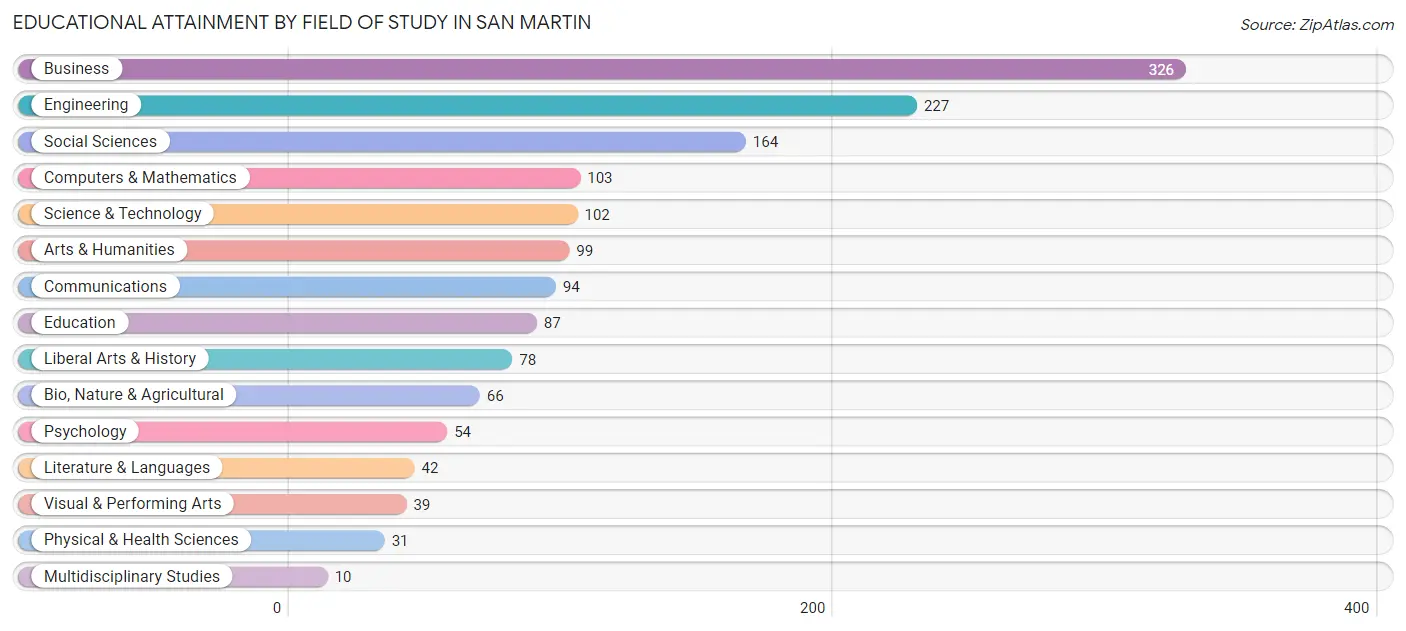
| Field of Study | # Graduates | % Graduates |
| Computers & Mathematics | 103 | 6.8% |
| Bio, Nature & Agricultural | 66 | 4.3% |
| Physical & Health Sciences | 31 | 2.0% |
| Psychology | 54 | 3.5% |
| Social Sciences | 164 | 10.8% |
| Engineering | 227 | 14.9% |
| Multidisciplinary Studies | 10 | 0.7% |
| Science & Technology | 102 | 6.7% |
| Business | 326 | 21.4% |
| Education | 87 | 5.7% |
| Literature & Languages | 42 | 2.8% |
| Liberal Arts & History | 78 | 5.1% |
| Visual & Performing Arts | 39 | 2.6% |
| Communications | 94 | 6.2% |
| Arts & Humanities | 99 | 6.5% |
| Total | 1,522 | 100.0% |
Transportation & Commute in San Martin
Vehicle Availability by Sex in San Martin
The most prevalent vehicle ownership categories in San Martin are males with 2 vehicles (443, accounting for 28.7%) and females with 2 vehicles (416, making up 30.1%).
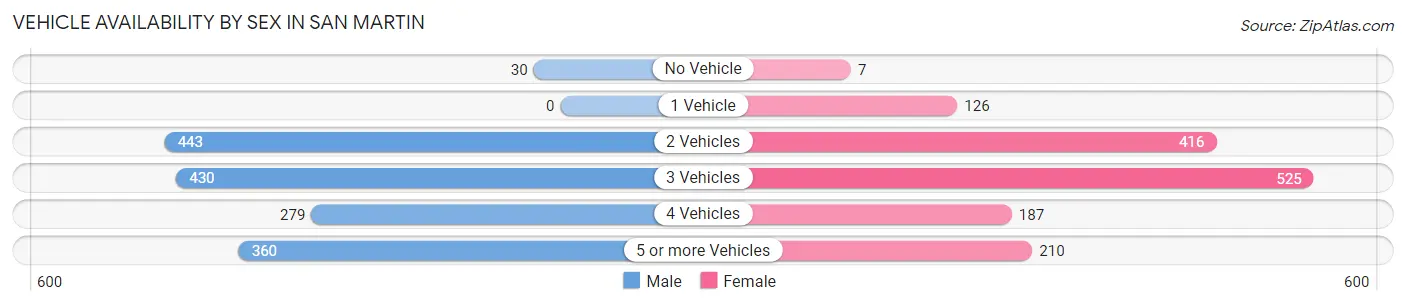
| Vehicles Available | Male | Female |
| No Vehicle | 30 (1.9%) | 7 (0.5%) |
| 1 Vehicle | 0 (0.0%) | 126 (8.6%) |
| 2 Vehicles | 443 (28.7%) | 416 (28.3%) |
| 3 Vehicles | 430 (27.9%) | 525 (35.7%) |
| 4 Vehicles | 279 (18.1%) | 187 (12.7%) |
| 5 or more Vehicles | 360 (23.4%) | 210 (14.3%) |
| Total | 1,542 (100.0%) | 1,471 (100.0%) |
Commute Time in San Martin
The most frequently occuring commute durations in San Martin are 60 to 89 minutes (491 commuters, 19.5%), 15 to 19 minutes (407 commuters, 16.2%), and 45 to 59 minutes (368 commuters, 14.6%).
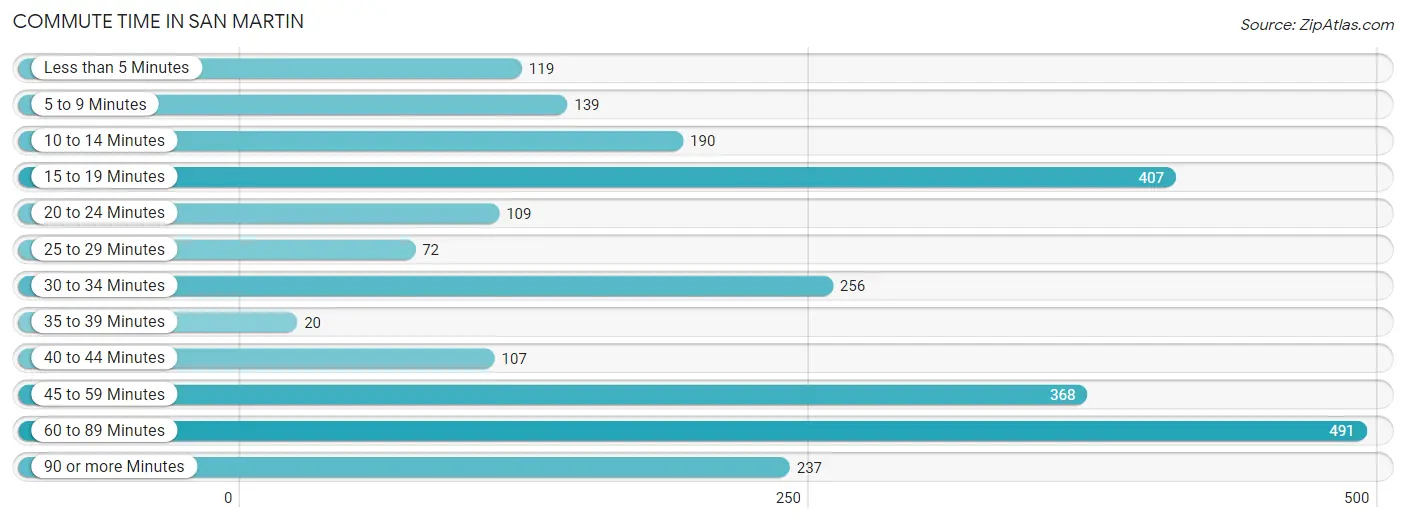
| Commute Time | # Commuters | % Commuters |
| Less than 5 Minutes | 119 | 4.7% |
| 5 to 9 Minutes | 139 | 5.5% |
| 10 to 14 Minutes | 190 | 7.5% |
| 15 to 19 Minutes | 407 | 16.2% |
| 20 to 24 Minutes | 109 | 4.3% |
| 25 to 29 Minutes | 72 | 2.9% |
| 30 to 34 Minutes | 256 | 10.2% |
| 35 to 39 Minutes | 20 | 0.8% |
| 40 to 44 Minutes | 107 | 4.3% |
| 45 to 59 Minutes | 368 | 14.6% |
| 60 to 89 Minutes | 491 | 19.5% |
| 90 or more Minutes | 237 | 9.4% |
Commute Time by Sex in San Martin
The most common commute times in San Martin are 60 to 89 minutes (339 commuters, 25.2%) for males and 15 to 19 minutes (324 commuters, 27.8%) for females.
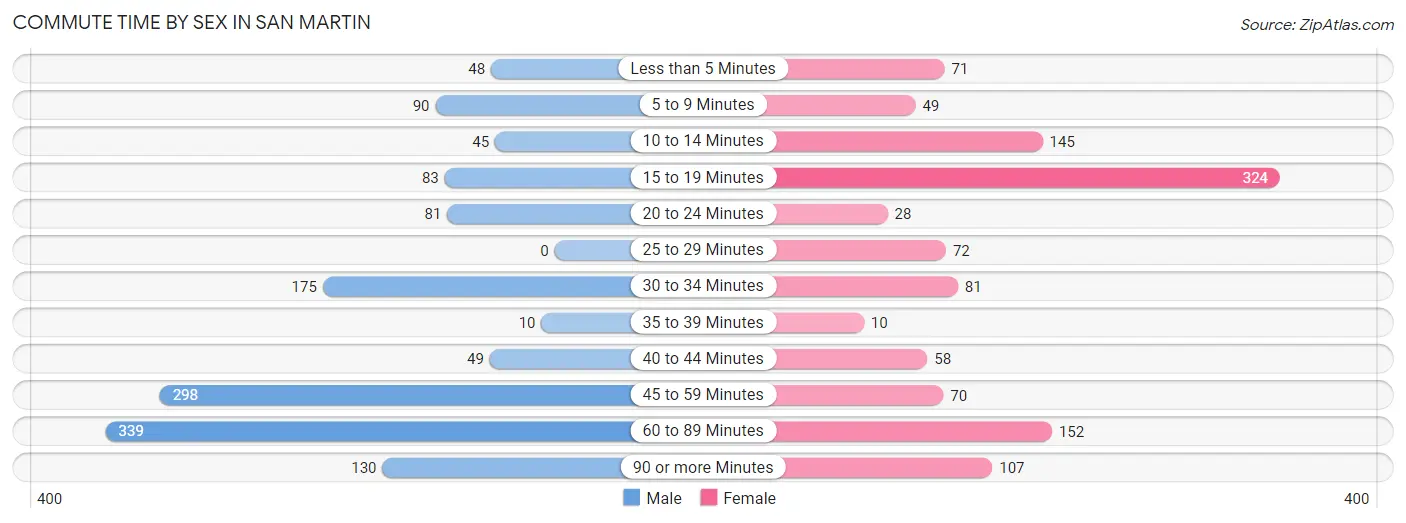
| Commute Time | Male | Female |
| Less than 5 Minutes | 48 (3.6%) | 71 (6.1%) |
| 5 to 9 Minutes | 90 (6.7%) | 49 (4.2%) |
| 10 to 14 Minutes | 45 (3.3%) | 145 (12.4%) |
| 15 to 19 Minutes | 83 (6.2%) | 324 (27.8%) |
| 20 to 24 Minutes | 81 (6.0%) | 28 (2.4%) |
| 25 to 29 Minutes | 0 (0.0%) | 72 (6.2%) |
| 30 to 34 Minutes | 175 (13.0%) | 81 (6.9%) |
| 35 to 39 Minutes | 10 (0.7%) | 10 (0.9%) |
| 40 to 44 Minutes | 49 (3.6%) | 58 (5.0%) |
| 45 to 59 Minutes | 298 (22.1%) | 70 (6.0%) |
| 60 to 89 Minutes | 339 (25.2%) | 152 (13.0%) |
| 90 or more Minutes | 130 (9.6%) | 107 (9.2%) |
Time of Departure to Work by Sex in San Martin
The most frequent times of departure to work in San Martin are 6:00 AM to 6:29 AM (212, 15.7%) for males and 10:00 AM to 10:59 AM (191, 16.4%) for females.
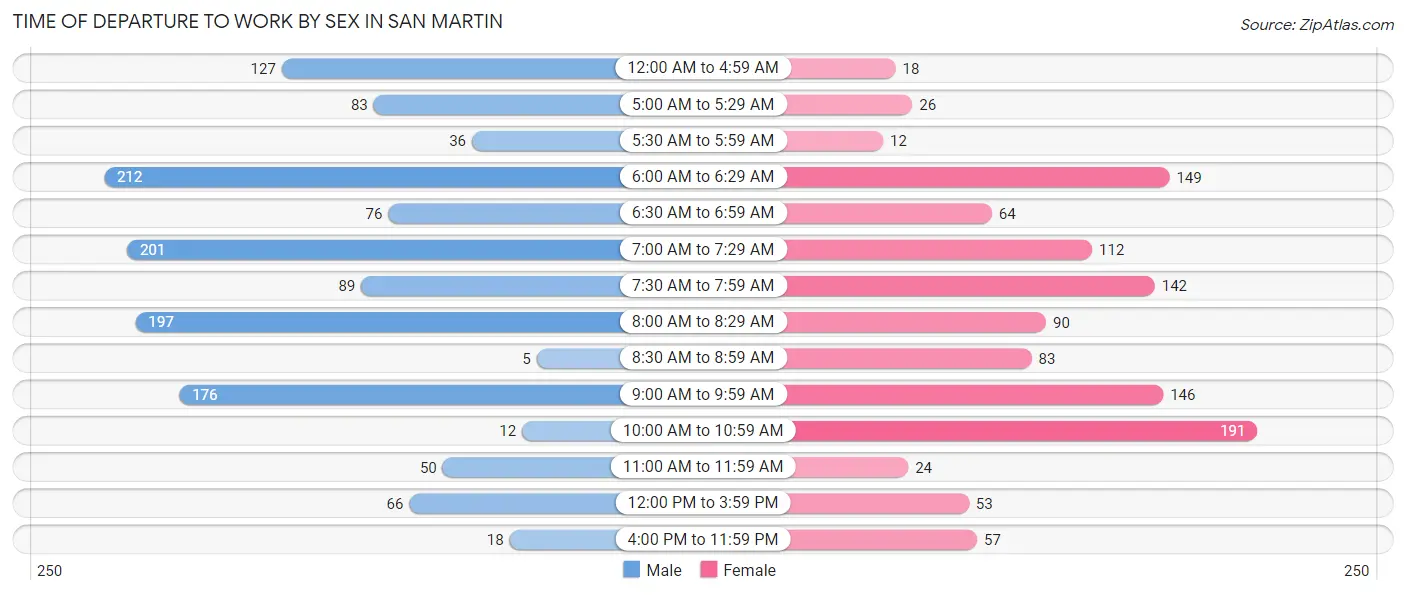
| Time of Departure | Male | Female |
| 12:00 AM to 4:59 AM | 127 (9.4%) | 18 (1.5%) |
| 5:00 AM to 5:29 AM | 83 (6.2%) | 26 (2.2%) |
| 5:30 AM to 5:59 AM | 36 (2.7%) | 12 (1.0%) |
| 6:00 AM to 6:29 AM | 212 (15.7%) | 149 (12.8%) |
| 6:30 AM to 6:59 AM | 76 (5.6%) | 64 (5.5%) |
| 7:00 AM to 7:29 AM | 201 (14.9%) | 112 (9.6%) |
| 7:30 AM to 7:59 AM | 89 (6.6%) | 142 (12.2%) |
| 8:00 AM to 8:29 AM | 197 (14.6%) | 90 (7.7%) |
| 8:30 AM to 8:59 AM | 5 (0.4%) | 83 (7.1%) |
| 9:00 AM to 9:59 AM | 176 (13.1%) | 146 (12.5%) |
| 10:00 AM to 10:59 AM | 12 (0.9%) | 191 (16.4%) |
| 11:00 AM to 11:59 AM | 50 (3.7%) | 24 (2.1%) |
| 12:00 PM to 3:59 PM | 66 (4.9%) | 53 (4.5%) |
| 4:00 PM to 11:59 PM | 18 (1.3%) | 57 (4.9%) |
| Total | 1,348 (100.0%) | 1,167 (100.0%) |
Housing Occupancy in San Martin
Occupancy by Ownership in San Martin
Of the total 2,036 dwellings in San Martin, owner-occupied units account for 1,485 (72.9%), while renter-occupied units make up 551 (27.1%).
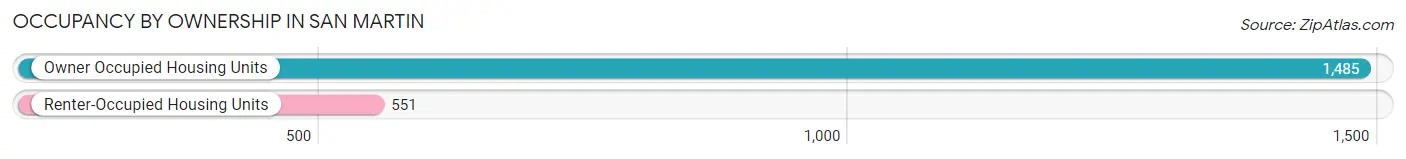
| Occupancy | # Housing Units | % Housing Units |
| Owner Occupied Housing Units | 1,485 | 72.9% |
| Renter-Occupied Housing Units | 551 | 27.1% |
| Total Occupied Housing Units | 2,036 | 100.0% |
Occupancy by Household Size in San Martin
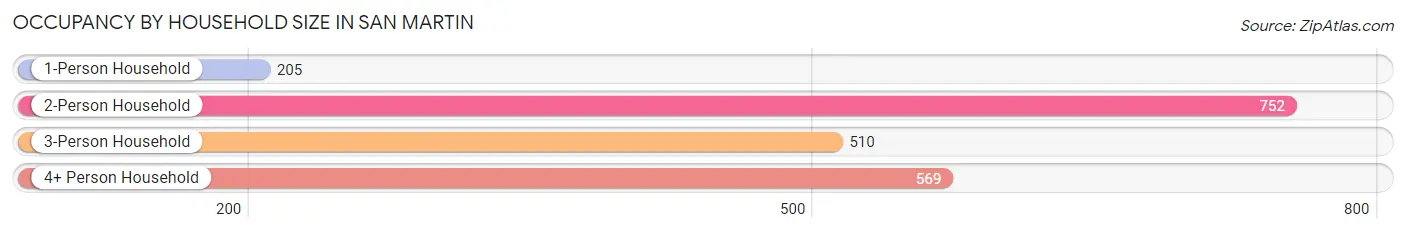
| Household Size | # Housing Units | % Housing Units |
| 1-Person Household | 205 | 10.1% |
| 2-Person Household | 752 | 36.9% |
| 3-Person Household | 510 | 25.1% |
| 4+ Person Household | 569 | 28.0% |
| Total Housing Units | 2,036 | 100.0% |
Occupancy by Ownership by Household Size in San Martin
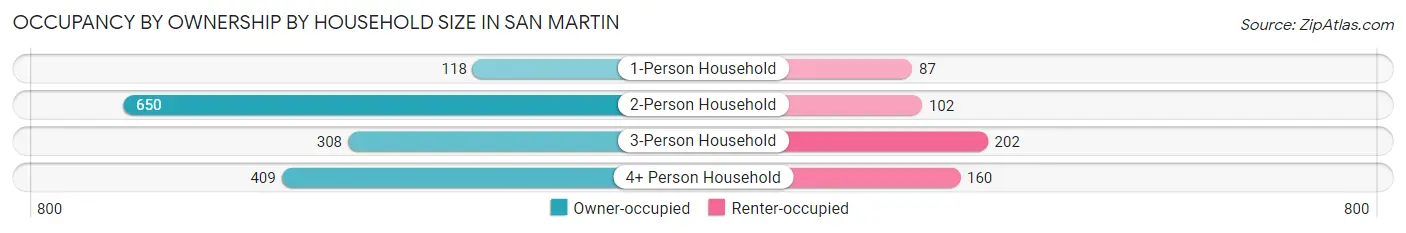
| Household Size | Owner-occupied | Renter-occupied |
| 1-Person Household | 118 (57.6%) | 87 (42.4%) |
| 2-Person Household | 650 (86.4%) | 102 (13.6%) |
| 3-Person Household | 308 (60.4%) | 202 (39.6%) |
| 4+ Person Household | 409 (71.9%) | 160 (28.1%) |
| Total Housing Units | 1,485 (72.9%) | 551 (27.1%) |
Occupancy by Educational Attainment in San Martin
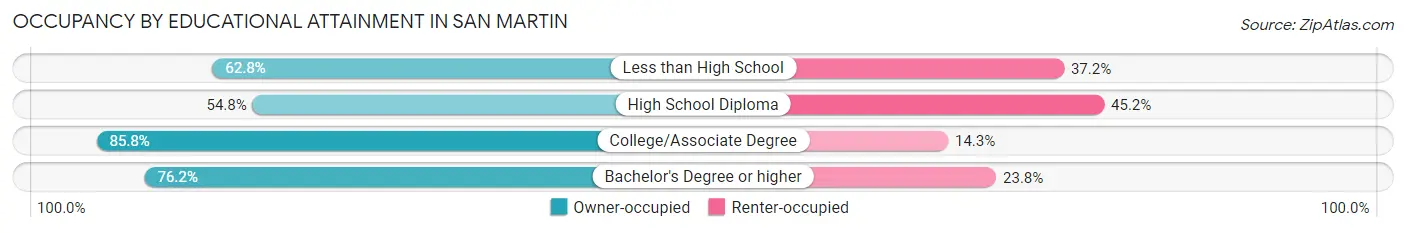
| Household Size | Owner-occupied | Renter-occupied |
| Less than High School | 91 (62.8%) | 54 (37.2%) |
| High School Diploma | 296 (54.8%) | 244 (45.2%) |
| College/Associate Degree | 614 (85.8%) | 102 (14.2%) |
| Bachelor's Degree or higher | 484 (76.2%) | 151 (23.8%) |
Occupancy by Age of Householder in San Martin
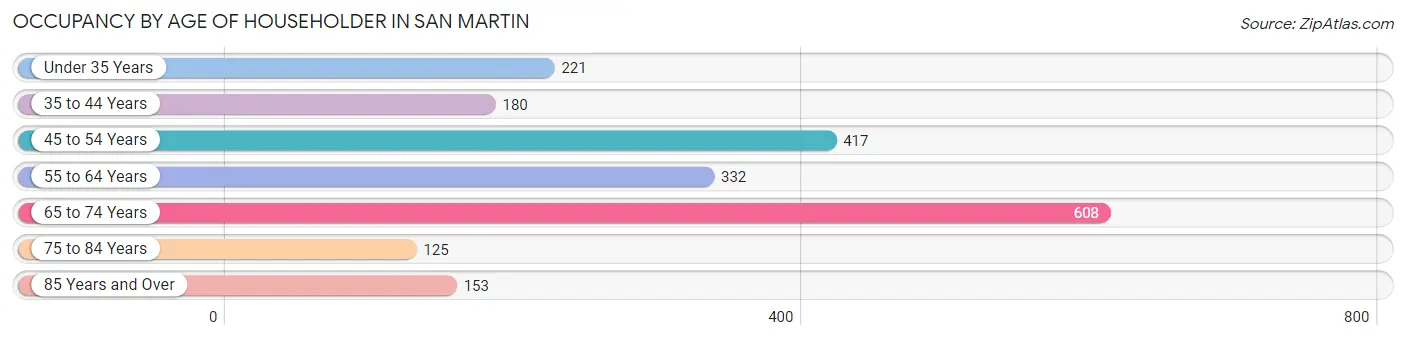
| Age Bracket | # Households | % Households |
| Under 35 Years | 221 | 10.8% |
| 35 to 44 Years | 180 | 8.8% |
| 45 to 54 Years | 417 | 20.5% |
| 55 to 64 Years | 332 | 16.3% |
| 65 to 74 Years | 608 | 29.9% |
| 75 to 84 Years | 125 | 6.1% |
| 85 Years and Over | 153 | 7.5% |
| Total | 2,036 | 100.0% |
Housing Finances in San Martin
Median Income by Occupancy in San Martin
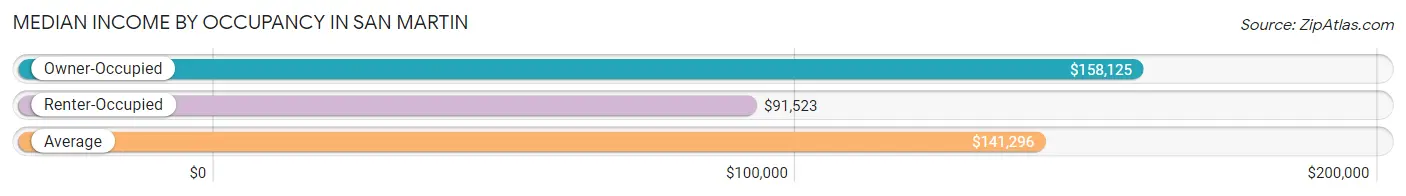
| Occupancy Type | # Households | Median Income |
| Owner-Occupied | 1,485 (72.9%) | $158,125 |
| Renter-Occupied | 551 (27.1%) | $91,523 |
| Average | 2,036 (100.0%) | $141,296 |
Occupancy by Householder Income Bracket in San Martin
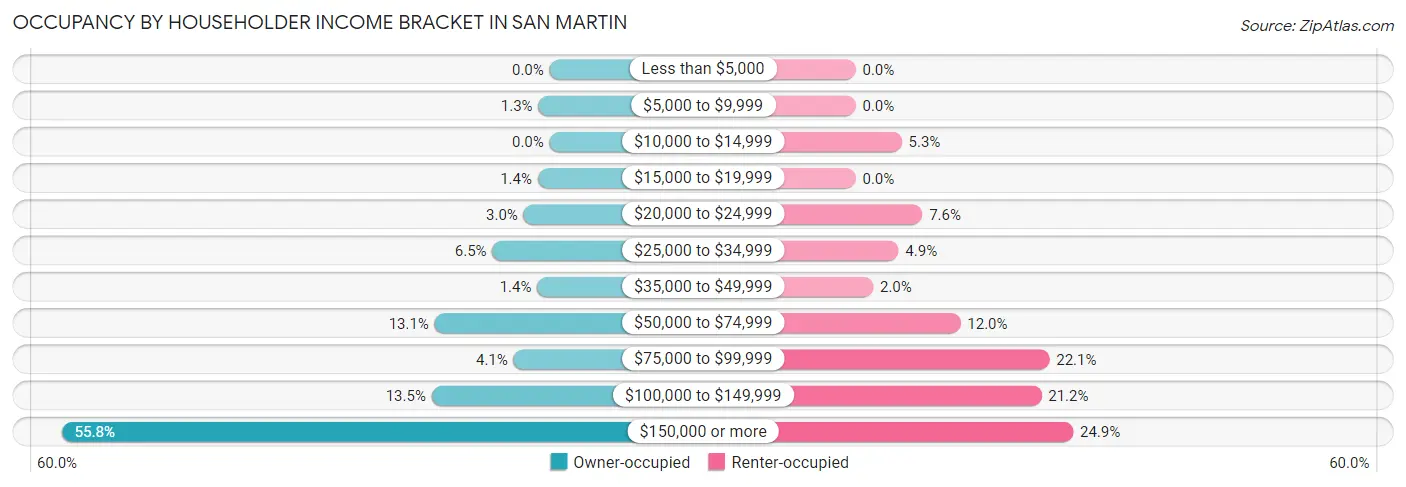
| Income Bracket | Owner-occupied | Renter-occupied |
| Less than $5,000 | 0 (0.0%) | 0 (0.0%) |
| $5,000 to $9,999 | 19 (1.3%) | 0 (0.0%) |
| $10,000 to $14,999 | 0 (0.0%) | 29 (5.3%) |
| $15,000 to $19,999 | 20 (1.3%) | 0 (0.0%) |
| $20,000 to $24,999 | 44 (3.0%) | 42 (7.6%) |
| $25,000 to $34,999 | 97 (6.5%) | 27 (4.9%) |
| $35,000 to $49,999 | 21 (1.4%) | 11 (2.0%) |
| $50,000 to $74,999 | 195 (13.1%) | 66 (12.0%) |
| $75,000 to $99,999 | 61 (4.1%) | 122 (22.1%) |
| $100,000 to $149,999 | 200 (13.5%) | 117 (21.2%) |
| $150,000 or more | 828 (55.8%) | 137 (24.9%) |
| Total | 1,485 (100.0%) | 551 (100.0%) |
Monthly Housing Cost Tiers in San Martin
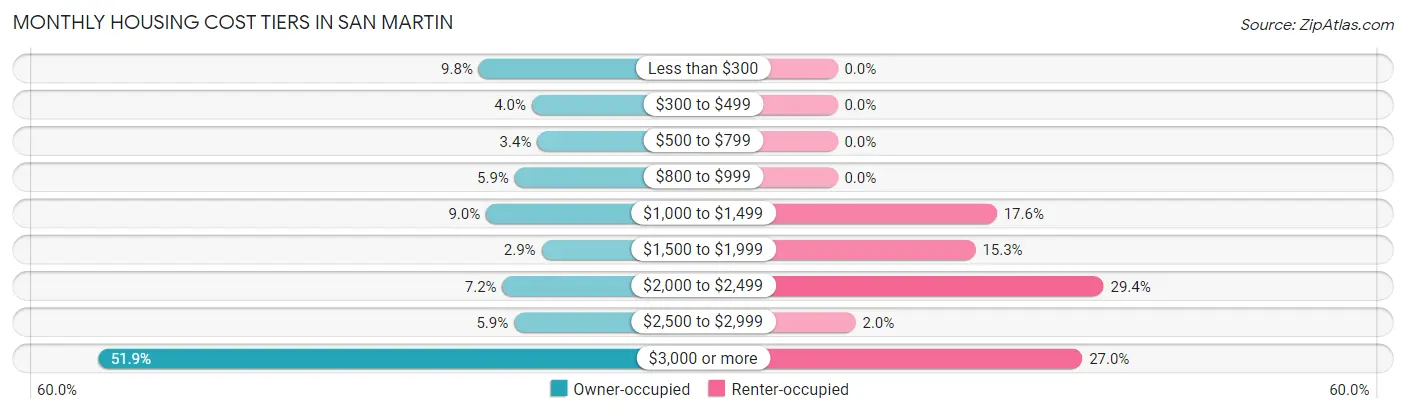
| Monthly Cost | Owner-occupied | Renter-occupied |
| Less than $300 | 146 (9.8%) | 0 (0.0%) |
| $300 to $499 | 59 (4.0%) | 0 (0.0%) |
| $500 to $799 | 50 (3.4%) | 0 (0.0%) |
| $800 to $999 | 87 (5.9%) | 0 (0.0%) |
| $1,000 to $1,499 | 134 (9.0%) | 97 (17.6%) |
| $1,500 to $1,999 | 43 (2.9%) | 84 (15.2%) |
| $2,000 to $2,499 | 107 (7.2%) | 162 (29.4%) |
| $2,500 to $2,999 | 88 (5.9%) | 11 (2.0%) |
| $3,000 or more | 771 (51.9%) | 149 (27.0%) |
| Total | 1,485 (100.0%) | 551 (100.0%) |
Physical Housing Characteristics in San Martin
Housing Structures in San Martin
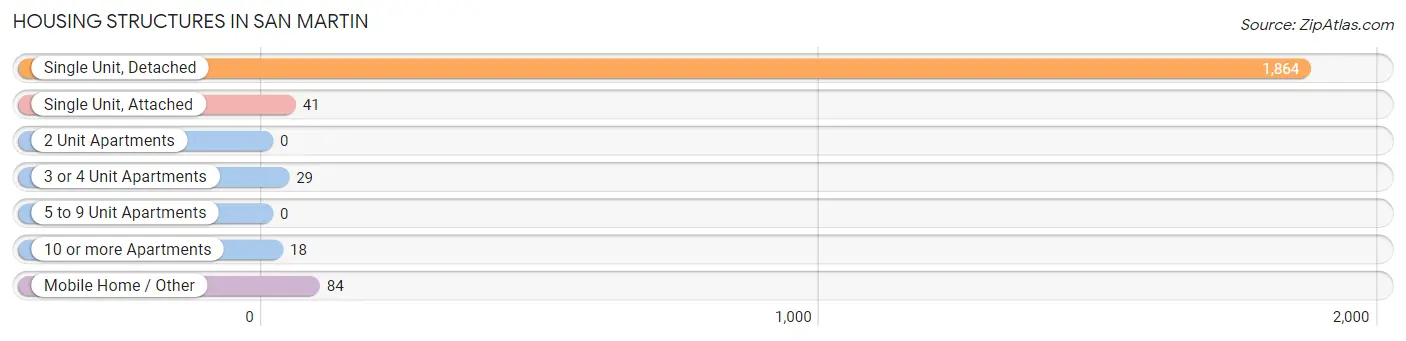
| Structure Type | # Housing Units | % Housing Units |
| Single Unit, Detached | 1,864 | 91.5% |
| Single Unit, Attached | 41 | 2.0% |
| 2 Unit Apartments | 0 | 0.0% |
| 3 or 4 Unit Apartments | 29 | 1.4% |
| 5 to 9 Unit Apartments | 0 | 0.0% |
| 10 or more Apartments | 18 | 0.9% |
| Mobile Home / Other | 84 | 4.1% |
| Total | 2,036 | 100.0% |
Housing Structures by Occupancy in San Martin
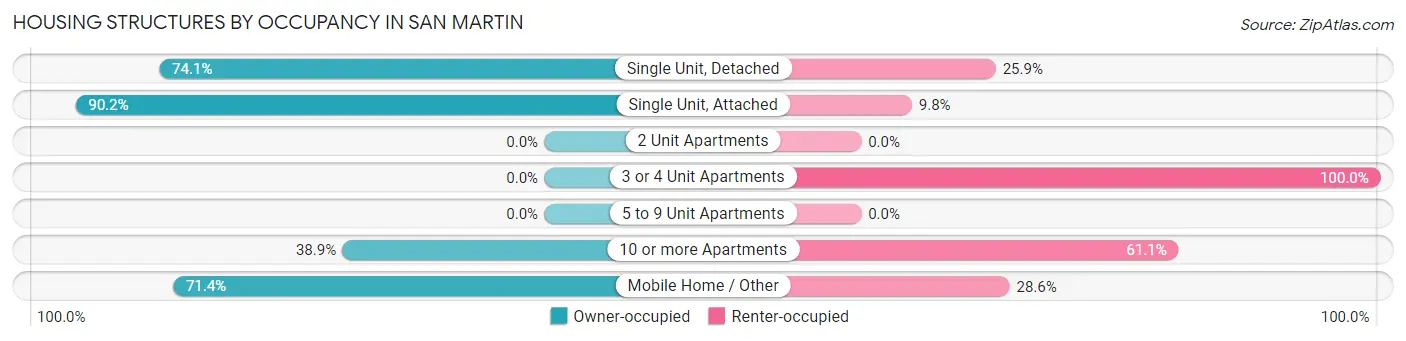
| Structure Type | Owner-occupied | Renter-occupied |
| Single Unit, Detached | 1,381 (74.1%) | 483 (25.9%) |
| Single Unit, Attached | 37 (90.2%) | 4 (9.8%) |
| 2 Unit Apartments | 0 (0.0%) | 0 (0.0%) |
| 3 or 4 Unit Apartments | 0 (0.0%) | 29 (100.0%) |
| 5 to 9 Unit Apartments | 0 (0.0%) | 0 (0.0%) |
| 10 or more Apartments | 7 (38.9%) | 11 (61.1%) |
| Mobile Home / Other | 60 (71.4%) | 24 (28.6%) |
| Total | 1,485 (72.9%) | 551 (27.1%) |
Housing Structures by Number of Rooms in San Martin
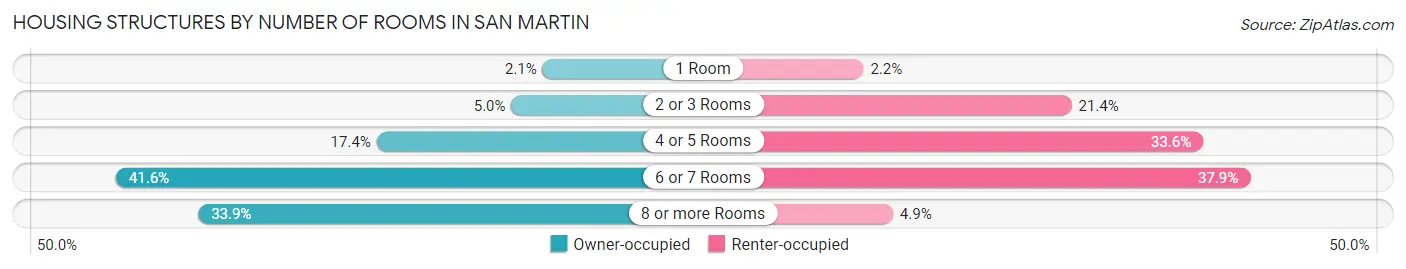
| Number of Rooms | Owner-occupied | Renter-occupied |
| 1 Room | 31 (2.1%) | 12 (2.2%) |
| 2 or 3 Rooms | 74 (5.0%) | 118 (21.4%) |
| 4 or 5 Rooms | 259 (17.4%) | 185 (33.6%) |
| 6 or 7 Rooms | 617 (41.5%) | 209 (37.9%) |
| 8 or more Rooms | 504 (33.9%) | 27 (4.9%) |
| Total | 1,485 (100.0%) | 551 (100.0%) |
Housing Structure by Heating Type in San Martin
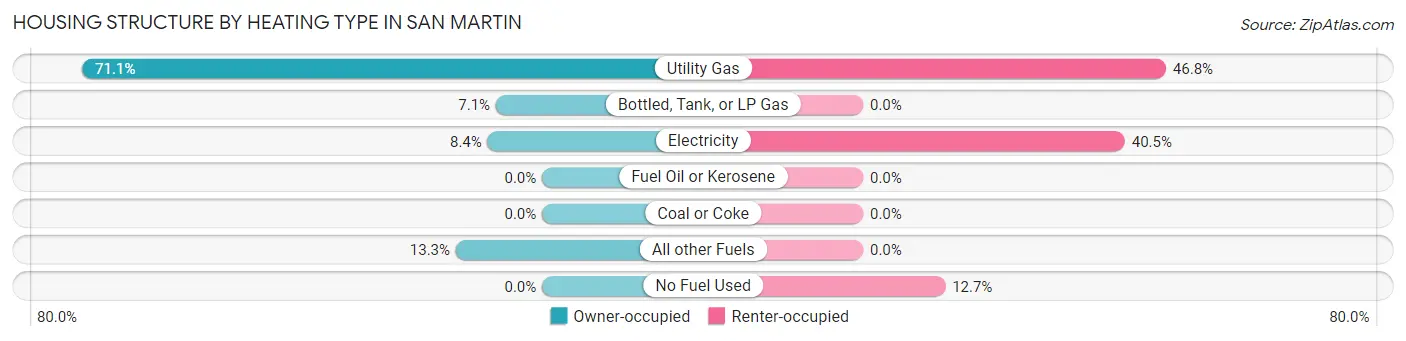
| Heating Type | Owner-occupied | Renter-occupied |
| Utility Gas | 1,056 (71.1%) | 258 (46.8%) |
| Bottled, Tank, or LP Gas | 106 (7.1%) | 0 (0.0%) |
| Electricity | 125 (8.4%) | 223 (40.5%) |
| Fuel Oil or Kerosene | 0 (0.0%) | 0 (0.0%) |
| Coal or Coke | 0 (0.0%) | 0 (0.0%) |
| All other Fuels | 198 (13.3%) | 0 (0.0%) |
| No Fuel Used | 0 (0.0%) | 70 (12.7%) |
| Total | 1,485 (100.0%) | 551 (100.0%) |
Household Vehicle Usage in San Martin
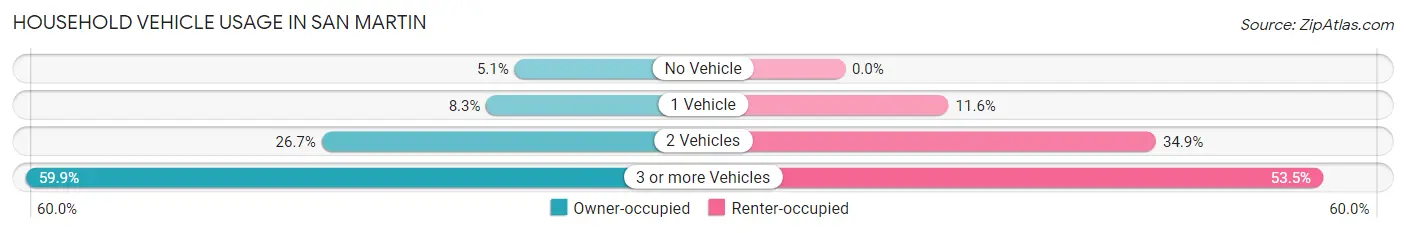
| Vehicles per Household | Owner-occupied | Renter-occupied |
| No Vehicle | 76 (5.1%) | 0 (0.0%) |
| 1 Vehicle | 123 (8.3%) | 64 (11.6%) |
| 2 Vehicles | 397 (26.7%) | 192 (34.8%) |
| 3 or more Vehicles | 889 (59.9%) | 295 (53.5%) |
| Total | 1,485 (100.0%) | 551 (100.0%) |
Real Estate & Mortgages in San Martin
Real Estate and Mortgage Overview in San Martin
| Characteristic | Without Mortgage | With Mortgage |
| Housing Units | 522 | 963 |
| Median Property Value | $1,225,200 | $1,280,500 |
| Median Household Income | $105,096 | $653 |
| Monthly Housing Costs | $815 | $751 |
| Real Estate Taxes | $4,561 | $0 |
Property Value by Mortgage Status in San Martin
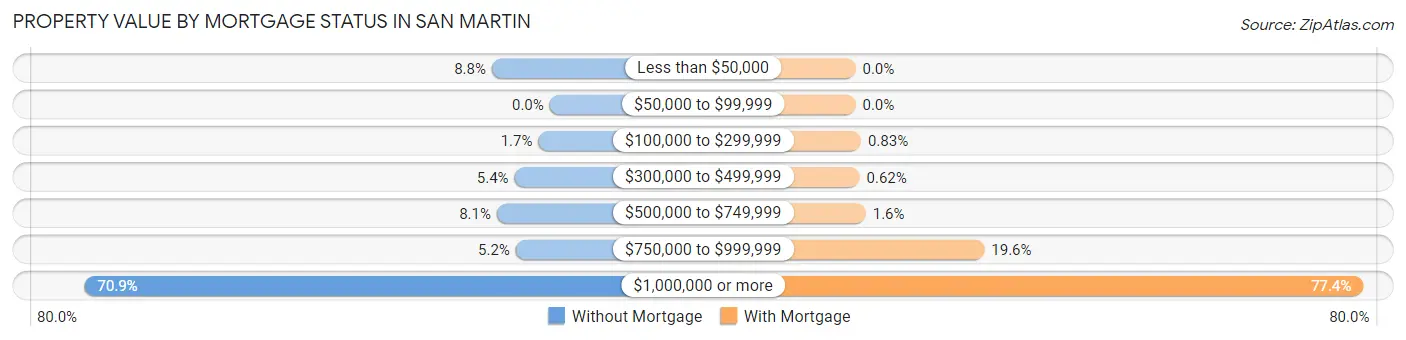
| Property Value | Without Mortgage | With Mortgage |
| Less than $50,000 | 46 (8.8%) | 0 (0.0%) |
| $50,000 to $99,999 | 0 (0.0%) | 0 (0.0%) |
| $100,000 to $299,999 | 9 (1.7%) | 8 (0.8%) |
| $300,000 to $499,999 | 28 (5.4%) | 6 (0.6%) |
| $500,000 to $749,999 | 42 (8.1%) | 15 (1.6%) |
| $750,000 to $999,999 | 27 (5.2%) | 189 (19.6%) |
| $1,000,000 or more | 370 (70.9%) | 745 (77.4%) |
| Total | 522 (100.0%) | 963 (100.0%) |
Household Income by Mortgage Status in San Martin
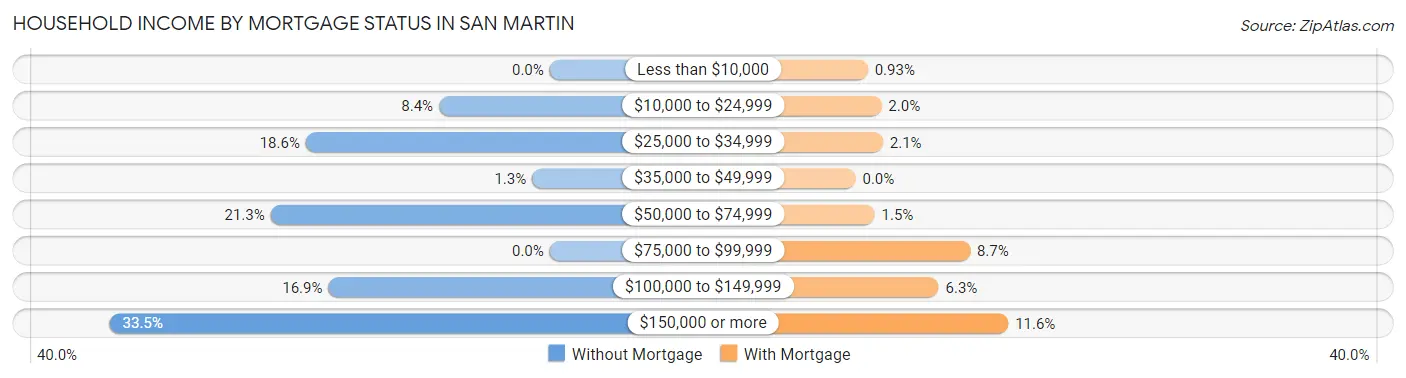
| Household Income | Without Mortgage | With Mortgage |
| Less than $10,000 | 0 (0.0%) | 9 (0.9%) |
| $10,000 to $24,999 | 44 (8.4%) | 19 (2.0%) |
| $25,000 to $34,999 | 97 (18.6%) | 20 (2.1%) |
| $35,000 to $49,999 | 7 (1.3%) | 0 (0.0%) |
| $50,000 to $74,999 | 111 (21.3%) | 14 (1.5%) |
| $75,000 to $99,999 | 0 (0.0%) | 84 (8.7%) |
| $100,000 to $149,999 | 88 (16.9%) | 61 (6.3%) |
| $150,000 or more | 175 (33.5%) | 112 (11.6%) |
| Total | 522 (100.0%) | 963 (100.0%) |
Property Value to Household Income Ratio in San Martin
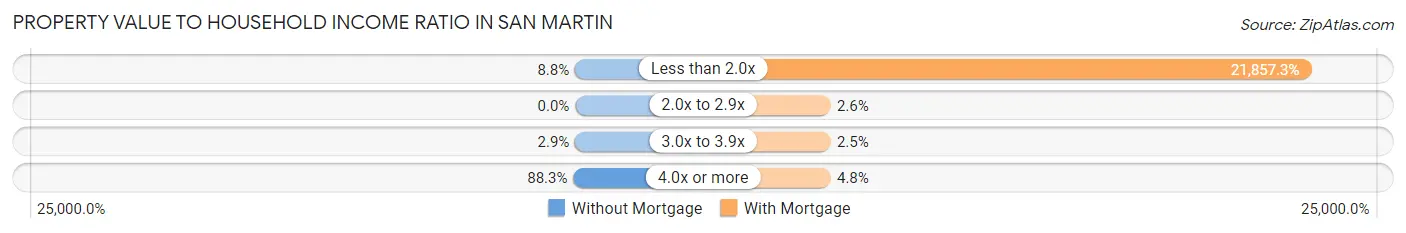
| Value-to-Income Ratio | Without Mortgage | With Mortgage |
| Less than 2.0x | 46 (8.8%) | 210,486 (21,857.3%) |
| 2.0x to 2.9x | 0 (0.0%) | 25 (2.6%) |
| 3.0x to 3.9x | 15 (2.9%) | 24 (2.5%) |
| 4.0x or more | 461 (88.3%) | 46 (4.8%) |
| Total | 522 (100.0%) | 963 (100.0%) |
Real Estate Taxes by Mortgage Status in San Martin
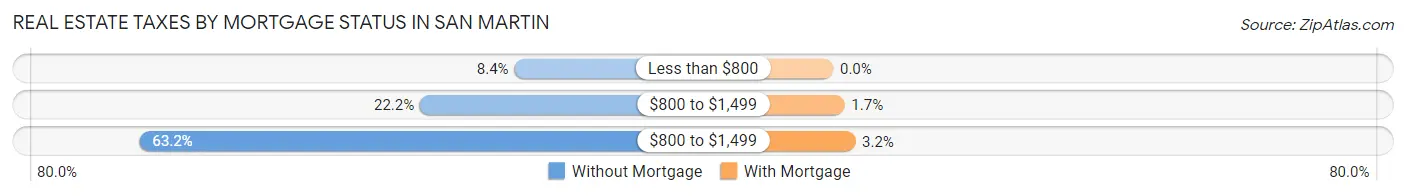
| Property Taxes | Without Mortgage | With Mortgage |
| Less than $800 | 44 (8.4%) | 0 (0.0%) |
| $800 to $1,499 | 116 (22.2%) | 16 (1.7%) |
| $800 to $1,499 | 330 (63.2%) | 31 (3.2%) |
| Total | 522 (100.0%) | 963 (100.0%) |
Health & Disability in San Martin
Health Insurance Coverage by Age in San Martin
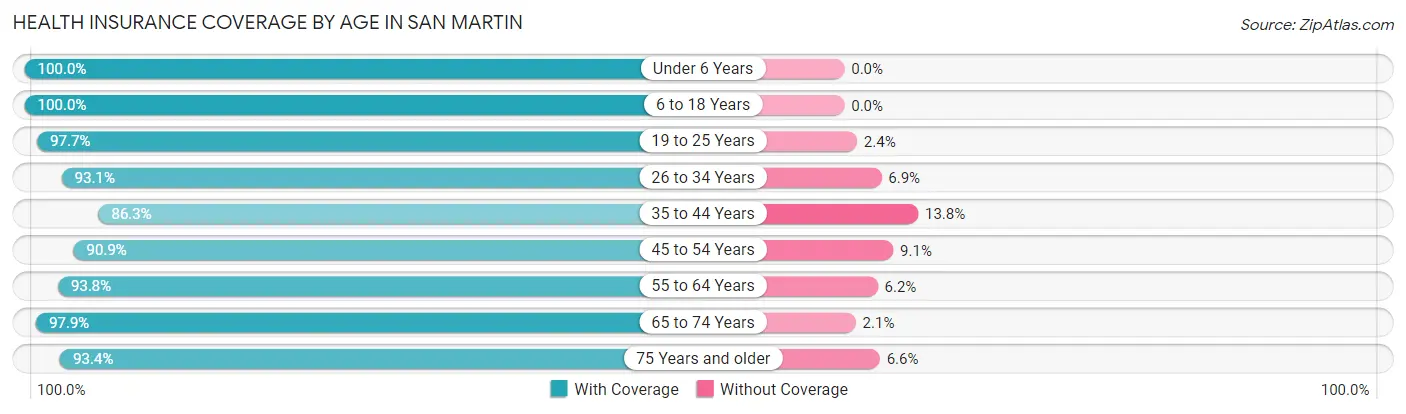
| Age Bracket | With Coverage | Without Coverage |
| Under 6 Years | 145 (100.0%) | 0 (0.0%) |
| 6 to 18 Years | 801 (100.0%) | 0 (0.0%) |
| 19 to 25 Years | 540 (97.7%) | 13 (2.4%) |
| 26 to 34 Years | 458 (93.1%) | 34 (6.9%) |
| 35 to 44 Years | 508 (86.3%) | 81 (13.8%) |
| 45 to 54 Years | 928 (90.9%) | 93 (9.1%) |
| 55 to 64 Years | 1,102 (93.8%) | 73 (6.2%) |
| 65 to 74 Years | 969 (97.9%) | 21 (2.1%) |
| 75 Years and older | 466 (93.4%) | 33 (6.6%) |
| Total | 5,917 (94.5%) | 348 (5.6%) |
Health Insurance Coverage by Citizenship Status in San Martin
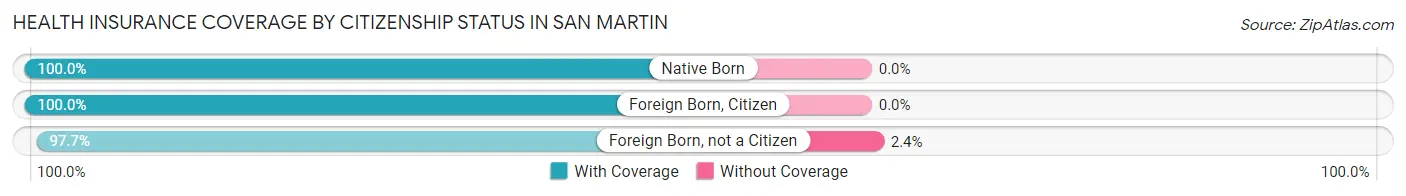
| Citizenship Status | With Coverage | Without Coverage |
| Native Born | 145 (100.0%) | 0 (0.0%) |
| Foreign Born, Citizen | 801 (100.0%) | 0 (0.0%) |
| Foreign Born, not a Citizen | 540 (97.7%) | 13 (2.4%) |
Health Insurance Coverage by Household Income in San Martin
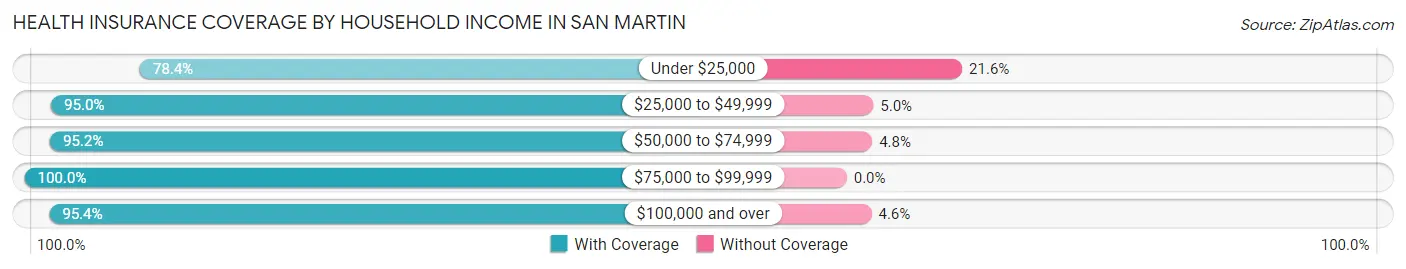
| Household Income | With Coverage | Without Coverage |
| Under $25,000 | 301 (78.4%) | 83 (21.6%) |
| $25,000 to $49,999 | 210 (95.0%) | 11 (5.0%) |
| $50,000 to $74,999 | 701 (95.2%) | 35 (4.8%) |
| $75,000 to $99,999 | 634 (100.0%) | 0 (0.0%) |
| $100,000 and over | 3,827 (95.4%) | 186 (4.6%) |
Public vs Private Health Insurance Coverage by Age in San Martin
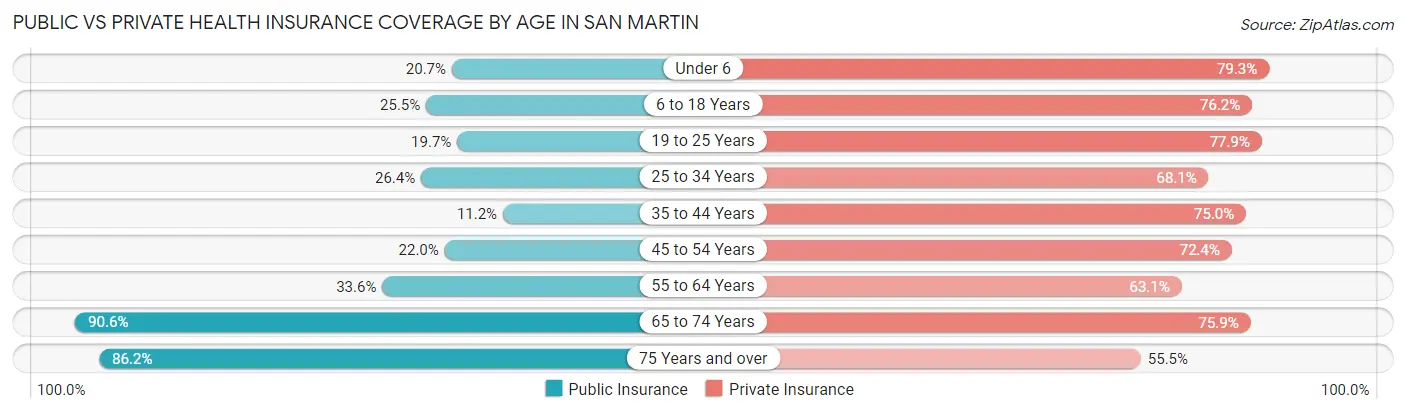
| Age Bracket | Public Insurance | Private Insurance |
| Under 6 | 30 (20.7%) | 115 (79.3%) |
| 6 to 18 Years | 204 (25.5%) | 610 (76.1%) |
| 19 to 25 Years | 109 (19.7%) | 431 (77.9%) |
| 25 to 34 Years | 130 (26.4%) | 335 (68.1%) |
| 35 to 44 Years | 66 (11.2%) | 442 (75.0%) |
| 45 to 54 Years | 225 (22.0%) | 739 (72.4%) |
| 55 to 64 Years | 395 (33.6%) | 741 (63.1%) |
| 65 to 74 Years | 897 (90.6%) | 751 (75.9%) |
| 75 Years and over | 430 (86.2%) | 277 (55.5%) |
| Total | 2,486 (39.7%) | 4,441 (70.9%) |
Disability Status by Sex by Age in San Martin
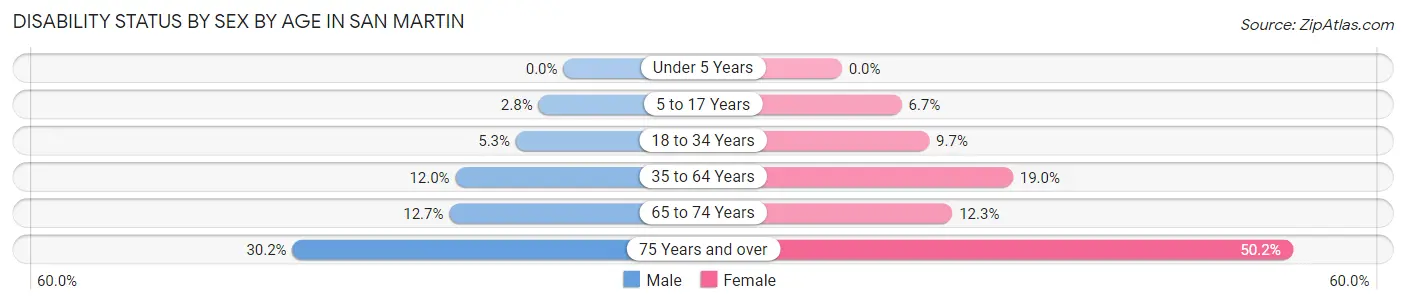
| Age Bracket | Male | Female |
| Under 5 Years | 0 (0.0%) | 0 (0.0%) |
| 5 to 17 Years | 10 (2.8%) | 26 (6.7%) |
| 18 to 34 Years | 28 (5.3%) | 55 (9.7%) |
| 35 to 64 Years | 180 (12.0%) | 245 (19.0%) |
| 65 to 74 Years | 70 (12.7%) | 54 (12.3%) |
| 75 Years and over | 73 (30.2%) | 129 (50.2%) |
Disability Class by Sex by Age in San Martin
Disability Class: Hearing Difficulty
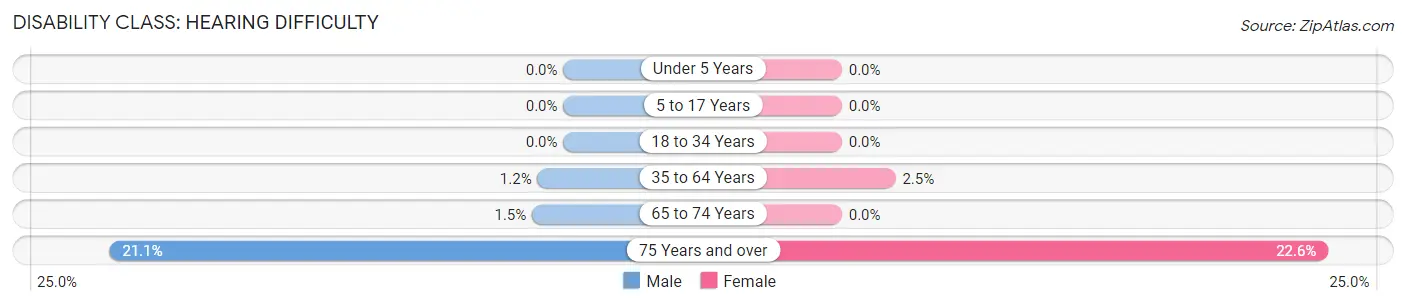
| Age Bracket | Male | Female |
| Under 5 Years | 0 (0.0%) | 0 (0.0%) |
| 5 to 17 Years | 0 (0.0%) | 0 (0.0%) |
| 18 to 34 Years | 0 (0.0%) | 0 (0.0%) |
| 35 to 64 Years | 18 (1.2%) | 32 (2.5%) |
| 65 to 74 Years | 8 (1.5%) | 0 (0.0%) |
| 75 Years and over | 51 (21.1%) | 58 (22.6%) |
Disability Class: Vision Difficulty
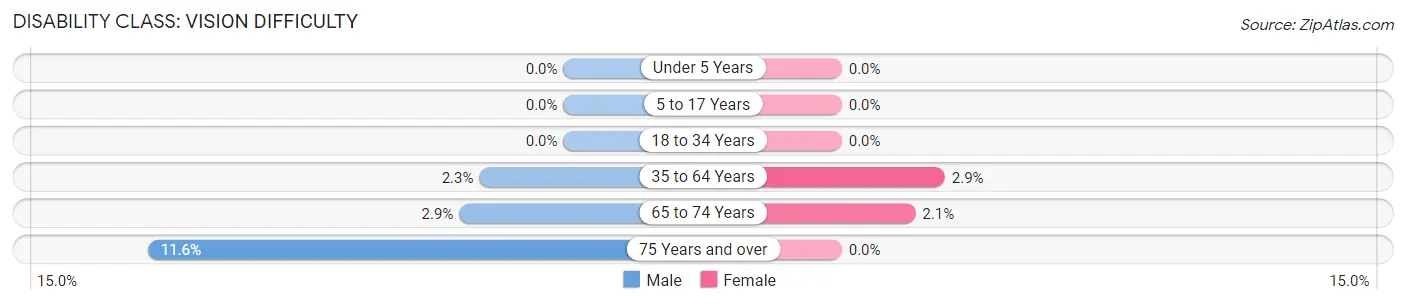
| Age Bracket | Male | Female |
| Under 5 Years | 0 (0.0%) | 0 (0.0%) |
| 5 to 17 Years | 0 (0.0%) | 0 (0.0%) |
| 18 to 34 Years | 0 (0.0%) | 0 (0.0%) |
| 35 to 64 Years | 35 (2.3%) | 37 (2.9%) |
| 65 to 74 Years | 16 (2.9%) | 9 (2.1%) |
| 75 Years and over | 28 (11.6%) | 0 (0.0%) |
Disability Class: Cognitive Difficulty
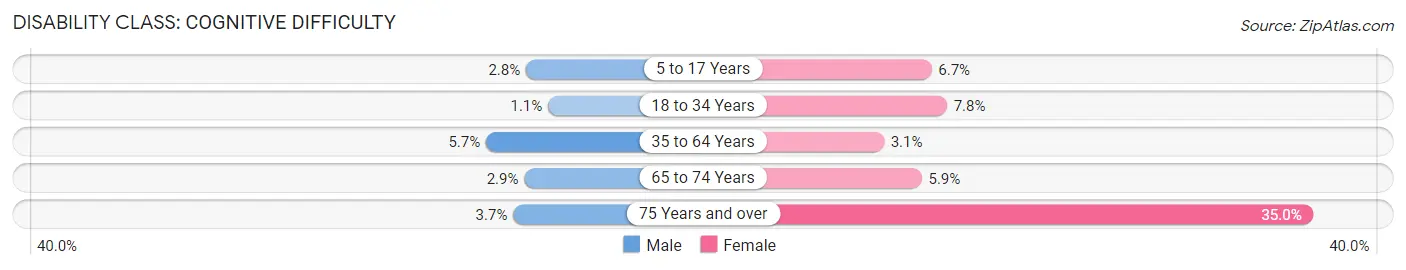
| Age Bracket | Male | Female |
| 5 to 17 Years | 10 (2.8%) | 26 (6.7%) |
| 18 to 34 Years | 6 (1.1%) | 44 (7.8%) |
| 35 to 64 Years | 86 (5.7%) | 40 (3.1%) |
| 65 to 74 Years | 16 (2.9%) | 26 (5.9%) |
| 75 Years and over | 9 (3.7%) | 90 (35.0%) |
Disability Class: Ambulatory Difficulty
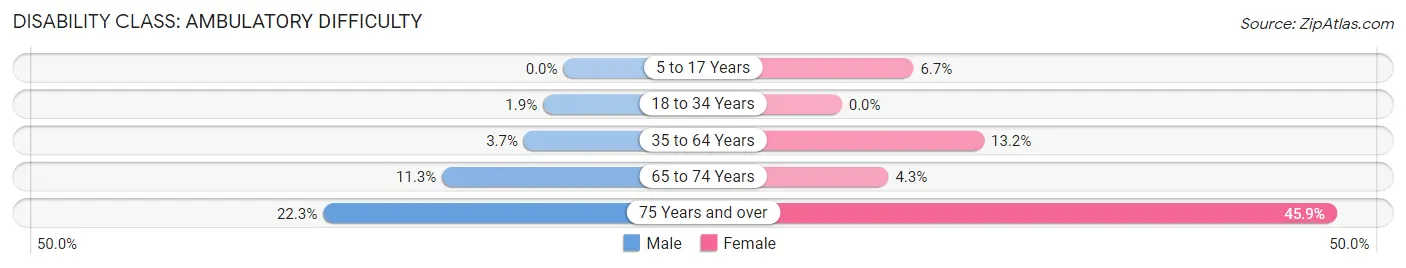
| Age Bracket | Male | Female |
| 5 to 17 Years | 0 (0.0%) | 26 (6.7%) |
| 18 to 34 Years | 10 (1.9%) | 0 (0.0%) |
| 35 to 64 Years | 55 (3.7%) | 170 (13.2%) |
| 65 to 74 Years | 62 (11.3%) | 19 (4.3%) |
| 75 Years and over | 54 (22.3%) | 118 (45.9%) |
Disability Class: Self-Care Difficulty
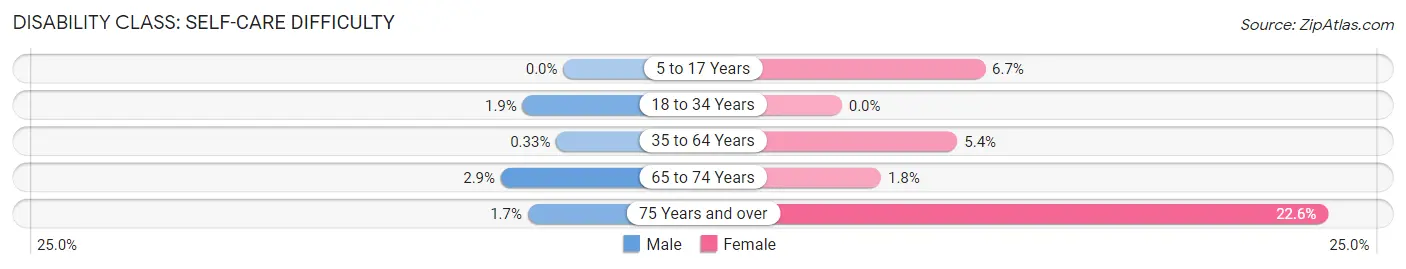
| Age Bracket | Male | Female |
| 5 to 17 Years | 0 (0.0%) | 26 (6.7%) |
| 18 to 34 Years | 10 (1.9%) | 0 (0.0%) |
| 35 to 64 Years | 5 (0.3%) | 69 (5.4%) |
| 65 to 74 Years | 16 (2.9%) | 8 (1.8%) |
| 75 Years and over | 4 (1.7%) | 58 (22.6%) |
Technology Access in San Martin
Computing Device Access in San Martin
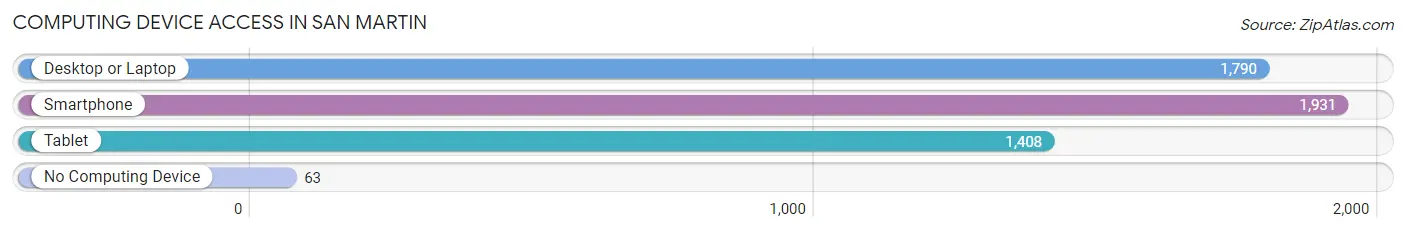
| Device Type | # Households | % Households |
| Desktop or Laptop | 1,790 | 87.9% |
| Smartphone | 1,931 | 94.8% |
| Tablet | 1,408 | 69.2% |
| No Computing Device | 63 | 3.1% |
| Total | 2,036 | 100.0% |
Internet Access in San Martin
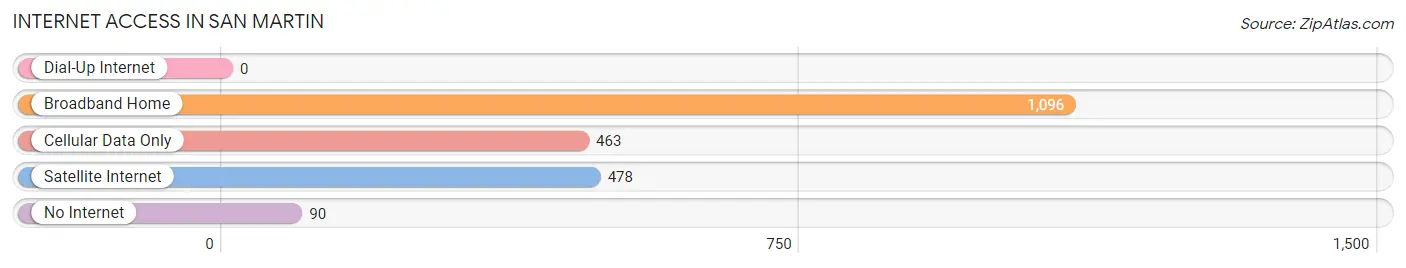
| Internet Type | # Households | % Households |
| Dial-Up Internet | 0 | 0.0% |
| Broadband Home | 1,096 | 53.8% |
| Cellular Data Only | 463 | 22.7% |
| Satellite Internet | 478 | 23.5% |
| No Internet | 90 | 4.4% |
| Total | 2,036 | 100.0% |
San Martin Summary
San Martin is a small unincorporated community located in Santa Clara County, California. It is situated in the southern part of the county, approximately 10 miles south of San Jose and 30 miles north of Salinas. The population of San Martin was estimated to be 5,912 in 2019.
History
San Martin was originally inhabited by the Ohlone people, who lived in the area for thousands of years before the arrival of Europeans. The first Europeans to settle in the area were Spanish missionaries, who established the Mission Santa Clara de Asís in 1777. The mission was the first of its kind in California and served as a base for the Spanish colonization of the region.
In 1839, the Mexican government granted the land that is now San Martin to Juan María Híjar, who established a rancho in the area. The rancho was later sold to José Joaquín Estudillo, who established a large ranch and built a home on the property. The Estudillo family owned the land until the late 19th century, when it was sold to the San Martin Land Company.
The San Martin Land Company developed the area into a farming community, and in 1894, the town of San Martin was officially established. The town was named after Saint Martin of Tours, the patron saint of the Estudillo family.
Geography
San Martin is located in the southern part of Santa Clara County, approximately 10 miles south of San Jose and 30 miles north of Salinas. The town is situated in the foothills of the Santa Cruz Mountains, and is surrounded by rolling hills and open fields. The climate in San Martin is mild, with temperatures ranging from the mid-50s to the mid-80s throughout the year.
Economy
San Martin is primarily a rural community, and the local economy is largely based on agriculture. The town is home to several wineries, and the surrounding area is known for its production of wine grapes, strawberries, and other fruits and vegetables.
The town is also home to several small businesses, including restaurants, retail stores, and auto repair shops. In recent years, San Martin has become a popular destination for tourists, and the town is home to several bed and breakfasts, as well as a number of wineries and tasting rooms.
Demographics
As of 2019, the population of San Martin was estimated to be 5,912. The town is predominantly Hispanic, with a population that is approximately 75% Hispanic and 25% non-Hispanic. The median household income in San Martin is $77,000, and the median home value is $735,000.
San Martin is served by the Santa Clara County Library District, and the town is home to several schools, including San Martin Elementary School, San Martin Middle School, and Live Oak High School. The town is also home to a number of churches, including St. Martin of Tours Catholic Church and San Martin Presbyterian Church.
Common Questions
What is Per Capita Income in San Martin?
Per Capita income in San Martin is $56,005.
What is the Median Family Income in San Martin?
Median Family Income in San Martin is $150,208.
What is the Median Household income in San Martin?
Median Household Income in San Martin is $141,296.
What is Income or Wage Gap in San Martin?
Income or Wage Gap in San Martin is 23.7%.
Women in San Martin earn 76.3 cents for every dollar earned by a man.
What is Inequality or Gini Index in San Martin?
Inequality or Gini Index in San Martin is 0.43.
What is the Total Population of San Martin?
Total Population of San Martin is 6,289.
What is the Total Male Population of San Martin?
Total Male Population of San Martin is 3,220.
What is the Total Female Population of San Martin?
Total Female Population of San Martin is 3,069.
What is the Ratio of Males per 100 Females in San Martin?
There are 104.92 Males per 100 Females in San Martin.
What is the Ratio of Females per 100 Males in San Martin?
There are 95.31 Females per 100 Males in San Martin.
What is the Median Population Age in San Martin?
Median Population Age in San Martin is 52.1 Years.
What is the Average Family Size in San Martin
Average Family Size in San Martin is 3.1 People.
What is the Average Household Size in San Martin
Average Household Size in San Martin is 2.9 People.
How Large is the Labor Force in San Martin?
There are 3,415 People in the Labor Forcein in San Martin.
What is the Percentage of People in the Labor Force in San Martin?
61.2% of People are in the Labor Force in San Martin.
What is the Unemployment Rate in San Martin?
Unemployment Rate in San Martin is 5.9%.