Livermore, CA Map & Demographics
Livermore Map
Livermore Overview
$67,965
PER CAPITA INCOME
$173,560
AVG FAMILY INCOME
$152,590
AVG HOUSEHOLD INCOME
40.3%
WAGE / INCOME GAP [ % ]
59.7¢/ $1
WAGE / INCOME GAP [ $ ]
$12,852
FAMILY INCOME DEFICIT
0.42
INEQUALITY / GINI INDEX
87,154
TOTAL POPULATION
43,048
MALE POPULATION
44,106
FEMALE POPULATION
97.60
MALES / 100 FEMALES
102.46
FEMALES / 100 MALES
40.3
MEDIAN AGE
3.3
AVG FAMILY SIZE
2.8
AVG HOUSEHOLD SIZE
48,544
LABOR FORCE [ PEOPLE ]
69.8%
PERCENT IN LABOR FORCE
3.3%
UNEMPLOYMENT RATE
Livermore Area Codes
Income in Livermore
Income Overview in Livermore
Per Capita Income in Livermore is $67,965, while median incomes of families and households are $173,560 and $152,590 respectively.
| Characteristic | Number | Measure |
| Per Capita Income | 87,154 | $67,965 |
| Median Family Income | 22,553 | $173,560 |
| Mean Family Income | 22,553 | $208,520 |
| Median Household Income | 30,666 | $152,590 |
| Mean Household Income | 30,666 | $187,134 |
| Income Deficit | 22,553 | $12,852 |
| Wage / Income Gap (%) | 87,154 | 40.30% |
| Wage / Income Gap ($) | 87,154 | 59.70¢ per $1 |
| Gini / Inequality Index | 87,154 | 0.42 |
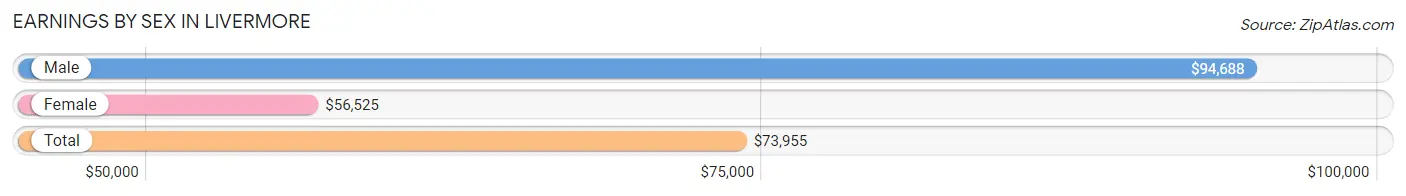
Earnings by Sex in Livermore
Average Earnings in Livermore are $73,955, $94,688 for men and $56,525 for women, a difference of 40.3%.
| Sex | Number | Average Earnings |
| Male | 26,723 (53.6%) | $94,688 |
| Female | 23,134 (46.4%) | $56,525 |
| Total | 49,857 (100.0%) | $73,955 |
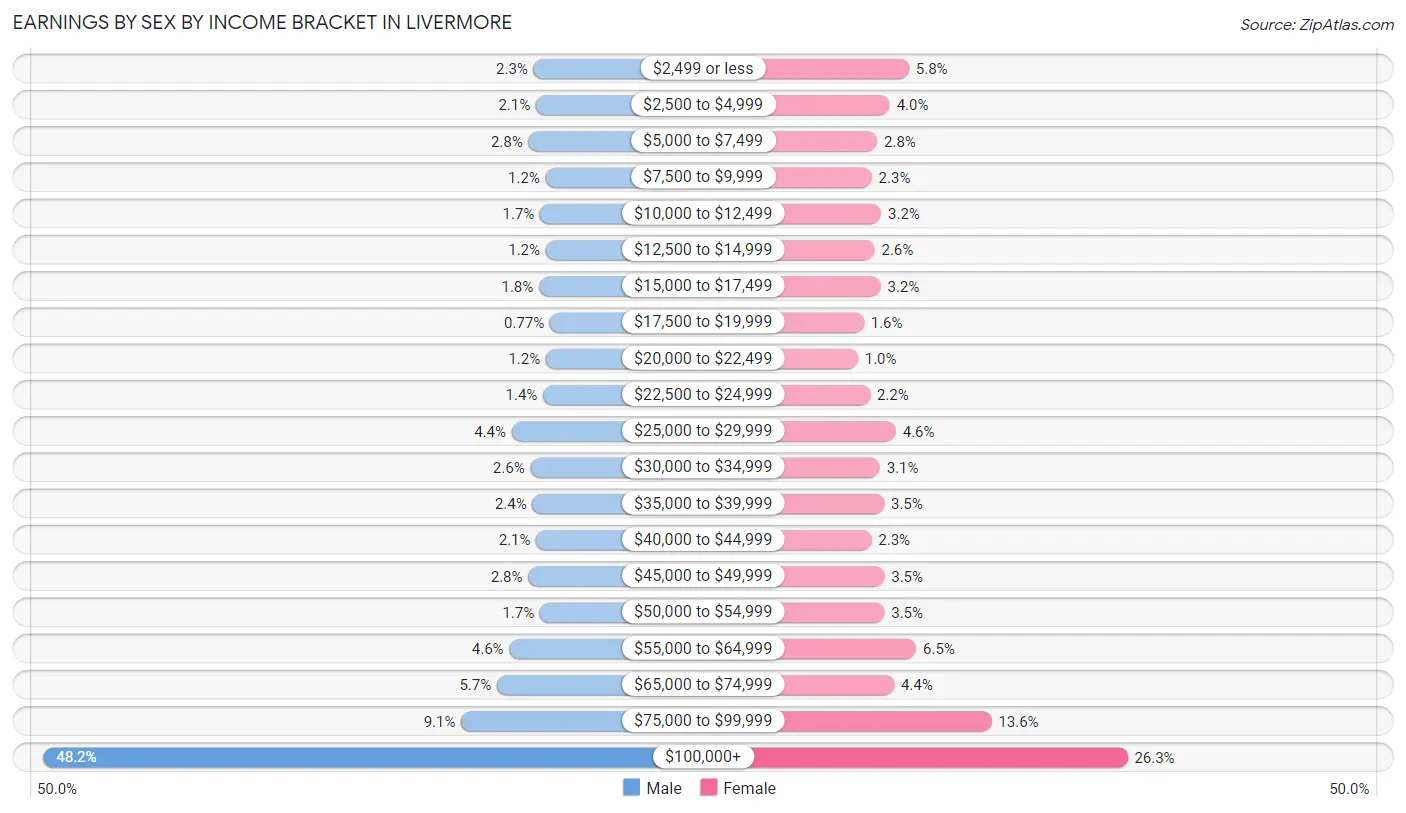
Earnings by Sex by Income Bracket in Livermore
The most common earnings brackets in Livermore are $100,000+ for men (12,891 | 48.2%) and $100,000+ for women (6,082 | 26.3%).
| Income | Male | Female |
| $2,499 or less | 618 (2.3%) | 1,344 (5.8%) |
| $2,500 to $4,999 | 558 (2.1%) | 930 (4.0%) |
| $5,000 to $7,499 | 746 (2.8%) | 657 (2.8%) |
| $7,500 to $9,999 | 319 (1.2%) | 538 (2.3%) |
| $10,000 to $12,499 | 453 (1.7%) | 743 (3.2%) |
| $12,500 to $14,999 | 312 (1.2%) | 601 (2.6%) |
| $15,000 to $17,499 | 480 (1.8%) | 732 (3.2%) |
| $17,500 to $19,999 | 205 (0.8%) | 367 (1.6%) |
| $20,000 to $22,499 | 307 (1.1%) | 238 (1.0%) |
| $22,500 to $24,999 | 380 (1.4%) | 503 (2.2%) |
| $25,000 to $29,999 | 1,164 (4.4%) | 1,063 (4.6%) |
| $30,000 to $34,999 | 698 (2.6%) | 715 (3.1%) |
| $35,000 to $39,999 | 646 (2.4%) | 807 (3.5%) |
| $40,000 to $44,999 | 551 (2.1%) | 532 (2.3%) |
| $45,000 to $49,999 | 750 (2.8%) | 813 (3.5%) |
| $50,000 to $54,999 | 456 (1.7%) | 812 (3.5%) |
| $55,000 to $64,999 | 1,224 (4.6%) | 1,501 (6.5%) |
| $65,000 to $74,999 | 1,535 (5.7%) | 1,022 (4.4%) |
| $75,000 to $99,999 | 2,430 (9.1%) | 3,134 (13.6%) |
| $100,000+ | 12,891 (48.2%) | 6,082 (26.3%) |
| Total | 26,723 (100.0%) | 23,134 (100.0%) |
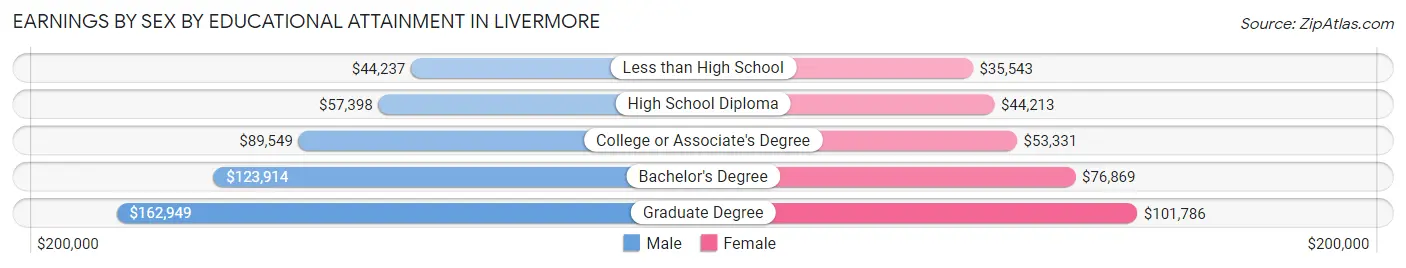
Earnings by Sex by Educational Attainment in Livermore
Average earnings in Livermore are $105,999 for men and $64,631 for women, a difference of 39.0%. Men with an educational attainment of graduate degree enjoy the highest average annual earnings of $162,949, while those with less than high school education earn the least with $44,237. Women with an educational attainment of graduate degree earn the most with the average annual earnings of $101,786, while those with less than high school education have the smallest earnings of $35,543.
| Educational Attainment | Male Income | Female Income |
| Less than High School | $44,237 | $35,543 |
| High School Diploma | $57,398 | $44,213 |
| College or Associate's Degree | $89,549 | $53,331 |
| Bachelor's Degree | $123,914 | $76,869 |
| Graduate Degree | $162,949 | $101,786 |
| Total | $105,999 | $64,631 |
Family Income in Livermore
Family Income Brackets in Livermore
According to the Livermore family income data, there are 9,427 families falling into the $200,000+ income range, which is the most common income bracket and makes up 41.8% of all families. Conversely, the $10,000 to $14,999 income bracket is the least frequent group with only 90 families (0.4%) belonging to this category.
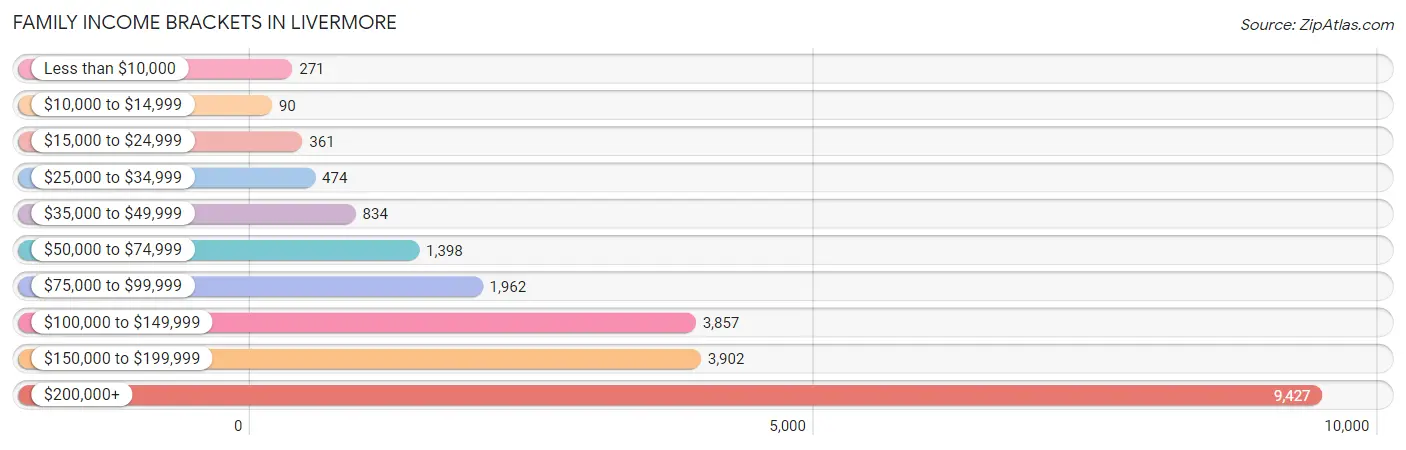
| Income Bracket | # Families | % Families |
| Less than $10,000 | 271 | 1.2% |
| $10,000 to $14,999 | 90 | 0.4% |
| $15,000 to $24,999 | 361 | 1.6% |
| $25,000 to $34,999 | 474 | 2.1% |
| $35,000 to $49,999 | 834 | 3.7% |
| $50,000 to $74,999 | 1,398 | 6.2% |
| $75,000 to $99,999 | 1,962 | 8.7% |
| $100,000 to $149,999 | 3,857 | 17.1% |
| $150,000 to $199,999 | 3,902 | 17.3% |
| $200,000+ | 9,427 | 41.8% |
Family Income by Famaliy Size in Livermore
7+ person families (223 | 1.0%) account for the highest median family income in Livermore with $206,250 per family, while 2-person families (9,055 | 40.2%) have the highest median income of $74,208 per family member.
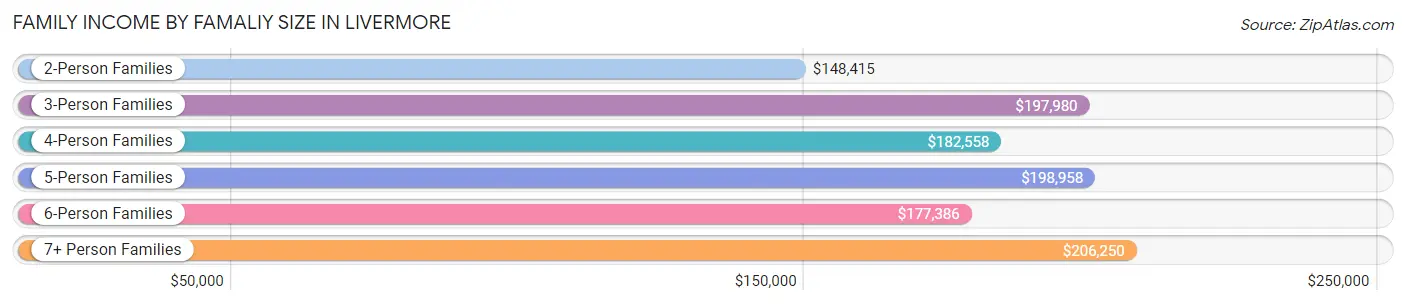
| Income Bracket | # Families | Median Income |
| 2-Person Families | 9,055 (40.2%) | $148,415 |
| 3-Person Families | 5,030 (22.3%) | $197,980 |
| 4-Person Families | 5,990 (26.6%) | $182,558 |
| 5-Person Families | 1,840 (8.2%) | $198,958 |
| 6-Person Families | 415 (1.8%) | $177,386 |
| 7+ Person Families | 223 (1.0%) | $206,250 |
| Total | 22,553 (100.0%) | $173,560 |
Family Income by Number of Earners in Livermore
The median family income in Livermore is $173,560, with families comprising 3+ earners (3,438) having the highest median family income of $215,417, while families with no earners (2,373) have the lowest median family income of $78,042, accounting for 15.2% and 10.5% of families, respectively.
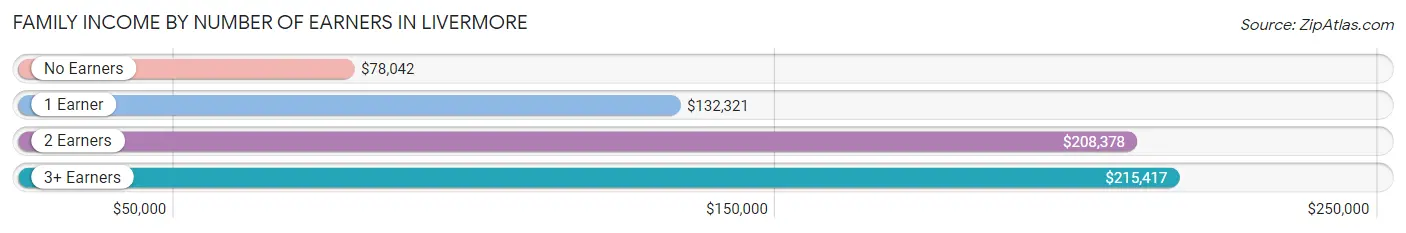
| Number of Earners | # Families | Median Income |
| No Earners | 2,373 (10.5%) | $78,042 |
| 1 Earner | 5,908 (26.2%) | $132,321 |
| 2 Earners | 10,834 (48.0%) | $208,378 |
| 3+ Earners | 3,438 (15.2%) | $215,417 |
| Total | 22,553 (100.0%) | $173,560 |
Household Income in Livermore
Household Income Brackets in Livermore
With 10,886 households falling in the category, the $200,000+ income range is the most frequent in Livermore, accounting for 35.5% of all households. In contrast, only 368 households (1.2%) fall into the $10,000 to $14,999 income bracket, making it the least populous group.
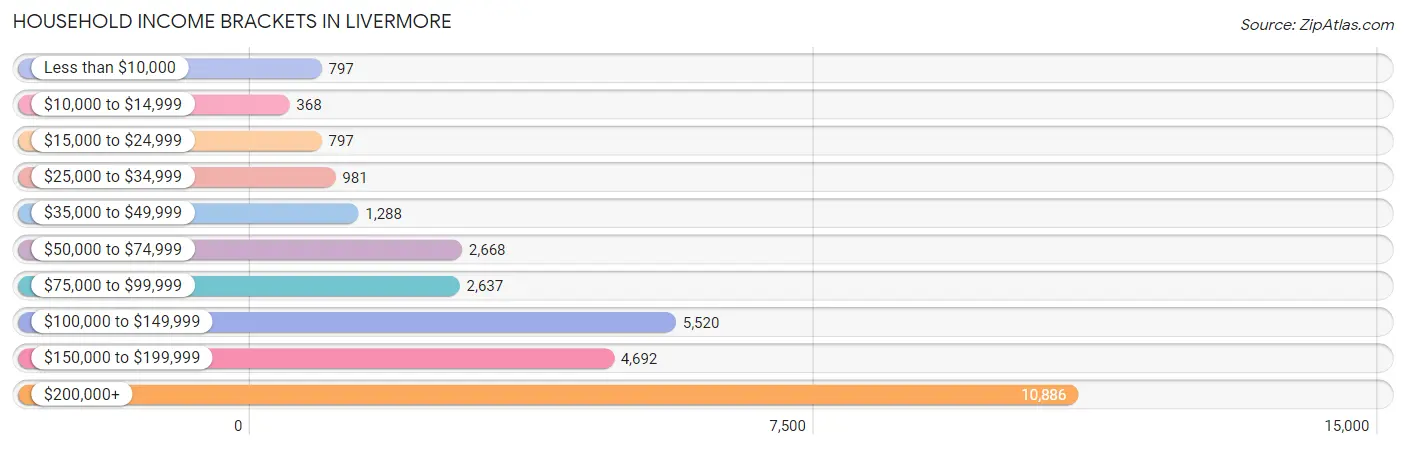
| Income Bracket | # Households | % Households |
| Less than $10,000 | 797 | 2.6% |
| $10,000 to $14,999 | 368 | 1.2% |
| $15,000 to $24,999 | 797 | 2.6% |
| $25,000 to $34,999 | 981 | 3.2% |
| $35,000 to $49,999 | 1,288 | 4.2% |
| $50,000 to $74,999 | 2,668 | 8.7% |
| $75,000 to $99,999 | 2,637 | 8.6% |
| $100,000 to $149,999 | 5,520 | 18.0% |
| $150,000 to $199,999 | 4,692 | 15.3% |
| $200,000+ | 10,886 | 35.5% |
Household Income by Householder Age in Livermore
The median household income in Livermore is $152,590, with the highest median household income of $179,583 found in the 45 to 64 years age bracket for the primary householder. A total of 13,302 households (43.4%) fall into this category. Meanwhile, the 15 to 24 years age bracket for the primary householder has the lowest median household income of $42,303, with 239 households (0.8%) in this group.
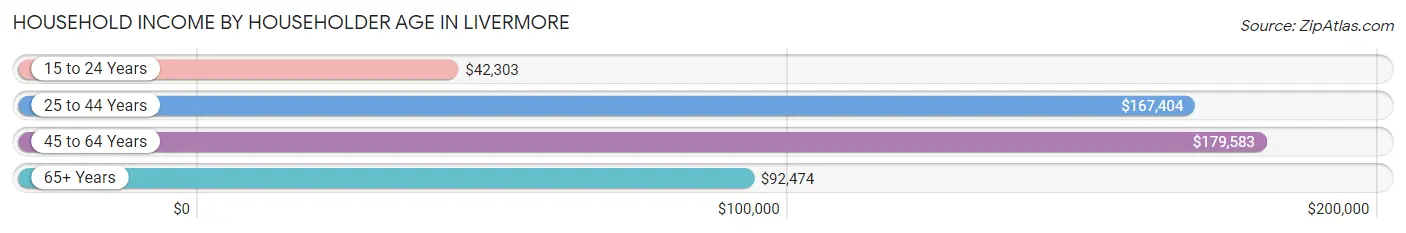
| Income Bracket | # Households | Median Income |
| 15 to 24 Years | 239 (0.8%) | $42,303 |
| 25 to 44 Years | 10,272 (33.5%) | $167,404 |
| 45 to 64 Years | 13,302 (43.4%) | $179,583 |
| 65+ Years | 6,853 (22.4%) | $92,474 |
| Total | 30,666 (100.0%) | $152,590 |
Poverty in Livermore
Income Below Poverty by Sex and Age in Livermore
With 3.4% poverty level for males and 5.2% for females among the residents of Livermore, 18 to 24 year old males and 65 to 74 year old females are the most vulnerable to poverty, with 221 males (6.9%) and 396 females (9.8%) in their respective age groups living below the poverty level.
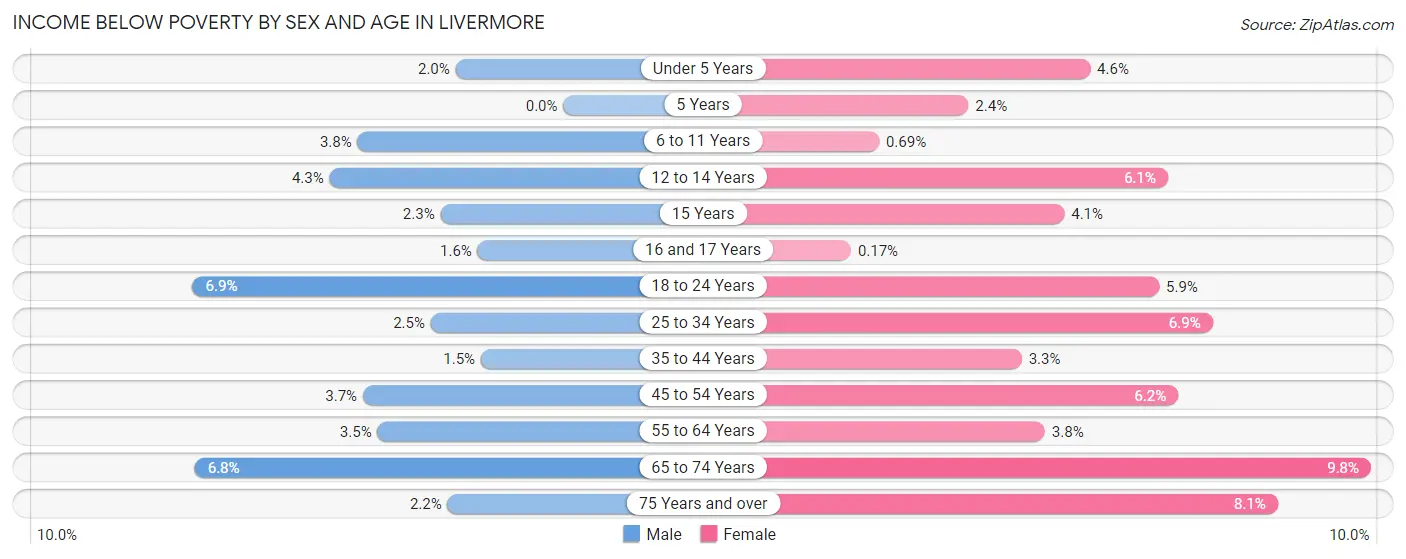
| Age Bracket | Male | Female |
| Under 5 Years | 65 (2.0%) | 116 (4.6%) |
| 5 Years | 0 (0.0%) | 18 (2.4%) |
| 6 to 11 Years | 112 (3.8%) | 24 (0.7%) |
| 12 to 14 Years | 59 (4.3%) | 103 (6.0%) |
| 15 Years | 11 (2.3%) | 13 (4.1%) |
| 16 and 17 Years | 17 (1.6%) | 2 (0.2%) |
| 18 to 24 Years | 221 (6.9%) | 144 (5.9%) |
| 25 to 34 Years | 135 (2.5%) | 393 (6.9%) |
| 35 to 44 Years | 98 (1.5%) | 208 (3.3%) |
| 45 to 54 Years | 249 (3.7%) | 392 (6.2%) |
| 55 to 64 Years | 213 (3.5%) | 229 (3.8%) |
| 65 to 74 Years | 219 (6.8%) | 396 (9.8%) |
| 75 Years and over | 46 (2.1%) | 242 (8.1%) |
| Total | 1,445 (3.4%) | 2,280 (5.2%) |
Income Above Poverty by Sex and Age in Livermore
According to the poverty statistics in Livermore, males aged 5 years and females aged 16 and 17 years are the age groups that are most secure financially, with 100.0% of males and 99.8% of females in these age groups living above the poverty line.
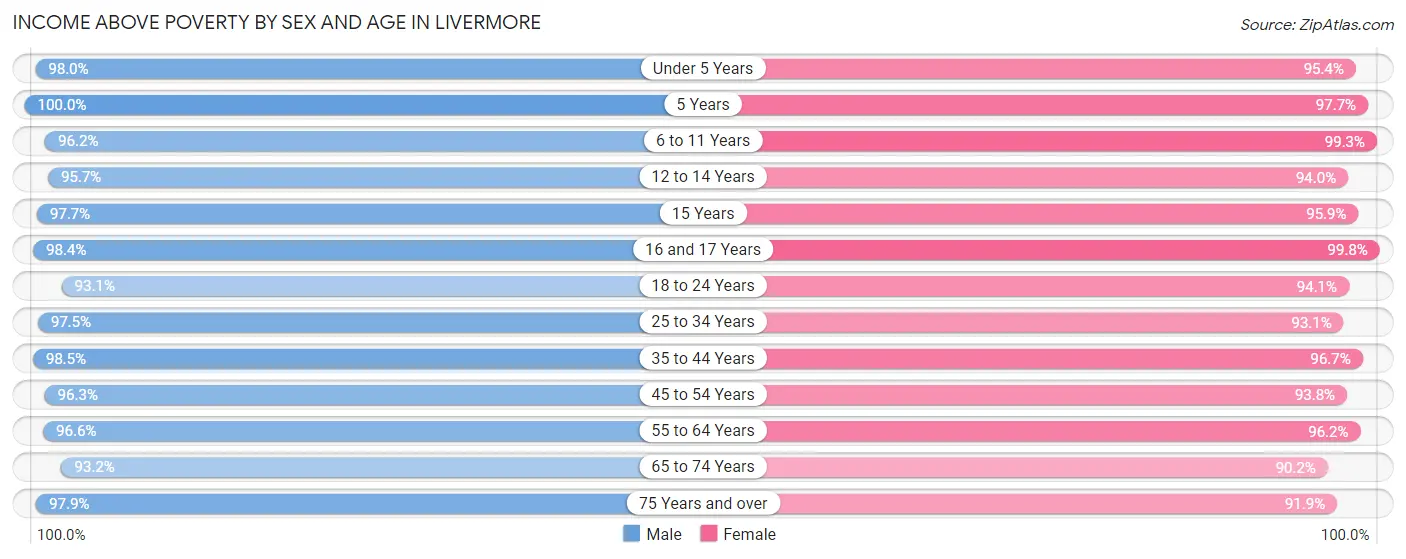
| Age Bracket | Male | Female |
| Under 5 Years | 3,192 (98.0%) | 2,399 (95.4%) |
| 5 Years | 483 (100.0%) | 747 (97.7%) |
| 6 to 11 Years | 2,821 (96.2%) | 3,476 (99.3%) |
| 12 to 14 Years | 1,299 (95.7%) | 1,600 (94.0%) |
| 15 Years | 471 (97.7%) | 302 (95.9%) |
| 16 and 17 Years | 1,049 (98.4%) | 1,188 (99.8%) |
| 18 to 24 Years | 2,989 (93.1%) | 2,302 (94.1%) |
| 25 to 34 Years | 5,348 (97.5%) | 5,319 (93.1%) |
| 35 to 44 Years | 6,306 (98.5%) | 6,012 (96.7%) |
| 45 to 54 Years | 6,445 (96.3%) | 5,889 (93.8%) |
| 55 to 64 Years | 5,967 (96.6%) | 5,851 (96.2%) |
| 65 to 74 Years | 2,981 (93.2%) | 3,638 (90.2%) |
| 75 Years and over | 2,096 (97.9%) | 2,749 (91.9%) |
| Total | 41,447 (96.6%) | 41,472 (94.8%) |
Income Below Poverty Among Married-Couple Families in Livermore
The poverty statistics for married-couple families in Livermore show that 1.3% or 256 of the total 19,107 families live below the poverty line. Families with no children have the highest poverty rate of 1.9%, comprising of 196 families. On the other hand, families with 3 or 4 children have the lowest poverty rate of 0.0%, which includes 0 families.
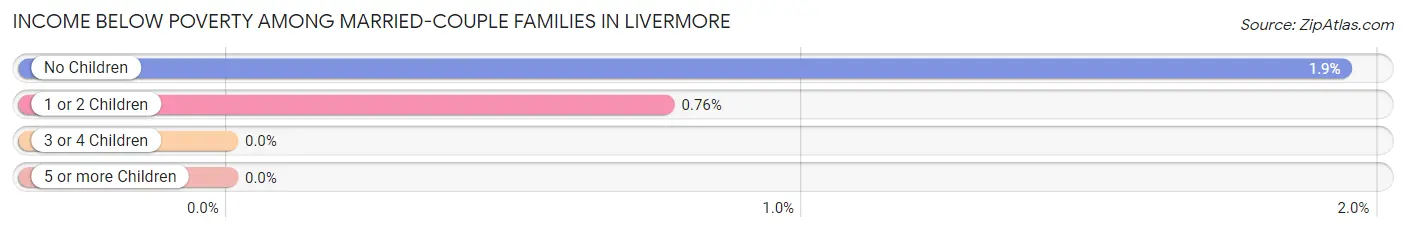
| Children | Above Poverty | Below Poverty |
| No Children | 9,929 (98.1%) | 196 (1.9%) |
| 1 or 2 Children | 7,803 (99.2%) | 60 (0.8%) |
| 3 or 4 Children | 1,119 (100.0%) | 0 (0.0%) |
| 5 or more Children | 0 (0.0%) | 0 (0.0%) |
| Total | 18,851 (98.7%) | 256 (1.3%) |
Income Below Poverty Among Single-Parent Households in Livermore
According to the poverty data in Livermore, 3.9% or 41 single-father households and 6.9% or 165 single-mother households are living below the poverty line. Among single-father households, those with 1 or 2 children have the highest poverty rate, with 41 households (9.3%) experiencing poverty. Likewise, among single-mother households, those with 3 or 4 children have the highest poverty rate, with 89 households (66.9%) falling below the poverty line.
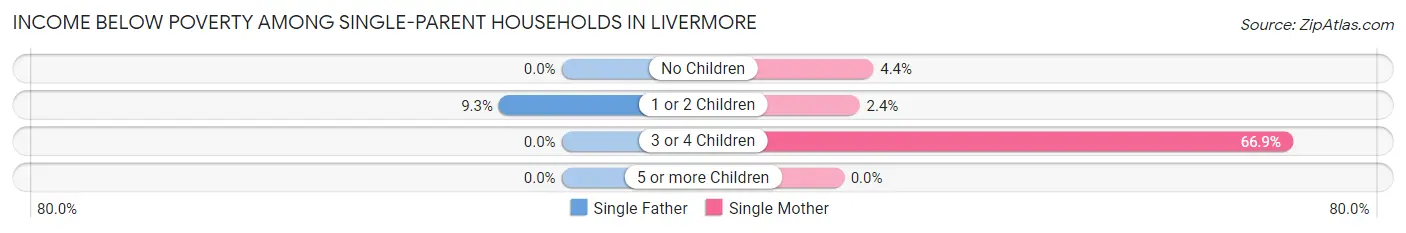
| Children | Single Father | Single Mother |
| No Children | 0 (0.0%) | 48 (4.4%) |
| 1 or 2 Children | 41 (9.3%) | 28 (2.4%) |
| 3 or 4 Children | 0 (0.0%) | 89 (66.9%) |
| 5 or more Children | 0 (0.0%) | 0 (0.0%) |
| Total | 41 (3.9%) | 165 (6.9%) |
Income Below Poverty Among Married-Couple vs Single-Parent Households in Livermore
The poverty data for Livermore shows that 256 of the married-couple family households (1.3%) and 206 of the single-parent households (6.0%) are living below the poverty level. Within the married-couple family households, those with no children have the highest poverty rate, with 196 households (1.9%) falling below the poverty line. Among the single-parent households, those with 3 or 4 children have the highest poverty rate, with 89 household (36.3%) living below poverty.
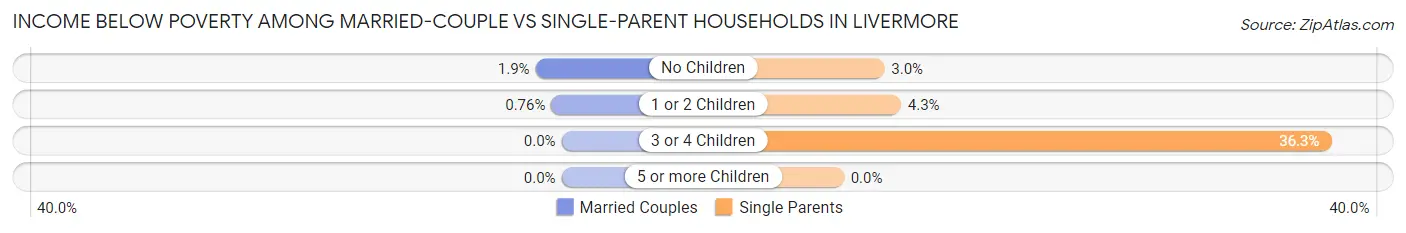
| Children | Married-Couple Families | Single-Parent Households |
| No Children | 196 (1.9%) | 48 (3.0%) |
| 1 or 2 Children | 60 (0.8%) | 69 (4.3%) |
| 3 or 4 Children | 0 (0.0%) | 89 (36.3%) |
| 5 or more Children | 0 (0.0%) | 0 (0.0%) |
| Total | 256 (1.3%) | 206 (6.0%) |
Race in Livermore
The most populous races in Livermore are White / Caucasian (54,094 | 62.1%), Hispanic or Latino (19,726 | 22.6%), and Asian (14,070 | 16.1%).
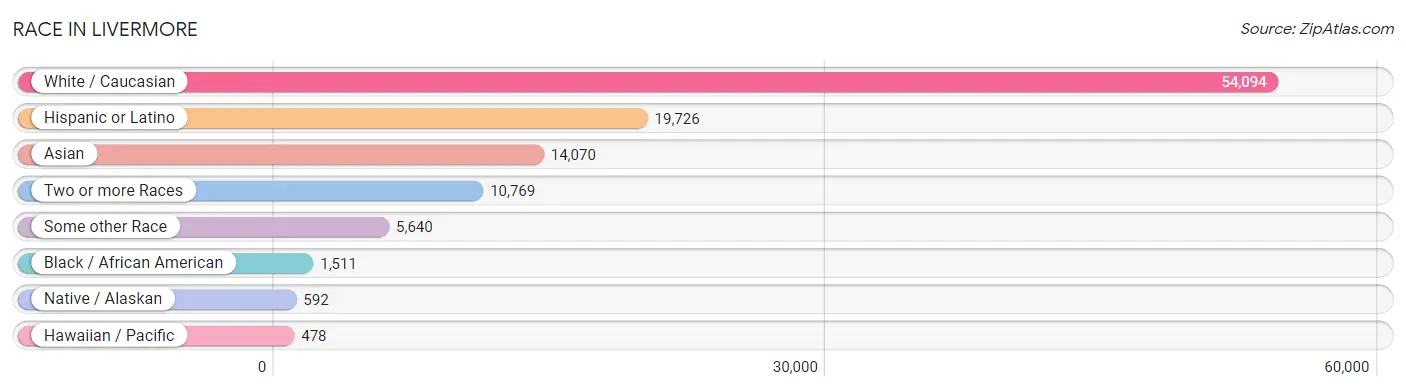
| Race | # Population | % Population |
| Asian | 14,070 | 16.1% |
| Black / African American | 1,511 | 1.7% |
| Hawaiian / Pacific | 478 | 0.5% |
| Hispanic or Latino | 19,726 | 22.6% |
| Native / Alaskan | 592 | 0.7% |
| White / Caucasian | 54,094 | 62.1% |
| Two or more Races | 10,769 | 12.4% |
| Some other Race | 5,640 | 6.5% |
| Total | 87,154 | 100.0% |
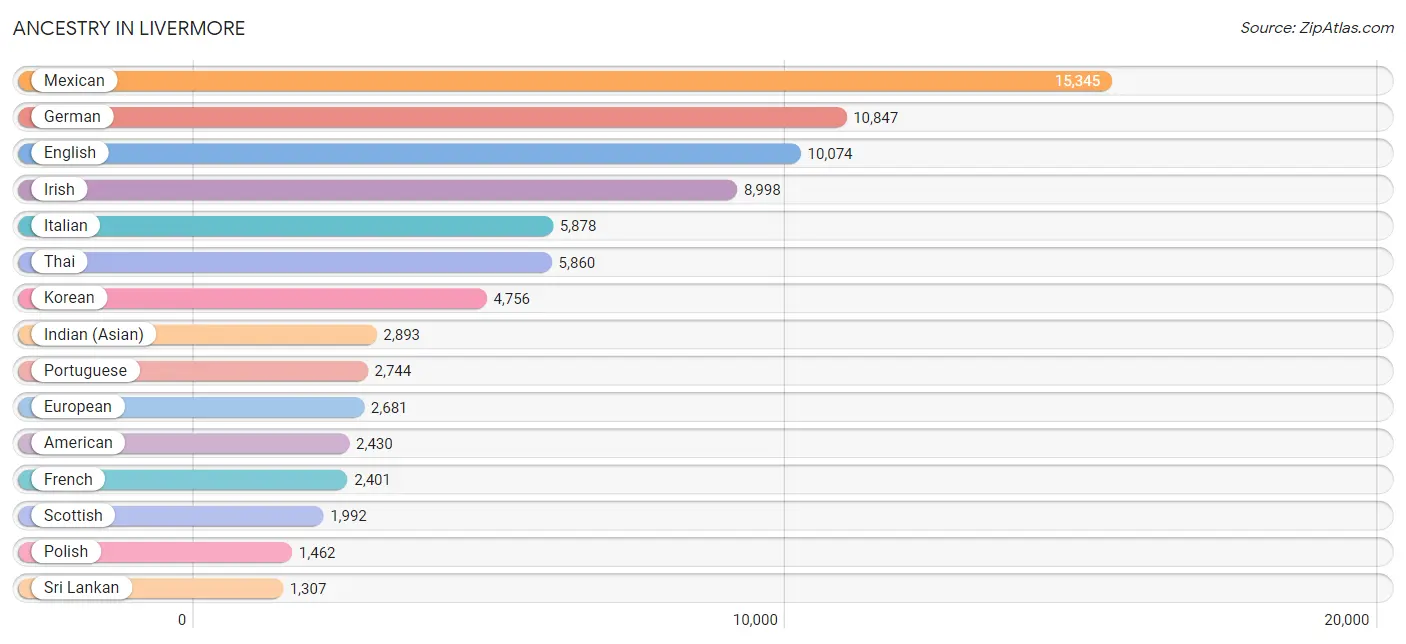
Ancestry in Livermore
The most populous ancestries reported in Livermore are Mexican (15,345 | 17.6%), German (10,847 | 12.4%), English (10,074 | 11.6%), Irish (8,998 | 10.3%), and Italian (5,878 | 6.7%), together accounting for 58.7% of all Livermore residents.
| Ancestry | # Population | % Population |
| Afghan | 41 | 0.1% |
| African | 33 | 0.0% |
| Alaska Native | 8 | 0.0% |
| Aleut | 38 | 0.0% |
| American | 2,430 | 2.8% |
| Apache | 99 | 0.1% |
| Arab | 422 | 0.5% |
| Argentinean | 226 | 0.3% |
| Armenian | 197 | 0.2% |
| Assyrian / Chaldean / Syriac | 29 | 0.0% |
| Australian | 37 | 0.0% |
| Austrian | 394 | 0.4% |
| Bangladeshi | 51 | 0.1% |
| Basque | 53 | 0.1% |
| Belgian | 33 | 0.0% |
| Belizean | 4 | 0.0% |
| Bhutanese | 741 | 0.9% |
| Blackfeet | 8 | 0.0% |
| Bolivian | 29 | 0.0% |
| Brazilian | 66 | 0.1% |
| British | 572 | 0.7% |
| Bulgarian | 30 | 0.0% |
| Burmese | 966 | 1.1% |
| Canadian | 150 | 0.2% |
| Cape Verdean | 45 | 0.1% |
| Celtic | 56 | 0.1% |
| Central American | 1,038 | 1.2% |
| Central American Indian | 181 | 0.2% |
| Cherokee | 340 | 0.4% |
| Chilean | 22 | 0.0% |
| Chinese | 22 | 0.0% |
| Chippewa | 11 | 0.0% |
| Choctaw | 91 | 0.1% |
| Colombian | 32 | 0.0% |
| Comanche | 28 | 0.0% |
| Costa Rican | 18 | 0.0% |
| Cree | 9 | 0.0% |
| Creek | 12 | 0.0% |
| Croatian | 280 | 0.3% |
| Crow | 8 | 0.0% |
| Cuban | 179 | 0.2% |
| Czech | 119 | 0.1% |
| Czechoslovakian | 126 | 0.1% |
| Danish | 724 | 0.8% |
| Dominican | 13 | 0.0% |
| Dutch | 956 | 1.1% |
| Dutch West Indian | 7 | 0.0% |
| Eastern European | 367 | 0.4% |
| Ecuadorian | 76 | 0.1% |
| Egyptian | 155 | 0.2% |
| English | 10,074 | 11.6% |
| Ethiopian | 31 | 0.0% |
| European | 2,681 | 3.1% |
| Filipino | 155 | 0.2% |
| Finnish | 249 | 0.3% |
| French | 2,401 | 2.8% |
| French Canadian | 359 | 0.4% |
| German | 10,847 | 12.4% |
| Greek | 333 | 0.4% |
| Guamanian / Chamorro | 144 | 0.2% |
| Guatemalan | 100 | 0.1% |
| Honduran | 49 | 0.1% |
| Hungarian | 168 | 0.2% |
| Indian (Asian) | 2,893 | 3.3% |
| Indonesian | 86 | 0.1% |
| Iranian | 360 | 0.4% |
| Irish | 8,998 | 10.3% |
| Iroquois | 228 | 0.3% |
| Israeli | 115 | 0.1% |
| Italian | 5,878 | 6.7% |
| Jamaican | 22 | 0.0% |
| Japanese | 363 | 0.4% |
| Korean | 4,756 | 5.5% |
| Laotian | 64 | 0.1% |
| Latvian | 6 | 0.0% |
| Lebanese | 45 | 0.1% |
| Lithuanian | 165 | 0.2% |
| Luxembourger | 12 | 0.0% |
| Malaysian | 130 | 0.2% |
| Mexican | 15,345 | 17.6% |
| Mexican American Indian | 224 | 0.3% |
| Mongolian | 73 | 0.1% |
| Native Hawaiian | 848 | 1.0% |
| Navajo | 59 | 0.1% |
| Nicaraguan | 330 | 0.4% |
| Nigerian | 437 | 0.5% |
| Northern European | 230 | 0.3% |
| Norwegian | 1,277 | 1.5% |
| Paiute | 12 | 0.0% |
| Pakistani | 378 | 0.4% |
| Palestinian | 69 | 0.1% |
| Panamanian | 80 | 0.1% |
| Pennsylvania German | 13 | 0.0% |
| Peruvian | 257 | 0.3% |
| Polish | 1,462 | 1.7% |
| Portuguese | 2,744 | 3.2% |
| Potawatomi | 10 | 0.0% |
| Puerto Rican | 803 | 0.9% |
| Romanian | 180 | 0.2% |
| Russian | 597 | 0.7% |
| Salvadoran | 398 | 0.5% |
| Samoan | 65 | 0.1% |
| Scandinavian | 340 | 0.4% |
| Scotch-Irish | 501 | 0.6% |
| Scottish | 1,992 | 2.3% |
| Serbian | 68 | 0.1% |
| Slavic | 21 | 0.0% |
| Slovak | 69 | 0.1% |
| Slovene | 31 | 0.0% |
| South African | 21 | 0.0% |
| South American | 720 | 0.8% |
| South American Indian | 49 | 0.1% |
| Spaniard | 383 | 0.4% |
| Spanish | 727 | 0.8% |
| Spanish American | 82 | 0.1% |
| Sri Lankan | 1,307 | 1.5% |
| Subsaharan African | 567 | 0.6% |
| Swedish | 1,149 | 1.3% |
| Swiss | 580 | 0.7% |
| Syrian | 39 | 0.0% |
| Thai | 5,860 | 6.7% |
| Tongan | 3 | 0.0% |
| Turkish | 80 | 0.1% |
| Ukrainian | 433 | 0.5% |
| Venezuelan | 11 | 0.0% |
| Welsh | 381 | 0.4% |
| Yaqui | 24 | 0.0% |
| Yugoslavian | 18 | 0.0% | View All 128 Rows |
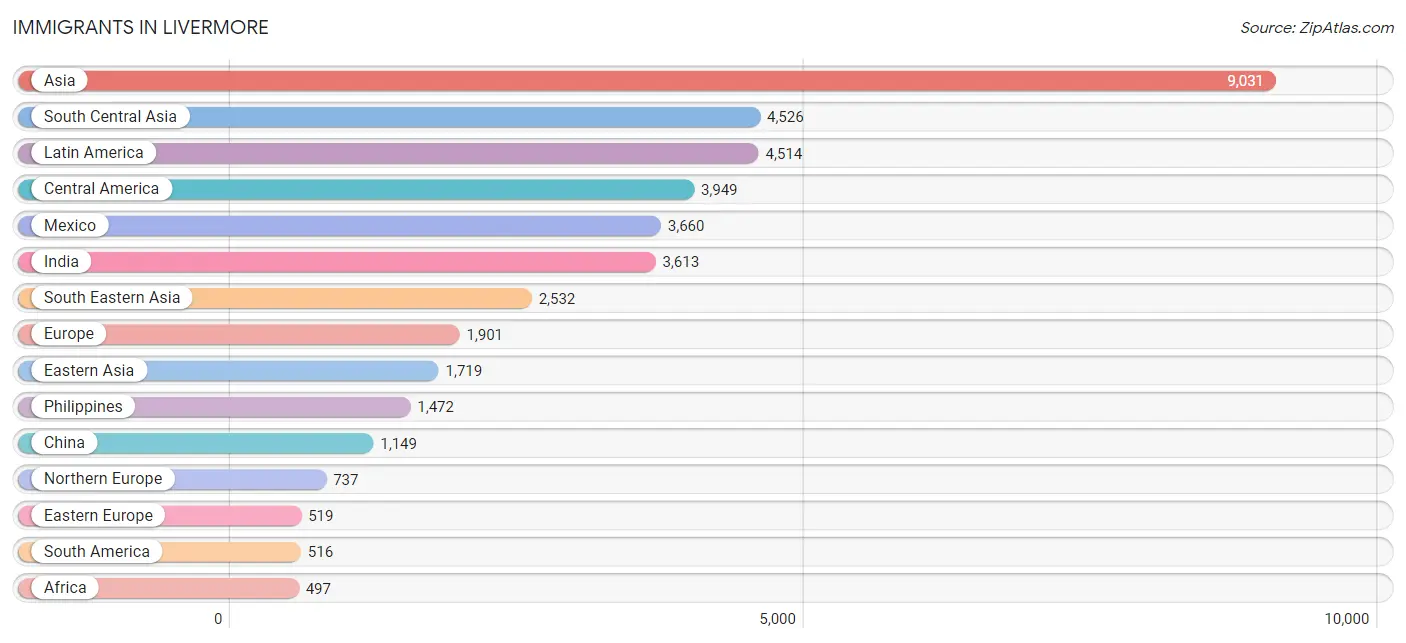
Immigrants in Livermore
The most numerous immigrant groups reported in Livermore came from Asia (9,031 | 10.4%), South Central Asia (4,526 | 5.2%), Latin America (4,514 | 5.2%), Central America (3,949 | 4.5%), and Mexico (3,660 | 4.2%), together accounting for 29.5% of all Livermore residents.
| Immigration Origin | # Population | % Population |
| Afghanistan | 145 | 0.2% |
| Africa | 497 | 0.6% |
| Argentina | 22 | 0.0% |
| Asia | 9,031 | 10.4% |
| Australia | 55 | 0.1% |
| Austria | 27 | 0.0% |
| Belgium | 6 | 0.0% |
| Brazil | 108 | 0.1% |
| Bulgaria | 15 | 0.0% |
| Cambodia | 98 | 0.1% |
| Canada | 452 | 0.5% |
| Caribbean | 49 | 0.1% |
| Central America | 3,949 | 4.5% |
| China | 1,149 | 1.3% |
| Colombia | 36 | 0.0% |
| Costa Rica | 18 | 0.0% |
| Croatia | 23 | 0.0% |
| Cuba | 21 | 0.0% |
| Czechoslovakia | 23 | 0.0% |
| Denmark | 29 | 0.0% |
| Dominican Republic | 13 | 0.0% |
| Eastern Africa | 62 | 0.1% |
| Eastern Asia | 1,719 | 2.0% |
| Eastern Europe | 519 | 0.6% |
| Ecuador | 37 | 0.0% |
| Egypt | 163 | 0.2% |
| El Salvador | 109 | 0.1% |
| England | 412 | 0.5% |
| Europe | 1,901 | 2.2% |
| Fiji | 32 | 0.0% |
| France | 203 | 0.2% |
| Germany | 153 | 0.2% |
| Greece | 44 | 0.1% |
| Guatemala | 84 | 0.1% |
| Hong Kong | 132 | 0.2% |
| India | 3,613 | 4.2% |
| Indonesia | 23 | 0.0% |
| Iran | 316 | 0.4% |
| Iraq | 24 | 0.0% |
| Ireland | 132 | 0.2% |
| Israel | 157 | 0.2% |
| Italy | 58 | 0.1% |
| Jamaica | 15 | 0.0% |
| Japan | 103 | 0.1% |
| Kenya | 21 | 0.0% |
| Korea | 467 | 0.5% |
| Laos | 4 | 0.0% |
| Latin America | 4,514 | 5.2% |
| Lebanon | 10 | 0.0% |
| Malaysia | 190 | 0.2% |
| Mexico | 3,660 | 4.2% |
| Micronesia | 16 | 0.0% |
| Moldova | 83 | 0.1% |
| Nepal | 71 | 0.1% |
| Netherlands | 35 | 0.0% |
| Nicaragua | 26 | 0.0% |
| Nigeria | 168 | 0.2% |
| Northern Africa | 163 | 0.2% |
| Northern Europe | 737 | 0.9% |
| Norway | 10 | 0.0% |
| Oceania | 155 | 0.2% |
| Pakistan | 362 | 0.4% |
| Panama | 52 | 0.1% |
| Peru | 269 | 0.3% |
| Philippines | 1,472 | 1.7% |
| Poland | 81 | 0.1% |
| Portugal | 98 | 0.1% |
| Romania | 67 | 0.1% |
| Russia | 100 | 0.1% |
| Scotland | 15 | 0.0% |
| Serbia | 10 | 0.0% |
| South Africa | 104 | 0.1% |
| South America | 516 | 0.6% |
| South Central Asia | 4,526 | 5.2% |
| South Eastern Asia | 2,532 | 2.9% |
| Southern Europe | 221 | 0.3% |
| Spain | 21 | 0.0% |
| Sri Lanka | 19 | 0.0% |
| Sweden | 10 | 0.0% |
| Syria | 15 | 0.0% |
| Taiwan | 270 | 0.3% |
| Thailand | 183 | 0.2% |
| Turkey | 48 | 0.1% |
| Uganda | 17 | 0.0% |
| Ukraine | 107 | 0.1% |
| Venezuela | 11 | 0.0% |
| Vietnam | 462 | 0.5% |
| Western Africa | 168 | 0.2% |
| Western Asia | 254 | 0.3% |
| Western Europe | 424 | 0.5% | View All 90 Rows |
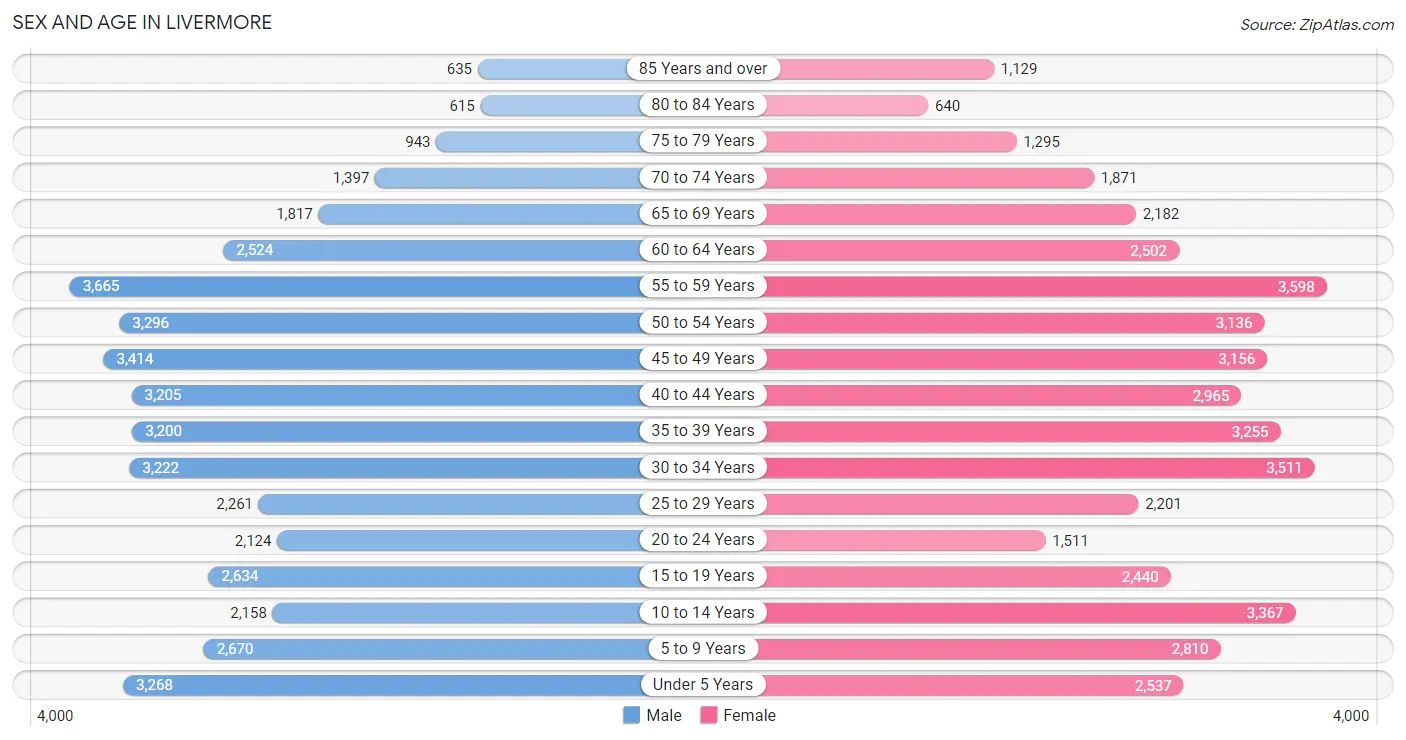
Sex and Age in Livermore
Sex and Age in Livermore
The most populous age groups in Livermore are 55 to 59 Years (3,665 | 8.5%) for men and 55 to 59 Years (3,598 | 8.2%) for women.
| Age Bracket | Male | Female |
| Under 5 Years | 3,268 (7.6%) | 2,537 (5.8%) |
| 5 to 9 Years | 2,670 (6.2%) | 2,810 (6.4%) |
| 10 to 14 Years | 2,158 (5.0%) | 3,367 (7.6%) |
| 15 to 19 Years | 2,634 (6.1%) | 2,440 (5.5%) |
| 20 to 24 Years | 2,124 (4.9%) | 1,511 (3.4%) |
| 25 to 29 Years | 2,261 (5.2%) | 2,201 (5.0%) |
| 30 to 34 Years | 3,222 (7.5%) | 3,511 (8.0%) |
| 35 to 39 Years | 3,200 (7.4%) | 3,255 (7.4%) |
| 40 to 44 Years | 3,205 (7.4%) | 2,965 (6.7%) |
| 45 to 49 Years | 3,414 (7.9%) | 3,156 (7.2%) |
| 50 to 54 Years | 3,296 (7.7%) | 3,136 (7.1%) |
| 55 to 59 Years | 3,665 (8.5%) | 3,598 (8.2%) |
| 60 to 64 Years | 2,524 (5.9%) | 2,502 (5.7%) |
| 65 to 69 Years | 1,817 (4.2%) | 2,182 (5.0%) |
| 70 to 74 Years | 1,397 (3.3%) | 1,871 (4.2%) |
| 75 to 79 Years | 943 (2.2%) | 1,295 (2.9%) |
| 80 to 84 Years | 615 (1.4%) | 640 (1.5%) |
| 85 Years and over | 635 (1.5%) | 1,129 (2.6%) |
| Total | 43,048 (100.0%) | 44,106 (100.0%) |
Families and Households in Livermore
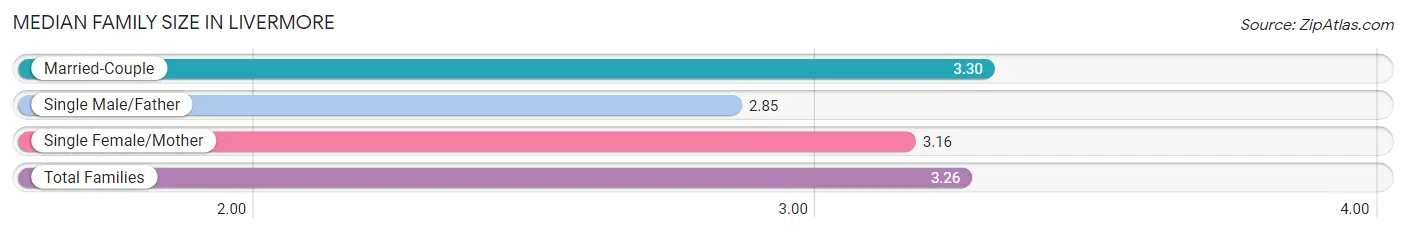
Median Family Size in Livermore
The median family size in Livermore is 3.26 persons per family, with married-couple families (19,107 | 84.7%) accounting for the largest median family size of 3.3 persons per family. On the other hand, single male/father families (1,046 | 4.6%) represent the smallest median family size with 2.85 persons per family.
| Family Type | # Families | Family Size |
| Married-Couple | 19,107 (84.7%) | 3.30 |
| Single Male/Father | 1,046 (4.6%) | 2.85 |
| Single Female/Mother | 2,400 (10.6%) | 3.16 |
| Total Families | 22,553 (100.0%) | 3.26 |
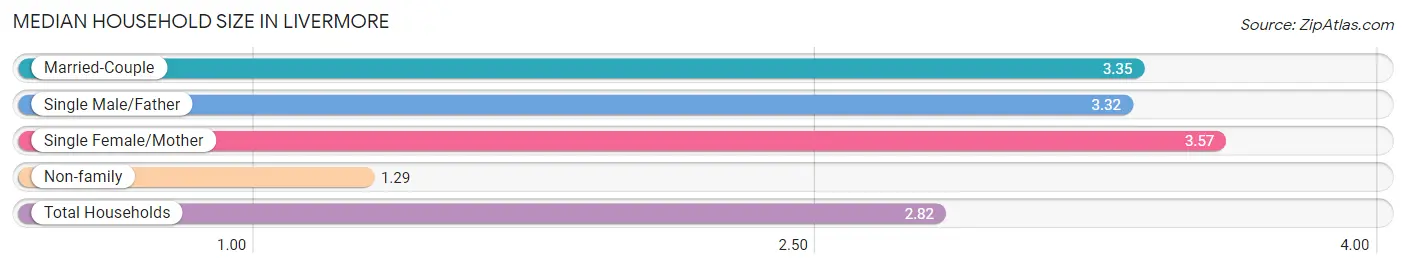
Median Household Size in Livermore
The median household size in Livermore is 2.82 persons per household, with single female/mother households (2,400 | 7.8%) accounting for the largest median household size of 3.57 persons per household. non-family households (8,113 | 26.5%) represent the smallest median household size with 1.29 persons per household.
| Household Type | # Households | Household Size |
| Married-Couple | 19,107 (62.3%) | 3.35 |
| Single Male/Father | 1,046 (3.4%) | 3.32 |
| Single Female/Mother | 2,400 (7.8%) | 3.57 |
| Non-family | 8,113 (26.5%) | 1.29 |
| Total Households | 30,666 (100.0%) | 2.82 |
Household Size by Marriage Status in Livermore
Out of a total of 30,666 households in Livermore, 22,553 (73.5%) are family households, while 8,113 (26.5%) are nonfamily households. The most numerous type of family households are 2-person households, comprising 8,182, and the most common type of nonfamily households are 1-person households, comprising 6,285.
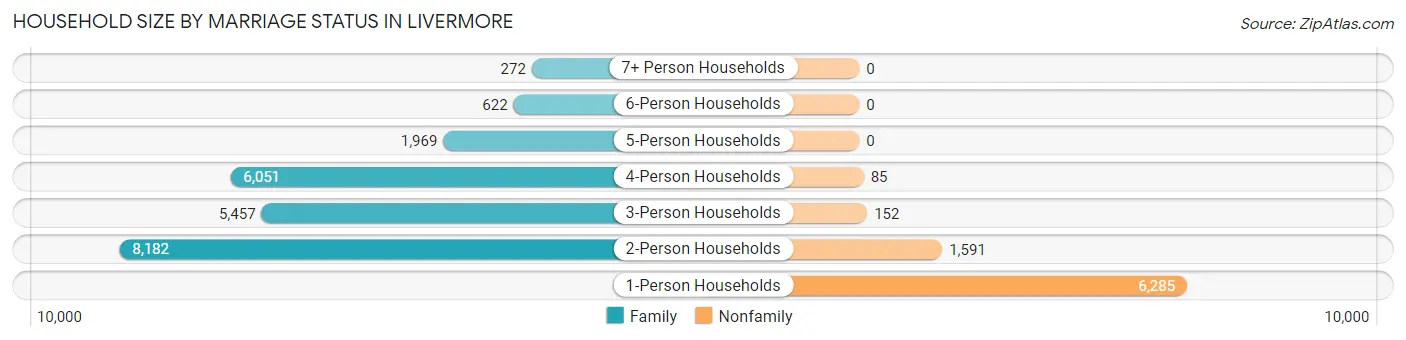
| Household Size | Family Households | Nonfamily Households |
| 1-Person Households | - | 6,285 (20.5%) |
| 2-Person Households | 8,182 (26.7%) | 1,591 (5.2%) |
| 3-Person Households | 5,457 (17.8%) | 152 (0.5%) |
| 4-Person Households | 6,051 (19.7%) | 85 (0.3%) |
| 5-Person Households | 1,969 (6.4%) | 0 (0.0%) |
| 6-Person Households | 622 (2.0%) | 0 (0.0%) |
| 7+ Person Households | 272 (0.9%) | 0 (0.0%) |
| Total | 22,553 (73.5%) | 8,113 (26.5%) |
Female Fertility in Livermore
Fertility by Age in Livermore
Average fertility rate in Livermore is 51.0 births per 1,000 women. Women in the age bracket of 20 to 34 years have the highest fertility rate with 107.0 births per 1,000 women. Women in the age bracket of 20 to 34 years acount for 77.9% of all women with births.
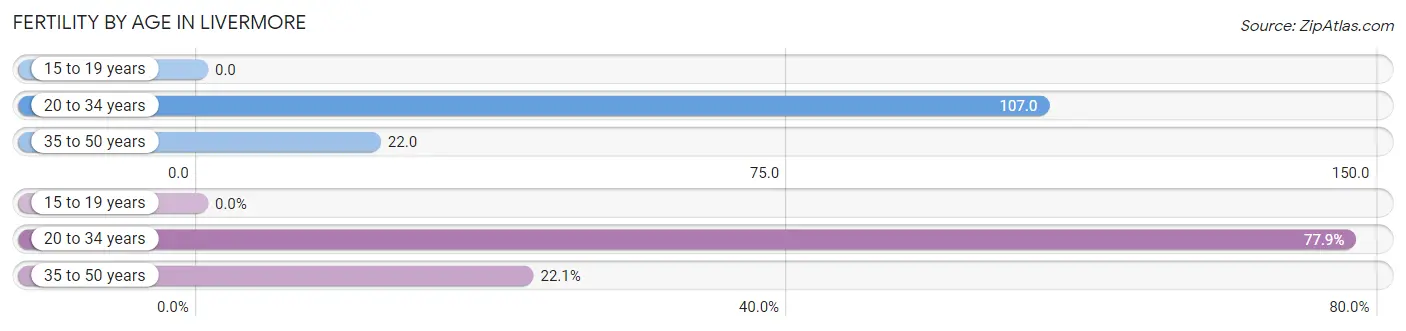
| Age Bracket | Women with Births | Births / 1,000 Women |
| 15 to 19 years | 0 (0.0%) | 0.0 |
| 20 to 34 years | 776 (77.9%) | 107.0 |
| 35 to 50 years | 220 (22.1%) | 22.0 |
| Total | 996 (100.0%) | 51.0 |
Fertility by Age by Marriage Status in Livermore
81.0% of women with births (996) in Livermore are married. The highest percentage of unmarried women with births falls into 20 to 34 years age bracket with 24.4% of them unmarried at the time of birth, while the lowest percentage of unmarried women with births belong to 35 to 50 years age bracket with 0.0% of them unmarried.
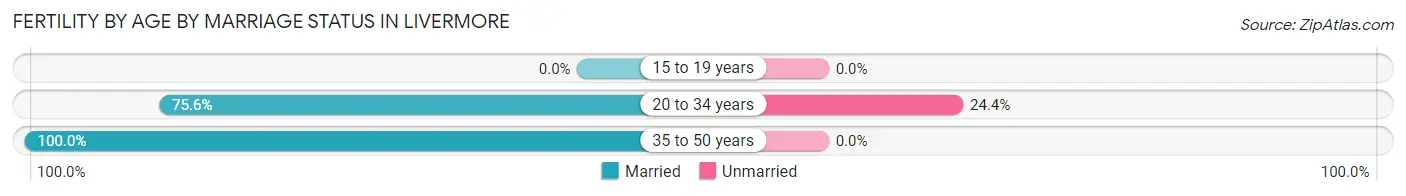
| Age Bracket | Married | Unmarried |
| 15 to 19 years | 0 (0.0%) | 0 (0.0%) |
| 20 to 34 years | 587 (75.6%) | 189 (24.4%) |
| 35 to 50 years | 220 (100.0%) | 0 (0.0%) |
| Total | 807 (81.0%) | 189 (19.0%) |
Fertility by Education in Livermore
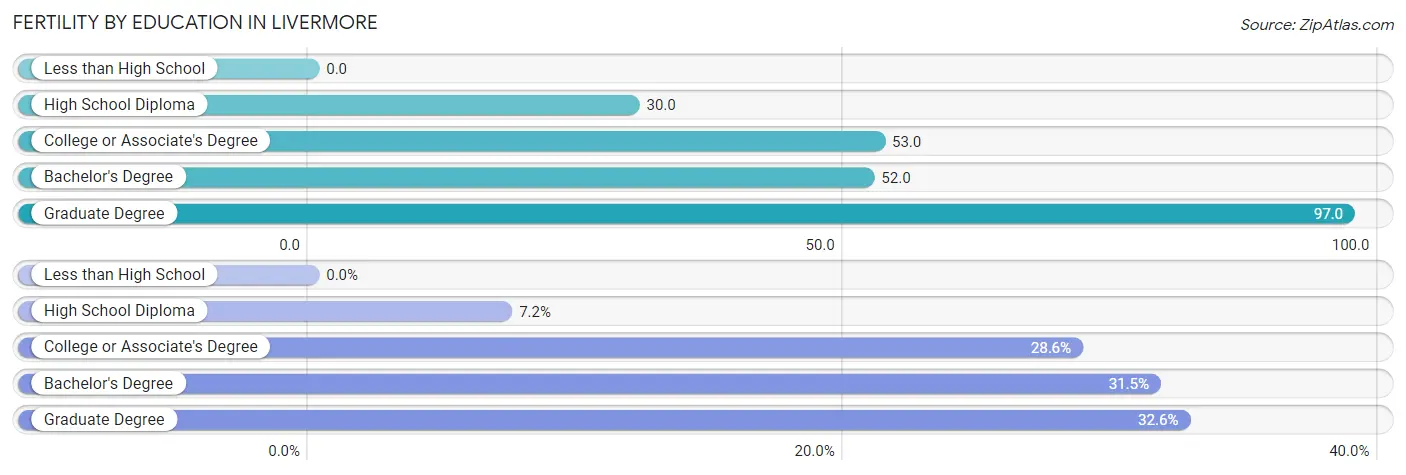
| Educational Attainment | Women with Births | Births / 1,000 Women |
| Less than High School | 0 (0.0%) | 0.0 |
| High School Diploma | 72 (7.2%) | 30.0 |
| College or Associate's Degree | 285 (28.6%) | 53.0 |
| Bachelor's Degree | 314 (31.5%) | 52.0 |
| Graduate Degree | 325 (32.6%) | 97.0 |
| Total | 996 (100.0%) | 51.0 |
Fertility by Education by Marriage Status in Livermore
19.0% of women with births in Livermore are unmarried. Women with the educational attainment of bachelor's degree are most likely to be married with 95.2% of them married at childbirth, while women with the educational attainment of high school diploma are least likely to be married with 66.7% of them unmarried at childbirth.
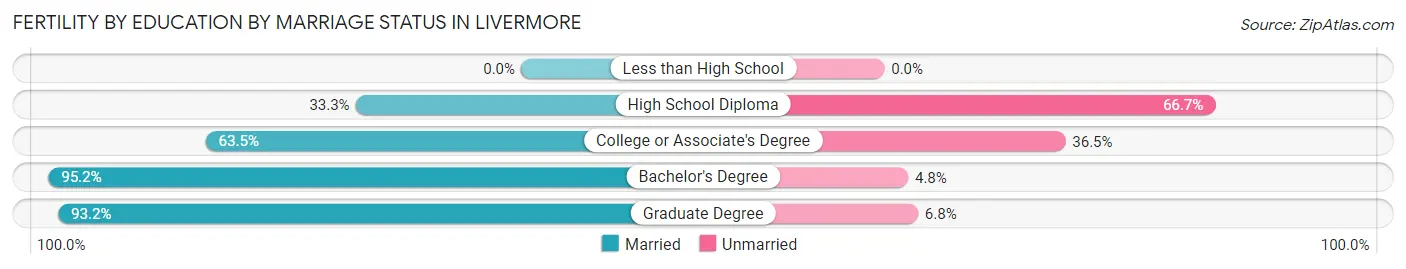
| Educational Attainment | Married | Unmarried |
| Less than High School | 0 (0.0%) | 0 (0.0%) |
| High School Diploma | 24 (33.3%) | 48 (66.7%) |
| College or Associate's Degree | 181 (63.5%) | 104 (36.5%) |
| Bachelor's Degree | 299 (95.2%) | 15 (4.8%) |
| Graduate Degree | 303 (93.2%) | 22 (6.8%) |
| Total | 807 (81.0%) | 189 (19.0%) |
Employment Characteristics in Livermore
Employment by Class of Employer in Livermore
Among the 45,680 employed individuals in Livermore, private company employees (30,004 | 65.7%), local government employees (4,562 | 10.0%), and not-for-profit organizations (3,111 | 6.8%) make up the most common classes of employment.
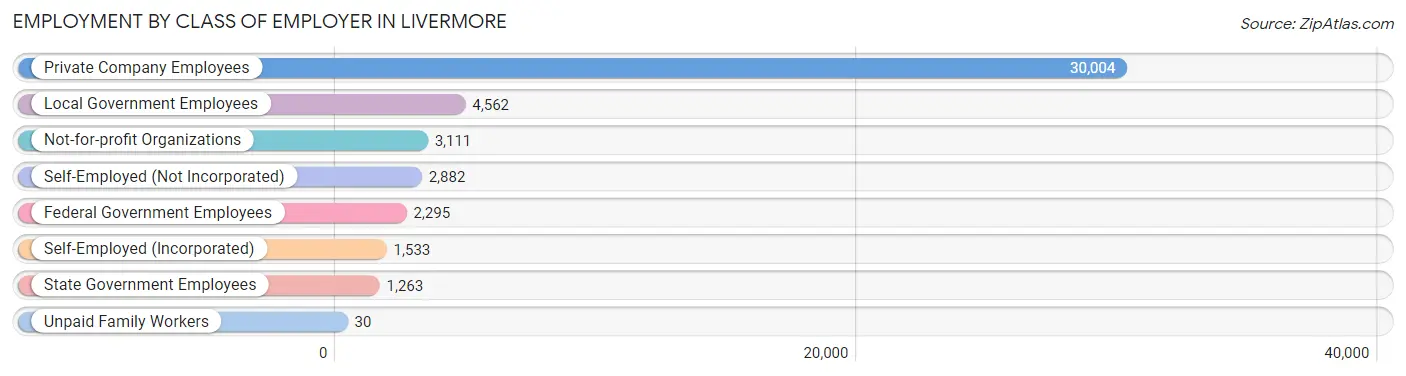
| Employer Class | # Employees | % Employees |
| Private Company Employees | 30,004 | 65.7% |
| Self-Employed (Incorporated) | 1,533 | 3.4% |
| Self-Employed (Not Incorporated) | 2,882 | 6.3% |
| Not-for-profit Organizations | 3,111 | 6.8% |
| Local Government Employees | 4,562 | 10.0% |
| State Government Employees | 1,263 | 2.8% |
| Federal Government Employees | 2,295 | 5.0% |
| Unpaid Family Workers | 30 | 0.1% |
| Total | 45,680 | 100.0% |
Employment Status by Age in Livermore
According to the labor force statistics for Livermore, out of the total population over 16 years of age (69,547), 69.8% or 48,544 individuals are in the labor force, with 3.3% or 1,602 of them unemployed. The age group with the highest labor force participation rate is 30 to 34 years, with 87.5% or 5,891 individuals in the labor force. Within the labor force, the 16 to 19 years age range has the highest percentage of unemployed individuals, with 8.4% or 165 of them being unemployed.
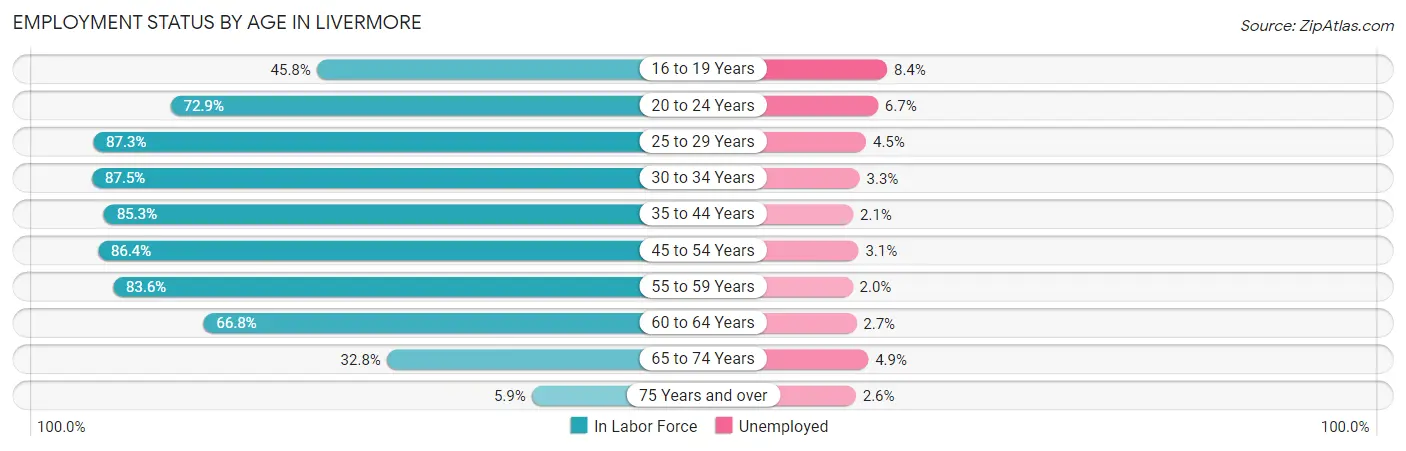
| Age Bracket | In Labor Force | Unemployed |
| 16 to 19 Years | 1,959 (45.8%) | 165 (8.4%) |
| 20 to 24 Years | 2,650 (72.9%) | 178 (6.7%) |
| 25 to 29 Years | 3,895 (87.3%) | 175 (4.5%) |
| 30 to 34 Years | 5,891 (87.5%) | 194 (3.3%) |
| 35 to 44 Years | 10,769 (85.3%) | 226 (2.1%) |
| 45 to 54 Years | 11,234 (86.4%) | 348 (3.1%) |
| 55 to 59 Years | 6,072 (83.6%) | 121 (2.0%) |
| 60 to 64 Years | 3,357 (66.8%) | 91 (2.7%) |
| 65 to 74 Years | 2,384 (32.8%) | 117 (4.9%) |
| 75 Years and over | 310 (5.9%) | 8 (2.6%) |
| Total | 48,544 (69.8%) | 1,602 (3.3%) |
Employment Status by Educational Attainment in Livermore
According to labor force statistics for Livermore, 83.9% of individuals (41,204) out of the total population between 25 and 64 years of age (49,111) are in the labor force, with 2.8% or 1,154 of them being unemployed. The group with the highest labor force participation rate are those with the educational attainment of bachelor's degree or higher, with 88.9% or 22,435 individuals in the labor force. Within the labor force, individuals with high school diploma education have the highest percentage of unemployment, with 5.4% or 271 of them being unemployed.
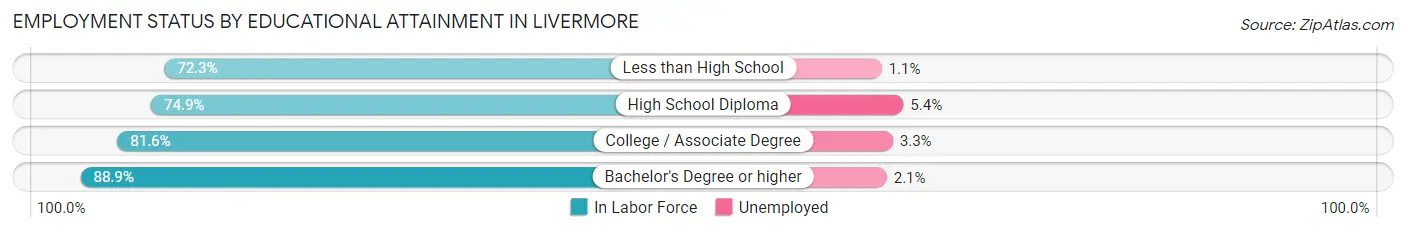
| Educational Attainment | In Labor Force | Unemployed |
| Less than High School | 1,940 (72.3%) | 30 (1.1%) |
| High School Diploma | 5,027 (74.9%) | 362 (5.4%) |
| College / Associate Degree | 11,816 (81.6%) | 478 (3.3%) |
| Bachelor's Degree or higher | 22,435 (88.9%) | 530 (2.1%) |
| Total | 41,204 (83.9%) | 1,375 (2.8%) |
Employment Occupations by Sex in Livermore
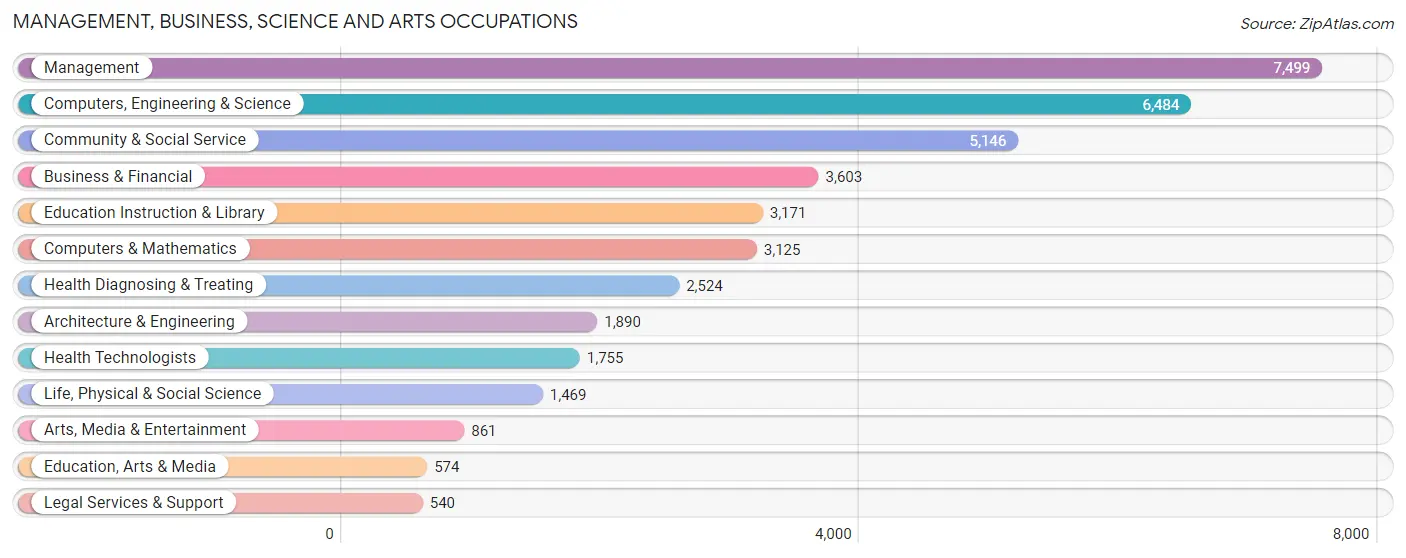
Management, Business, Science and Arts Occupations
The most common Management, Business, Science and Arts occupations in Livermore are Management (7,499 | 16.0%), Computers, Engineering & Science (6,484 | 13.8%), Community & Social Service (5,146 | 11.0%), Business & Financial (3,603 | 7.7%), and Education Instruction & Library (3,171 | 6.8%).
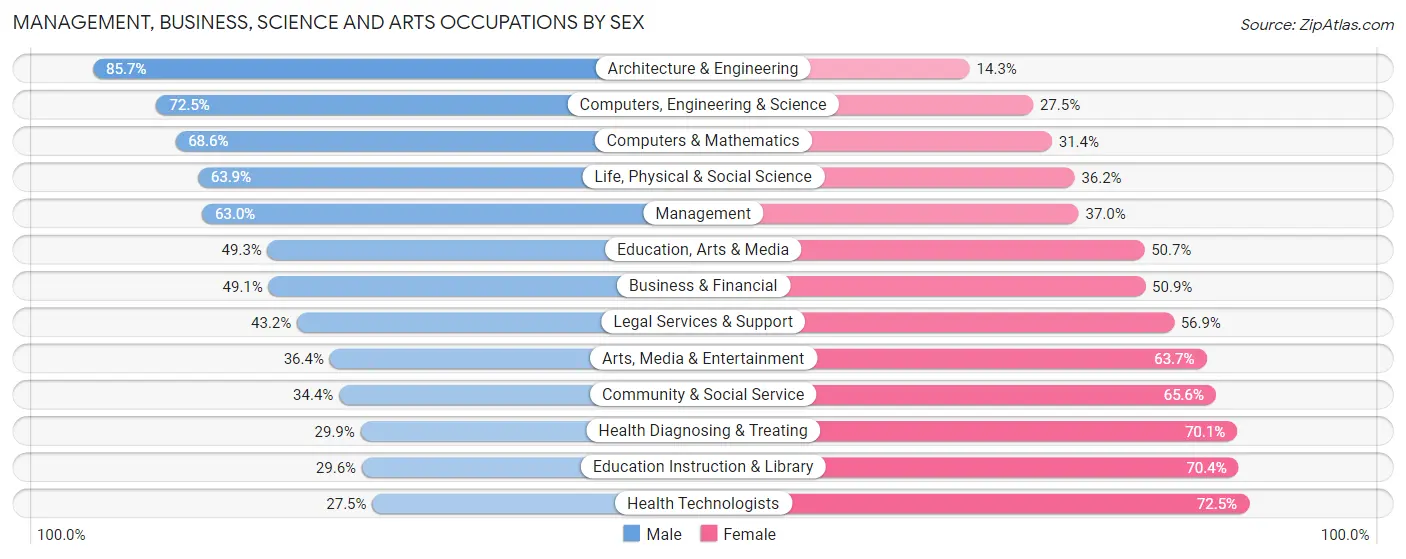
Management, Business, Science and Arts Occupations by Sex
Within the Management, Business, Science and Arts occupations in Livermore, the most male-oriented occupations are Architecture & Engineering (85.7%), Computers, Engineering & Science (72.5%), and Computers & Mathematics (68.6%), while the most female-oriented occupations are Health Technologists (72.5%), Education Instruction & Library (70.4%), and Health Diagnosing & Treating (70.1%).
| Occupation | Male | Female |
| Management | 4,724 (63.0%) | 2,775 (37.0%) |
| Business & Financial | 1,769 (49.1%) | 1,834 (50.9%) |
| Computers, Engineering & Science | 4,701 (72.5%) | 1,783 (27.5%) |
| Computers & Mathematics | 2,143 (68.6%) | 982 (31.4%) |
| Architecture & Engineering | 1,620 (85.7%) | 270 (14.3%) |
| Life, Physical & Social Science | 938 (63.8%) | 531 (36.1%) |
| Community & Social Service | 1,769 (34.4%) | 3,377 (65.6%) |
| Education, Arts & Media | 283 (49.3%) | 291 (50.7%) |
| Legal Services & Support | 233 (43.1%) | 307 (56.9%) |
| Education Instruction & Library | 940 (29.6%) | 2,231 (70.4%) |
| Arts, Media & Entertainment | 313 (36.3%) | 548 (63.6%) |
| Health Diagnosing & Treating | 755 (29.9%) | 1,769 (70.1%) |
| Health Technologists | 482 (27.5%) | 1,273 (72.5%) |
| Total (Category) | 13,718 (54.3%) | 11,538 (45.7%) |
| Total (Overall) | 25,330 (54.0%) | 21,532 (46.0%) |
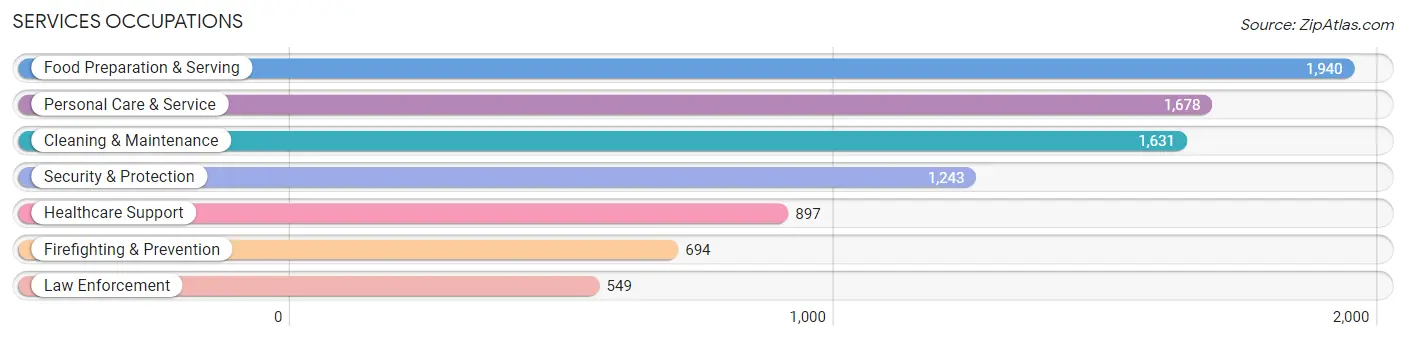
Services Occupations
The most common Services occupations in Livermore are Food Preparation & Serving (1,940 | 4.1%), Personal Care & Service (1,678 | 3.6%), Cleaning & Maintenance (1,631 | 3.5%), Security & Protection (1,243 | 2.6%), and Healthcare Support (897 | 1.9%).
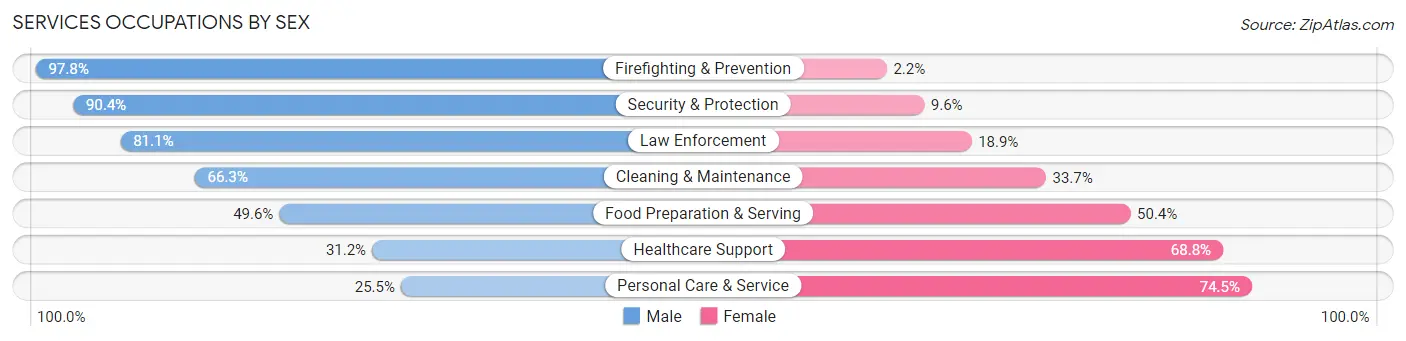
Services Occupations by Sex
Within the Services occupations in Livermore, the most male-oriented occupations are Firefighting & Prevention (97.8%), Security & Protection (90.4%), and Law Enforcement (81.1%), while the most female-oriented occupations are Personal Care & Service (74.5%), Healthcare Support (68.8%), and Food Preparation & Serving (50.4%).
| Occupation | Male | Female |
| Healthcare Support | 280 (31.2%) | 617 (68.8%) |
| Security & Protection | 1,124 (90.4%) | 119 (9.6%) |
| Firefighting & Prevention | 679 (97.8%) | 15 (2.2%) |
| Law Enforcement | 445 (81.1%) | 104 (18.9%) |
| Food Preparation & Serving | 962 (49.6%) | 978 (50.4%) |
| Cleaning & Maintenance | 1,082 (66.3%) | 549 (33.7%) |
| Personal Care & Service | 428 (25.5%) | 1,250 (74.5%) |
| Total (Category) | 3,876 (52.5%) | 3,513 (47.5%) |
| Total (Overall) | 25,330 (54.0%) | 21,532 (46.0%) |
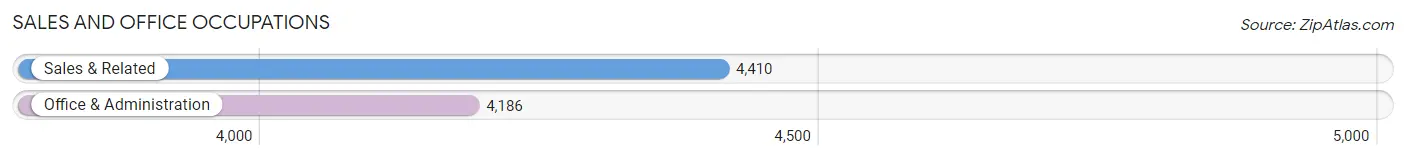
Sales and Office Occupations
The most common Sales and Office occupations in Livermore are Sales & Related (4,410 | 9.4%), and Office & Administration (4,186 | 8.9%).
Sales and Office Occupations by Sex
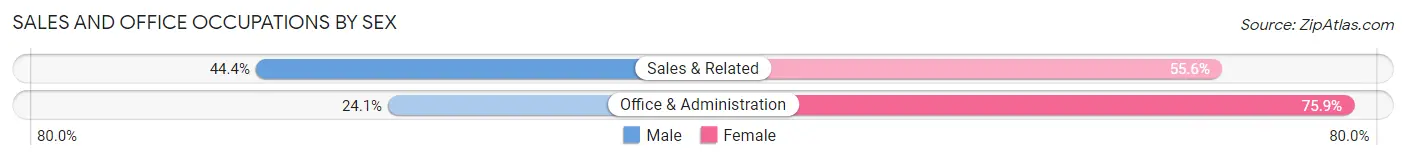
| Occupation | Male | Female |
| Sales & Related | 1,960 (44.4%) | 2,450 (55.6%) |
| Office & Administration | 1,009 (24.1%) | 3,177 (75.9%) |
| Total (Category) | 2,969 (34.5%) | 5,627 (65.5%) |
| Total (Overall) | 25,330 (54.0%) | 21,532 (46.0%) |
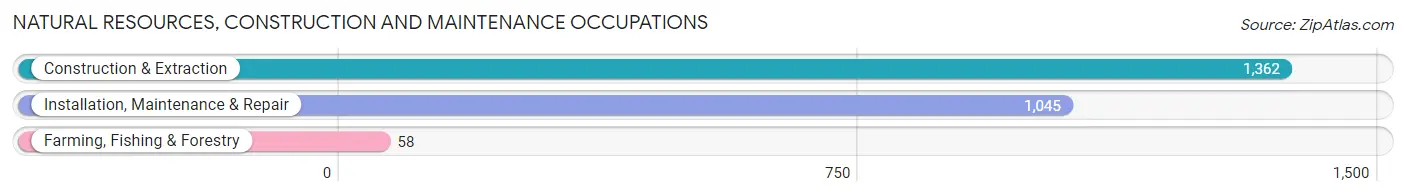
Natural Resources, Construction and Maintenance Occupations
The most common Natural Resources, Construction and Maintenance occupations in Livermore are Construction & Extraction (1,362 | 2.9%), Installation, Maintenance & Repair (1,045 | 2.2%), and Farming, Fishing & Forestry (58 | 0.1%).
Natural Resources, Construction and Maintenance Occupations by Sex
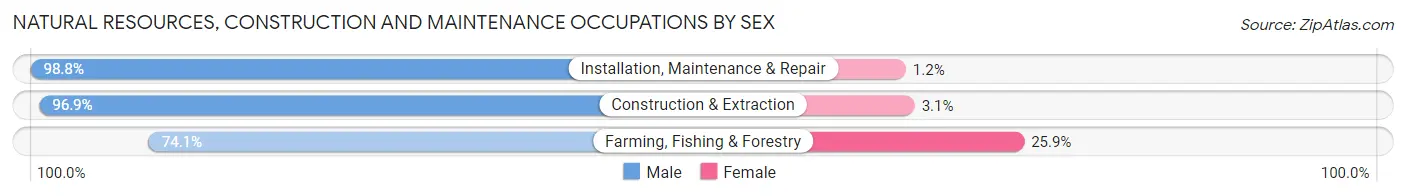
| Occupation | Male | Female |
| Farming, Fishing & Forestry | 43 (74.1%) | 15 (25.9%) |
| Construction & Extraction | 1,320 (96.9%) | 42 (3.1%) |
| Installation, Maintenance & Repair | 1,032 (98.8%) | 13 (1.2%) |
| Total (Category) | 2,395 (97.2%) | 70 (2.8%) |
| Total (Overall) | 25,330 (54.0%) | 21,532 (46.0%) |
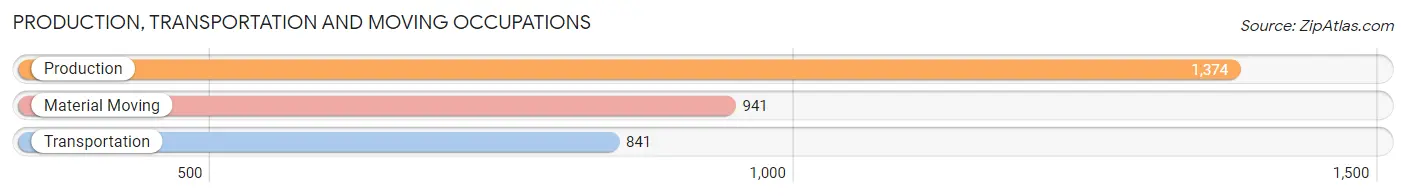
Production, Transportation and Moving Occupations
The most common Production, Transportation and Moving occupations in Livermore are Production (1,374 | 2.9%), Material Moving (941 | 2.0%), and Transportation (841 | 1.8%).
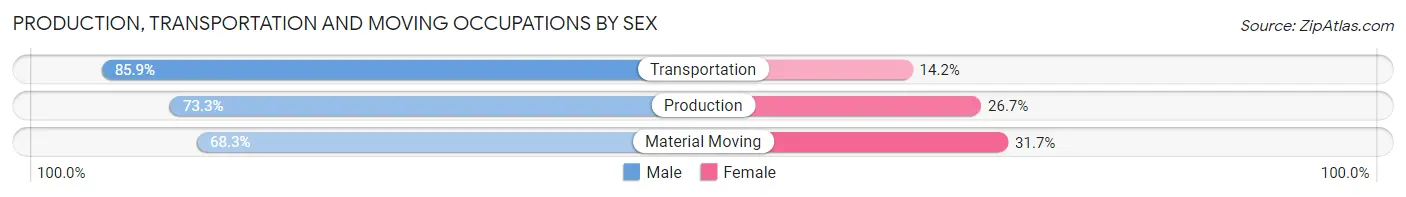
Production, Transportation and Moving Occupations by Sex
| Occupation | Male | Female |
| Production | 1,007 (73.3%) | 367 (26.7%) |
| Transportation | 722 (85.9%) | 119 (14.1%) |
| Material Moving | 643 (68.3%) | 298 (31.7%) |
| Total (Category) | 2,372 (75.2%) | 784 (24.8%) |
| Total (Overall) | 25,330 (54.0%) | 21,532 (46.0%) |
Employment Industries by Sex in Livermore
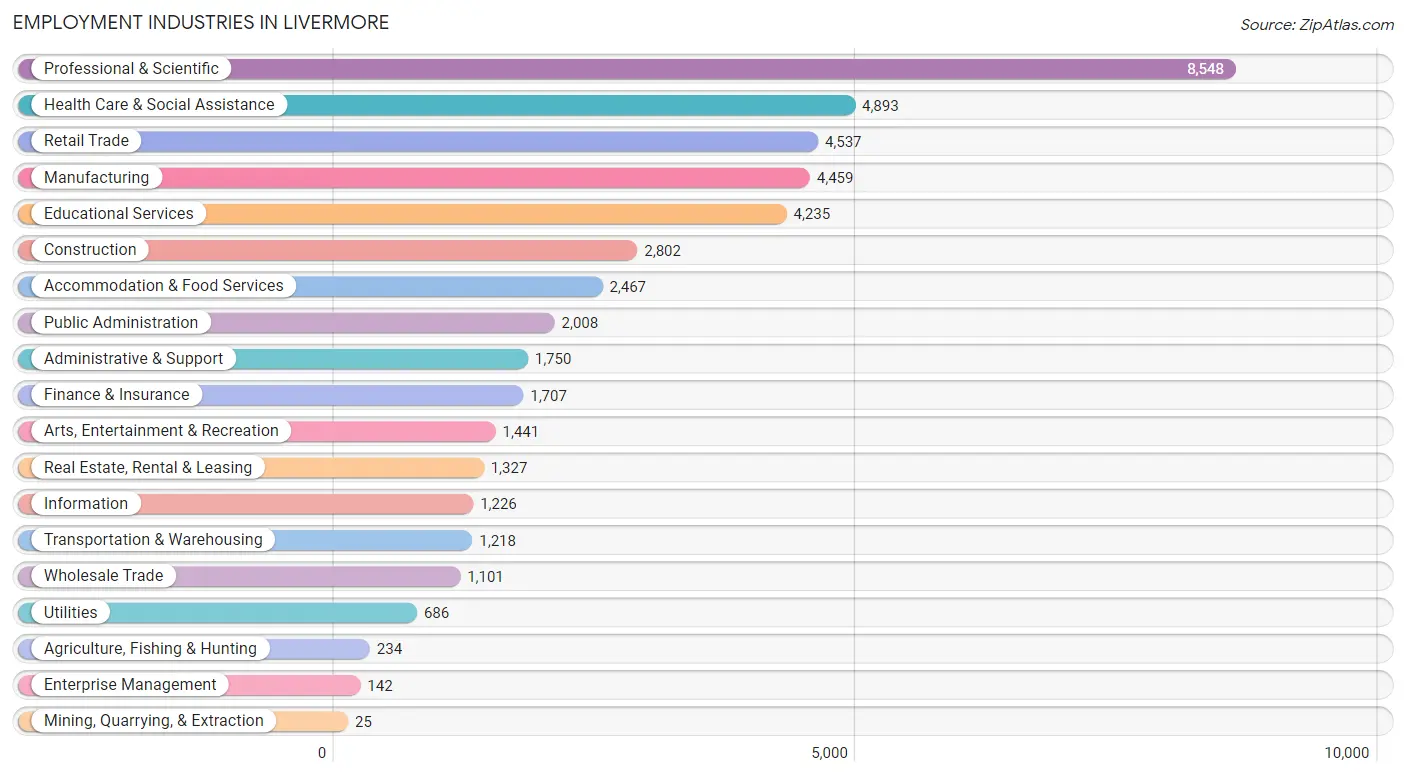
Employment Industries in Livermore
The major employment industries in Livermore include Professional & Scientific (8,548 | 18.2%), Health Care & Social Assistance (4,893 | 10.4%), Retail Trade (4,537 | 9.7%), Manufacturing (4,459 | 9.5%), and Educational Services (4,235 | 9.0%).
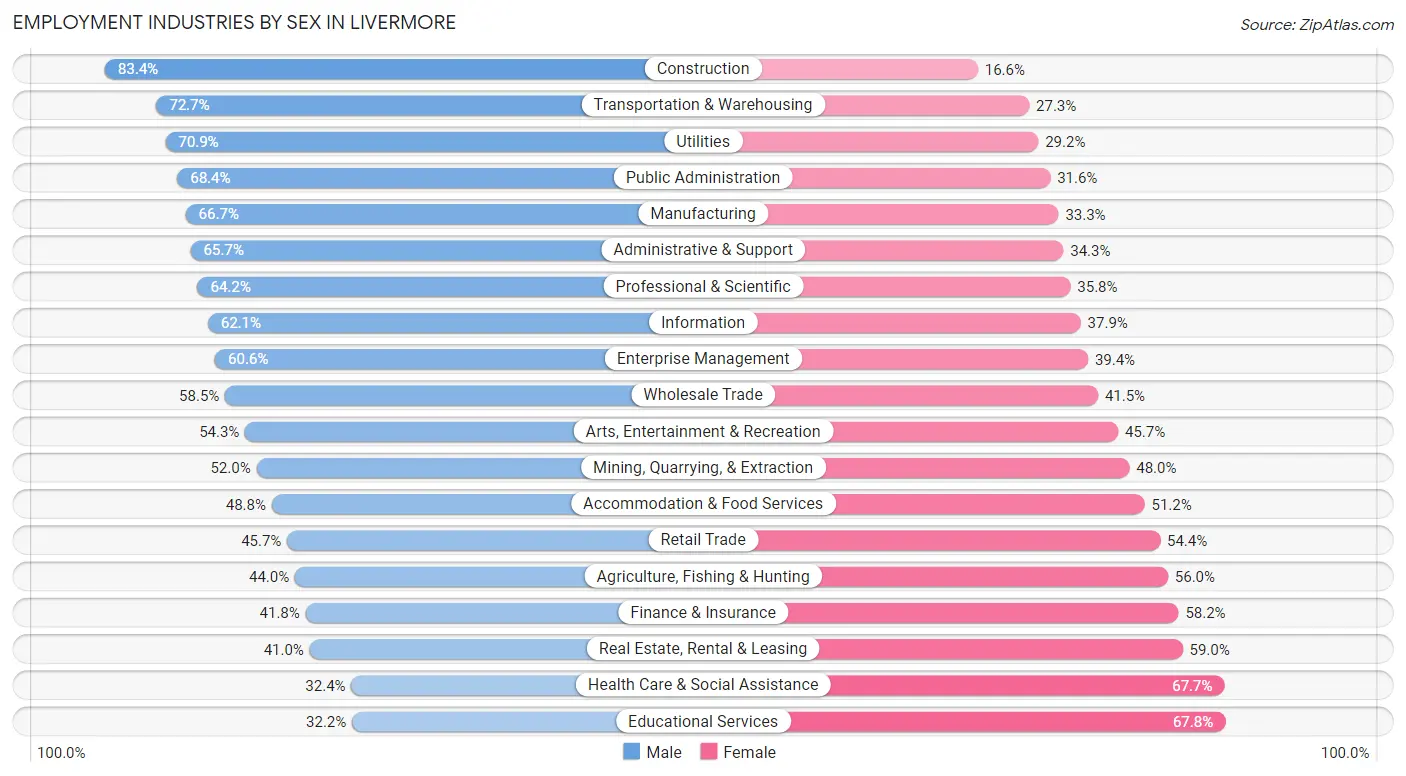
Employment Industries by Sex in Livermore
The Livermore industries that see more men than women are Construction (83.4%), Transportation & Warehousing (72.7%), and Utilities (70.9%), whereas the industries that tend to have a higher number of women are Educational Services (67.8%), Health Care & Social Assistance (67.6%), and Real Estate, Rental & Leasing (59.0%).
| Industry | Male | Female |
| Agriculture, Fishing & Hunting | 103 (44.0%) | 131 (56.0%) |
| Mining, Quarrying, & Extraction | 13 (52.0%) | 12 (48.0%) |
| Construction | 2,336 (83.4%) | 466 (16.6%) |
| Manufacturing | 2,973 (66.7%) | 1,486 (33.3%) |
| Wholesale Trade | 644 (58.5%) | 457 (41.5%) |
| Retail Trade | 2,071 (45.7%) | 2,466 (54.3%) |
| Transportation & Warehousing | 886 (72.7%) | 332 (27.3%) |
| Utilities | 486 (70.9%) | 200 (29.1%) |
| Information | 761 (62.1%) | 465 (37.9%) |
| Finance & Insurance | 714 (41.8%) | 993 (58.2%) |
| Real Estate, Rental & Leasing | 544 (41.0%) | 783 (59.0%) |
| Professional & Scientific | 5,488 (64.2%) | 3,060 (35.8%) |
| Enterprise Management | 86 (60.6%) | 56 (39.4%) |
| Administrative & Support | 1,149 (65.7%) | 601 (34.3%) |
| Educational Services | 1,364 (32.2%) | 2,871 (67.8%) |
| Health Care & Social Assistance | 1,583 (32.4%) | 3,310 (67.6%) |
| Arts, Entertainment & Recreation | 783 (54.3%) | 658 (45.7%) |
| Accommodation & Food Services | 1,205 (48.8%) | 1,262 (51.2%) |
| Public Administration | 1,373 (68.4%) | 635 (31.6%) |
| Total | 25,330 (54.0%) | 21,532 (46.0%) |
Education in Livermore
School Enrollment in Livermore
The most common levels of schooling among the 21,086 students in Livermore are high school (4,481 | 21.2%), middle school (4,375 | 20.7%), and elementary school (4,218 | 20.0%).
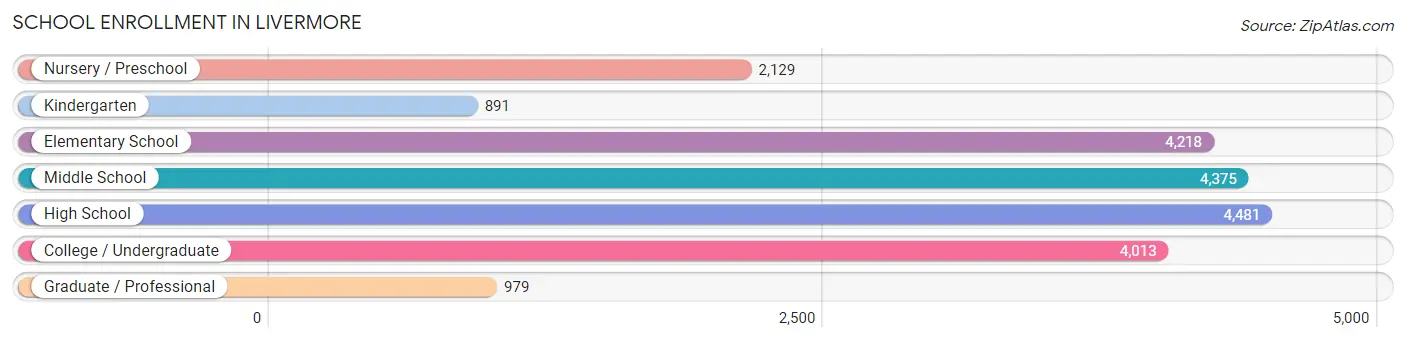
| School Level | # Students | % Students |
| Nursery / Preschool | 2,129 | 10.1% |
| Kindergarten | 891 | 4.2% |
| Elementary School | 4,218 | 20.0% |
| Middle School | 4,375 | 20.7% |
| High School | 4,481 | 21.2% |
| College / Undergraduate | 4,013 | 19.0% |
| Graduate / Professional | 979 | 4.6% |
| Total | 21,086 | 100.0% |
School Enrollment by Age by Funding Source in Livermore
Out of a total of 21,086 students who are enrolled in schools in Livermore, 3,247 (15.4%) attend a private institution, while the remaining 17,839 (84.6%) are enrolled in public schools. The age group of 3 to 4 year olds has the highest likelihood of being enrolled in private schools, with 978 (61.7% in the age bracket) enrolled. Conversely, the age group of 15 to 17 year olds has the lowest likelihood of being enrolled in a private school, with 2,859 (95.5% in the age bracket) attending a public institution.
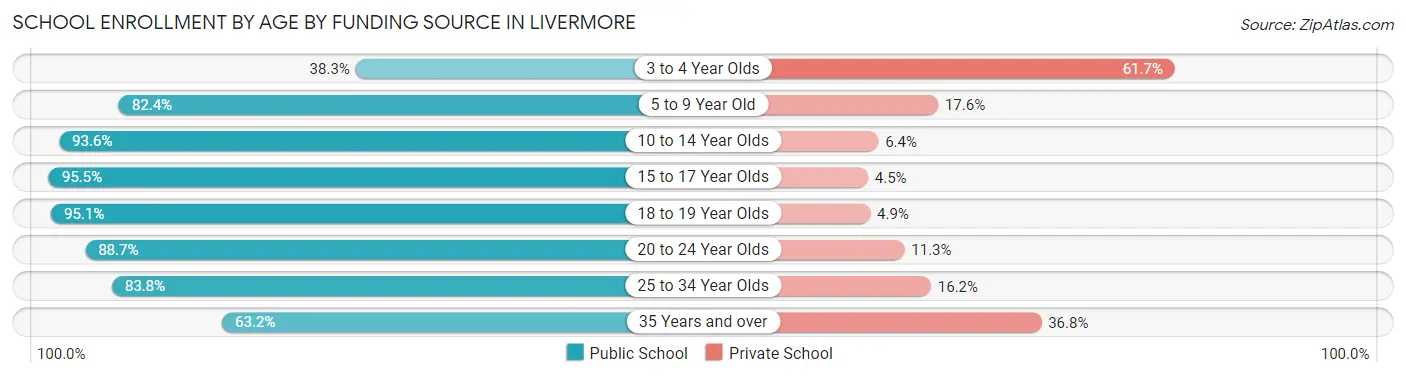
| Age Bracket | Public School | Private School |
| 3 to 4 Year Olds | 608 (38.3%) | 978 (61.7%) |
| 5 to 9 Year Old | 4,372 (82.4%) | 932 (17.6%) |
| 10 to 14 Year Olds | 5,149 (93.6%) | 354 (6.4%) |
| 15 to 17 Year Olds | 2,859 (95.5%) | 135 (4.5%) |
| 18 to 19 Year Olds | 1,662 (95.1%) | 86 (4.9%) |
| 20 to 24 Year Olds | 1,444 (88.7%) | 184 (11.3%) |
| 25 to 34 Year Olds | 1,140 (83.8%) | 221 (16.2%) |
| 35 Years and over | 608 (63.2%) | 354 (36.8%) |
| Total | 17,839 (84.6%) | 3,247 (15.4%) |
Educational Attainment by Field of Study in Livermore
Business (5,714 | 17.9%), engineering (4,720 | 14.8%), science & technology (2,537 | 8.0%), computers & mathematics (2,465 | 7.7%), and social sciences (2,402 | 7.5%) are the most common fields of study among 31,910 individuals in Livermore who have obtained a bachelor's degree or higher.
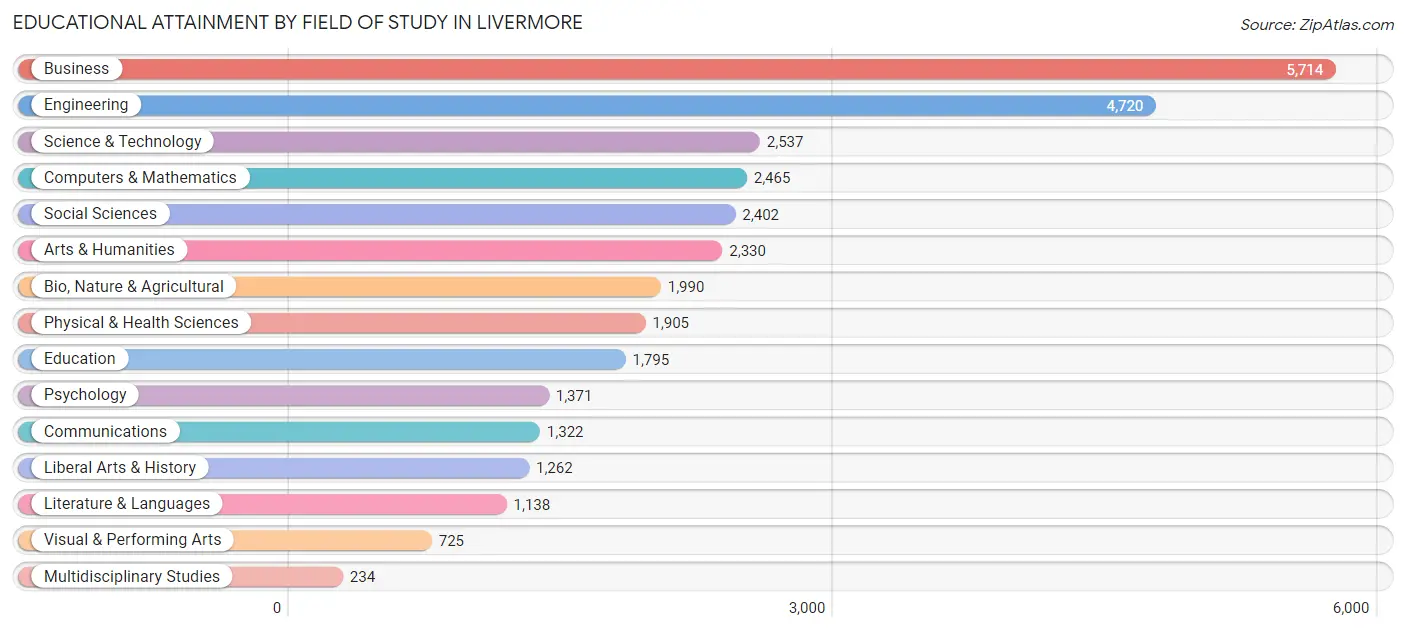
| Field of Study | # Graduates | % Graduates |
| Computers & Mathematics | 2,465 | 7.7% |
| Bio, Nature & Agricultural | 1,990 | 6.2% |
| Physical & Health Sciences | 1,905 | 6.0% |
| Psychology | 1,371 | 4.3% |
| Social Sciences | 2,402 | 7.5% |
| Engineering | 4,720 | 14.8% |
| Multidisciplinary Studies | 234 | 0.7% |
| Science & Technology | 2,537 | 8.0% |
| Business | 5,714 | 17.9% |
| Education | 1,795 | 5.6% |
| Literature & Languages | 1,138 | 3.6% |
| Liberal Arts & History | 1,262 | 4.0% |
| Visual & Performing Arts | 725 | 2.3% |
| Communications | 1,322 | 4.1% |
| Arts & Humanities | 2,330 | 7.3% |
| Total | 31,910 | 100.0% |
Transportation & Commute in Livermore
Vehicle Availability by Sex in Livermore
The most prevalent vehicle ownership categories in Livermore are males with 2 vehicles (9,960, accounting for 40.1%) and females with 2 vehicles (7,943, making up 48.0%).
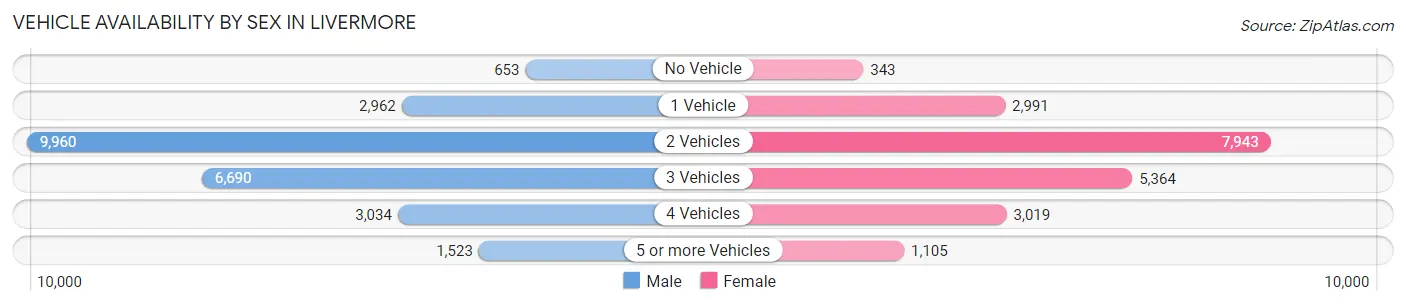
| Vehicles Available | Male | Female |
| No Vehicle | 653 (2.6%) | 343 (1.7%) |
| 1 Vehicle | 2,962 (11.9%) | 2,991 (14.4%) |
| 2 Vehicles | 9,960 (40.1%) | 7,943 (38.3%) |
| 3 Vehicles | 6,690 (27.0%) | 5,364 (25.8%) |
| 4 Vehicles | 3,034 (12.2%) | 3,019 (14.5%) |
| 5 or more Vehicles | 1,523 (6.1%) | 1,105 (5.3%) |
| Total | 24,822 (100.0%) | 20,765 (100.0%) |
Commute Time in Livermore
The most frequently occuring commute durations in Livermore are 10 to 14 minutes (5,635 commuters, 15.1%), 15 to 19 minutes (5,062 commuters, 13.5%), and 20 to 24 minutes (4,138 commuters, 11.1%).
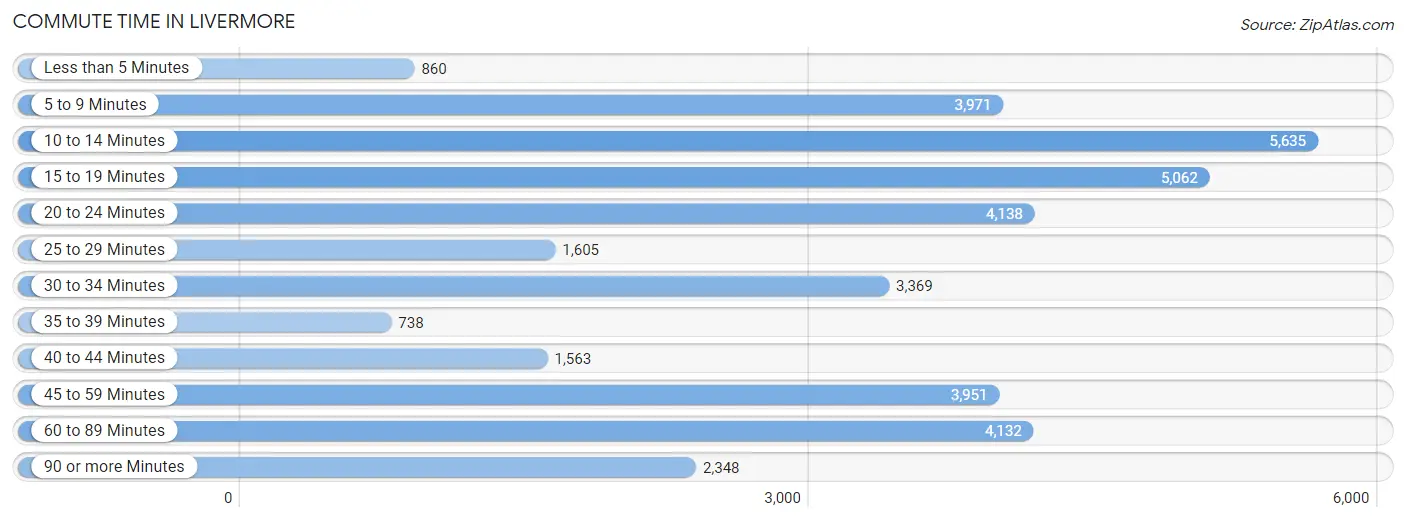
| Commute Time | # Commuters | % Commuters |
| Less than 5 Minutes | 860 | 2.3% |
| 5 to 9 Minutes | 3,971 | 10.6% |
| 10 to 14 Minutes | 5,635 | 15.1% |
| 15 to 19 Minutes | 5,062 | 13.5% |
| 20 to 24 Minutes | 4,138 | 11.1% |
| 25 to 29 Minutes | 1,605 | 4.3% |
| 30 to 34 Minutes | 3,369 | 9.0% |
| 35 to 39 Minutes | 738 | 2.0% |
| 40 to 44 Minutes | 1,563 | 4.2% |
| 45 to 59 Minutes | 3,951 | 10.6% |
| 60 to 89 Minutes | 4,132 | 11.1% |
| 90 or more Minutes | 2,348 | 6.3% |
Commute Time by Sex in Livermore
The most common commute times in Livermore are 10 to 14 minutes (2,982 commuters, 14.3%) for males and 15 to 19 minutes (2,797 commuters, 16.9%) for females.
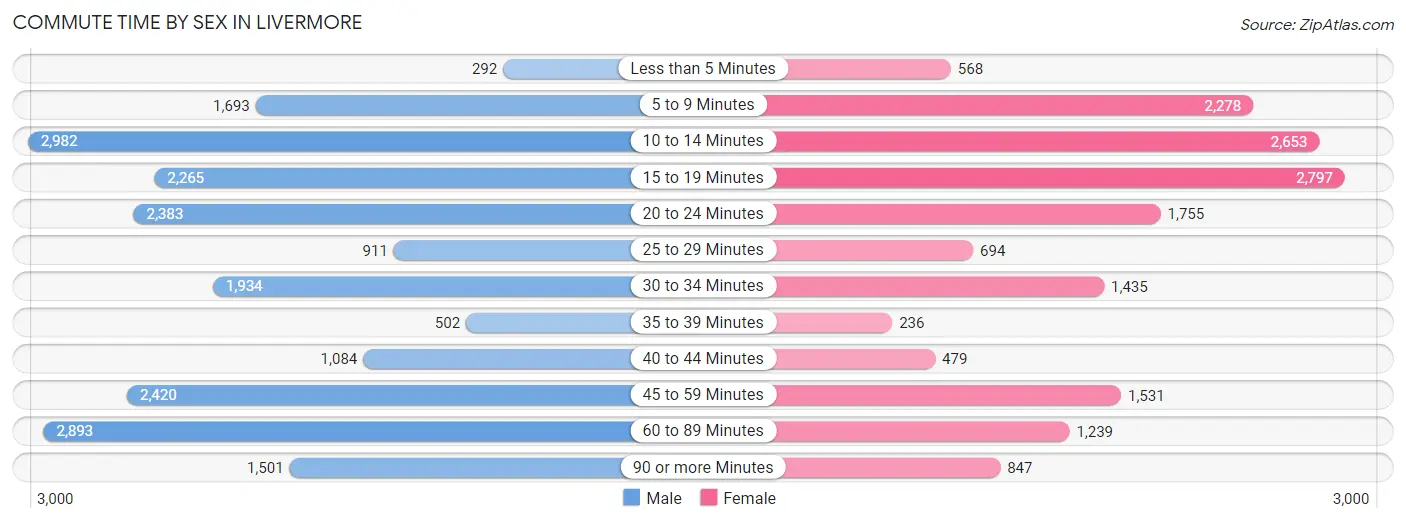
| Commute Time | Male | Female |
| Less than 5 Minutes | 292 (1.4%) | 568 (3.4%) |
| 5 to 9 Minutes | 1,693 (8.1%) | 2,278 (13.8%) |
| 10 to 14 Minutes | 2,982 (14.3%) | 2,653 (16.1%) |
| 15 to 19 Minutes | 2,265 (10.9%) | 2,797 (16.9%) |
| 20 to 24 Minutes | 2,383 (11.4%) | 1,755 (10.6%) |
| 25 to 29 Minutes | 911 (4.4%) | 694 (4.2%) |
| 30 to 34 Minutes | 1,934 (9.3%) | 1,435 (8.7%) |
| 35 to 39 Minutes | 502 (2.4%) | 236 (1.4%) |
| 40 to 44 Minutes | 1,084 (5.2%) | 479 (2.9%) |
| 45 to 59 Minutes | 2,420 (11.6%) | 1,531 (9.3%) |
| 60 to 89 Minutes | 2,893 (13.9%) | 1,239 (7.5%) |
| 90 or more Minutes | 1,501 (7.2%) | 847 (5.1%) |
Time of Departure to Work by Sex in Livermore
The most frequent times of departure to work in Livermore are 7:30 AM to 7:59 AM (2,525, 12.1%) for males and 7:00 AM to 7:29 AM (2,492, 15.1%) for females.
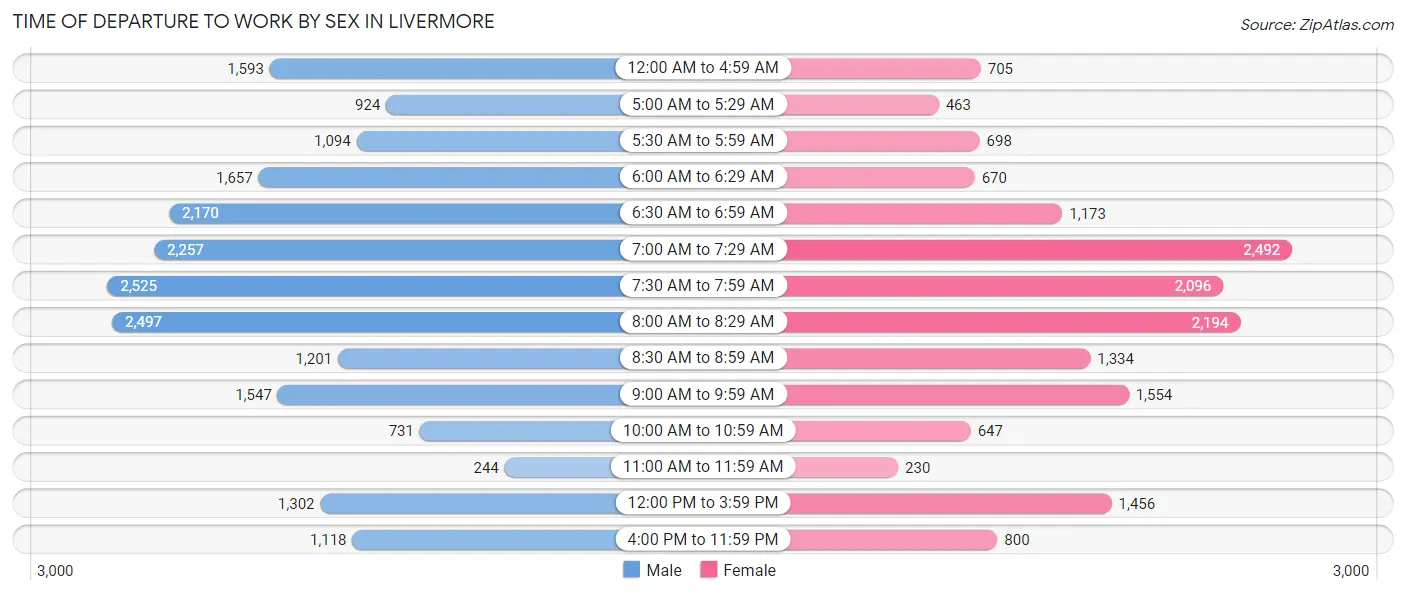
| Time of Departure | Male | Female |
| 12:00 AM to 4:59 AM | 1,593 (7.6%) | 705 (4.3%) |
| 5:00 AM to 5:29 AM | 924 (4.4%) | 463 (2.8%) |
| 5:30 AM to 5:59 AM | 1,094 (5.2%) | 698 (4.2%) |
| 6:00 AM to 6:29 AM | 1,657 (7.9%) | 670 (4.1%) |
| 6:30 AM to 6:59 AM | 2,170 (10.4%) | 1,173 (7.1%) |
| 7:00 AM to 7:29 AM | 2,257 (10.8%) | 2,492 (15.1%) |
| 7:30 AM to 7:59 AM | 2,525 (12.1%) | 2,096 (12.7%) |
| 8:00 AM to 8:29 AM | 2,497 (12.0%) | 2,194 (13.3%) |
| 8:30 AM to 8:59 AM | 1,201 (5.8%) | 1,334 (8.1%) |
| 9:00 AM to 9:59 AM | 1,547 (7.4%) | 1,554 (9.4%) |
| 10:00 AM to 10:59 AM | 731 (3.5%) | 647 (3.9%) |
| 11:00 AM to 11:59 AM | 244 (1.2%) | 230 (1.4%) |
| 12:00 PM to 3:59 PM | 1,302 (6.2%) | 1,456 (8.8%) |
| 4:00 PM to 11:59 PM | 1,118 (5.4%) | 800 (4.8%) |
| Total | 20,860 (100.0%) | 16,512 (100.0%) |
Housing Occupancy in Livermore
Occupancy by Ownership in Livermore
Of the total 30,666 dwellings in Livermore, owner-occupied units account for 22,300 (72.7%), while renter-occupied units make up 8,366 (27.3%).
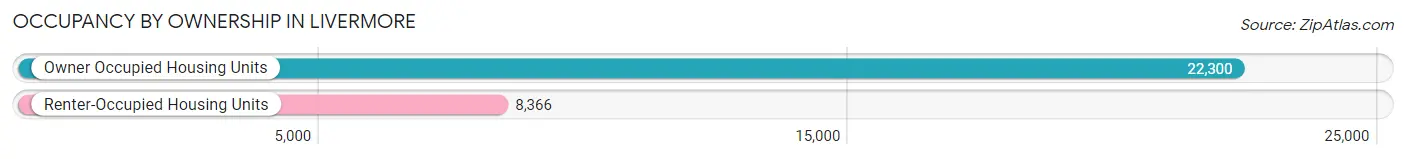
| Occupancy | # Housing Units | % Housing Units |
| Owner Occupied Housing Units | 22,300 | 72.7% |
| Renter-Occupied Housing Units | 8,366 | 27.3% |
| Total Occupied Housing Units | 30,666 | 100.0% |
Occupancy by Household Size in Livermore
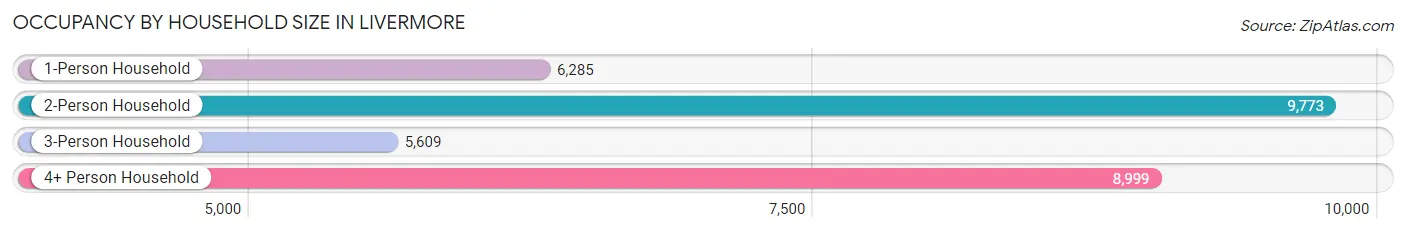
| Household Size | # Housing Units | % Housing Units |
| 1-Person Household | 6,285 | 20.5% |
| 2-Person Household | 9,773 | 31.9% |
| 3-Person Household | 5,609 | 18.3% |
| 4+ Person Household | 8,999 | 29.3% |
| Total Housing Units | 30,666 | 100.0% |
Occupancy by Ownership by Household Size in Livermore
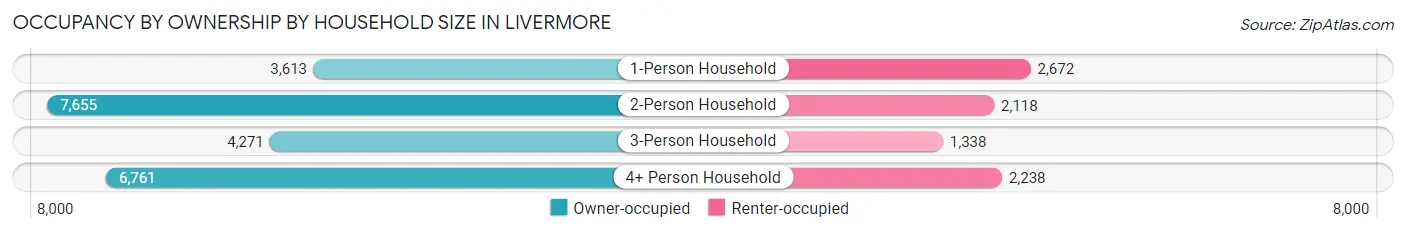
| Household Size | Owner-occupied | Renter-occupied |
| 1-Person Household | 3,613 (57.5%) | 2,672 (42.5%) |
| 2-Person Household | 7,655 (78.3%) | 2,118 (21.7%) |
| 3-Person Household | 4,271 (76.1%) | 1,338 (23.8%) |
| 4+ Person Household | 6,761 (75.1%) | 2,238 (24.9%) |
| Total Housing Units | 22,300 (72.7%) | 8,366 (27.3%) |
Occupancy by Educational Attainment in Livermore
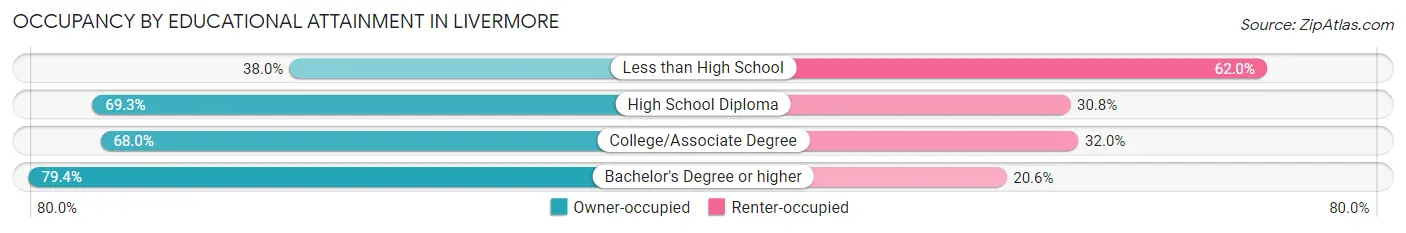
| Household Size | Owner-occupied | Renter-occupied |
| Less than High School | 571 (38.0%) | 930 (62.0%) |
| High School Diploma | 2,412 (69.3%) | 1,071 (30.7%) |
| College/Associate Degree | 6,343 (68.0%) | 2,990 (32.0%) |
| Bachelor's Degree or higher | 12,974 (79.4%) | 3,375 (20.6%) |
Occupancy by Age of Householder in Livermore
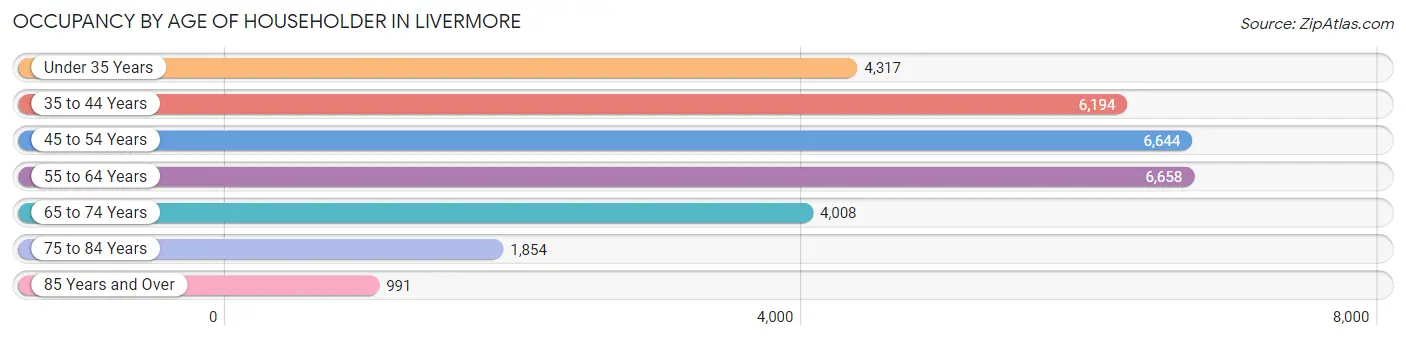
| Age Bracket | # Households | % Households |
| Under 35 Years | 4,317 | 14.1% |
| 35 to 44 Years | 6,194 | 20.2% |
| 45 to 54 Years | 6,644 | 21.7% |
| 55 to 64 Years | 6,658 | 21.7% |
| 65 to 74 Years | 4,008 | 13.1% |
| 75 to 84 Years | 1,854 | 6.0% |
| 85 Years and Over | 991 | 3.2% |
| Total | 30,666 | 100.0% |
Housing Finances in Livermore
Median Income by Occupancy in Livermore
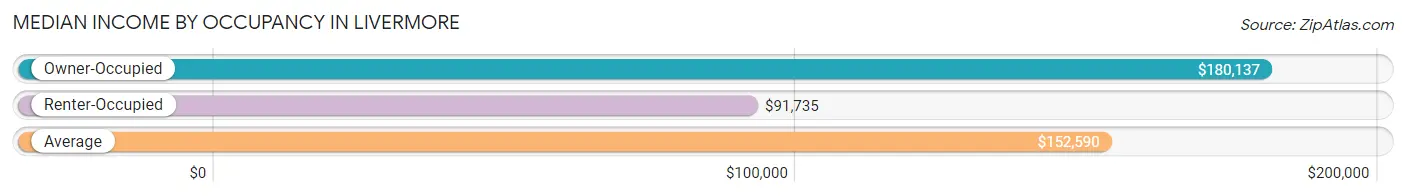
| Occupancy Type | # Households | Median Income |
| Owner-Occupied | 22,300 (72.7%) | $180,137 |
| Renter-Occupied | 8,366 (27.3%) | $91,735 |
| Average | 30,666 (100.0%) | $152,590 |
Occupancy by Householder Income Bracket in Livermore
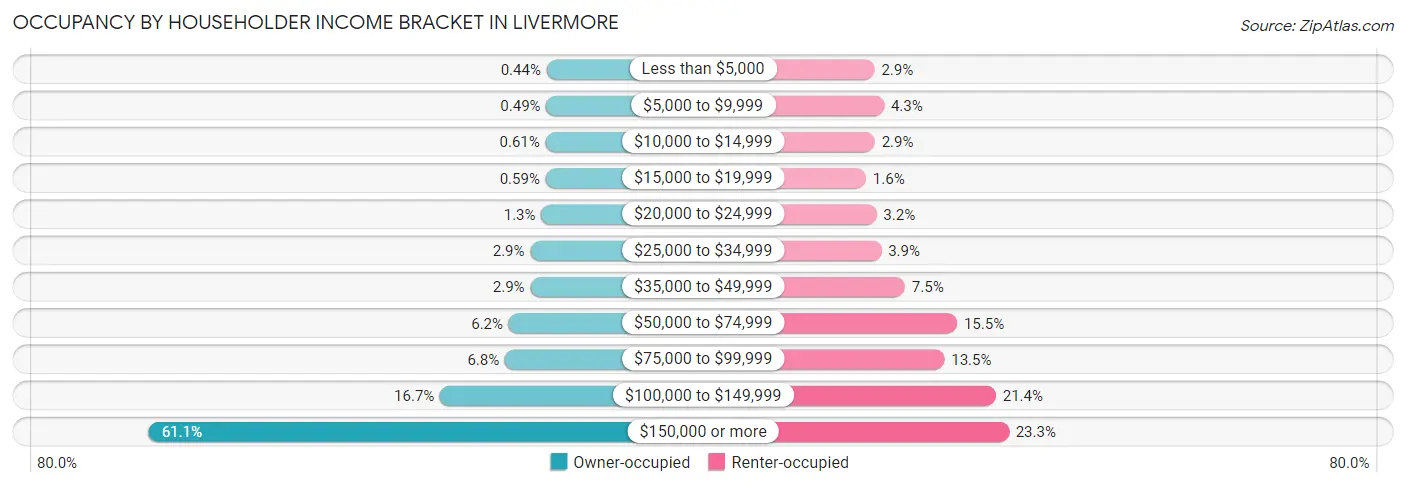
| Income Bracket | Owner-occupied | Renter-occupied |
| Less than $5,000 | 99 (0.4%) | 241 (2.9%) |
| $5,000 to $9,999 | 110 (0.5%) | 362 (4.3%) |
| $10,000 to $14,999 | 137 (0.6%) | 244 (2.9%) |
| $15,000 to $19,999 | 131 (0.6%) | 132 (1.6%) |
| $20,000 to $24,999 | 279 (1.3%) | 266 (3.2%) |
| $25,000 to $34,999 | 654 (2.9%) | 327 (3.9%) |
| $35,000 to $49,999 | 651 (2.9%) | 629 (7.5%) |
| $50,000 to $74,999 | 1,384 (6.2%) | 1,293 (15.5%) |
| $75,000 to $99,999 | 1,515 (6.8%) | 1,131 (13.5%) |
| $100,000 to $149,999 | 3,720 (16.7%) | 1,788 (21.4%) |
| $150,000 or more | 13,620 (61.1%) | 1,953 (23.3%) |
| Total | 22,300 (100.0%) | 8,366 (100.0%) |
Monthly Housing Cost Tiers in Livermore
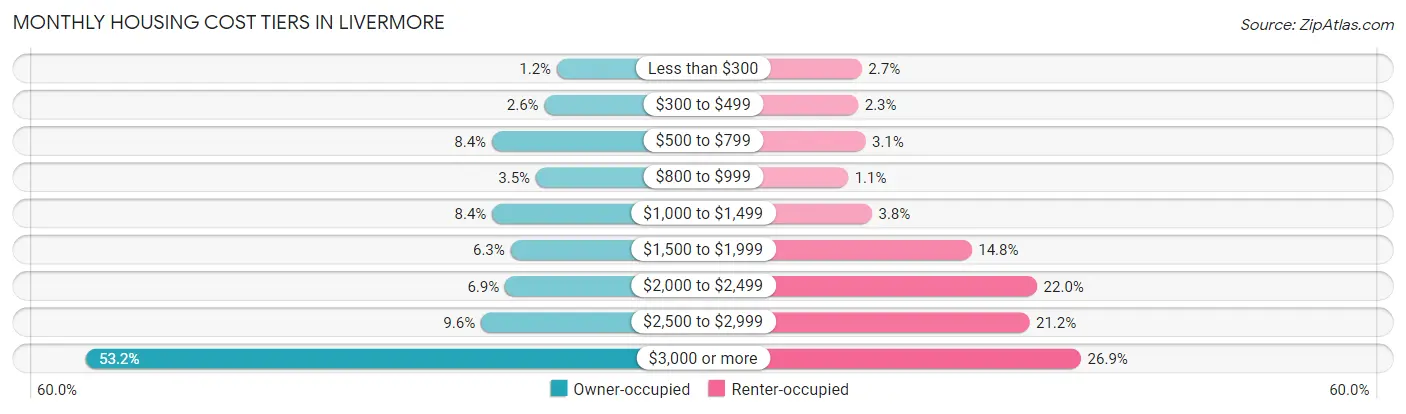
| Monthly Cost | Owner-occupied | Renter-occupied |
| Less than $300 | 265 (1.2%) | 222 (2.6%) |
| $300 to $499 | 574 (2.6%) | 188 (2.2%) |
| $500 to $799 | 1,866 (8.4%) | 255 (3.0%) |
| $800 to $999 | 783 (3.5%) | 95 (1.1%) |
| $1,000 to $1,499 | 1,863 (8.4%) | 315 (3.8%) |
| $1,500 to $1,999 | 1,407 (6.3%) | 1,237 (14.8%) |
| $2,000 to $2,499 | 1,543 (6.9%) | 1,841 (22.0%) |
| $2,500 to $2,999 | 2,136 (9.6%) | 1,771 (21.2%) |
| $3,000 or more | 11,863 (53.2%) | 2,248 (26.9%) |
| Total | 22,300 (100.0%) | 8,366 (100.0%) |
Physical Housing Characteristics in Livermore
Housing Structures in Livermore
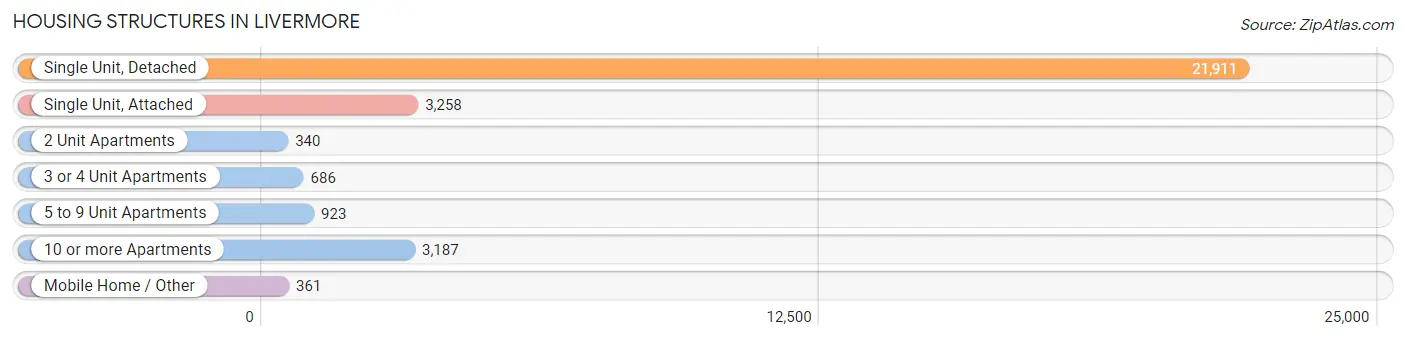
| Structure Type | # Housing Units | % Housing Units |
| Single Unit, Detached | 21,911 | 71.5% |
| Single Unit, Attached | 3,258 | 10.6% |
| 2 Unit Apartments | 340 | 1.1% |
| 3 or 4 Unit Apartments | 686 | 2.2% |
| 5 to 9 Unit Apartments | 923 | 3.0% |
| 10 or more Apartments | 3,187 | 10.4% |
| Mobile Home / Other | 361 | 1.2% |
| Total | 30,666 | 100.0% |
Housing Structures by Occupancy in Livermore
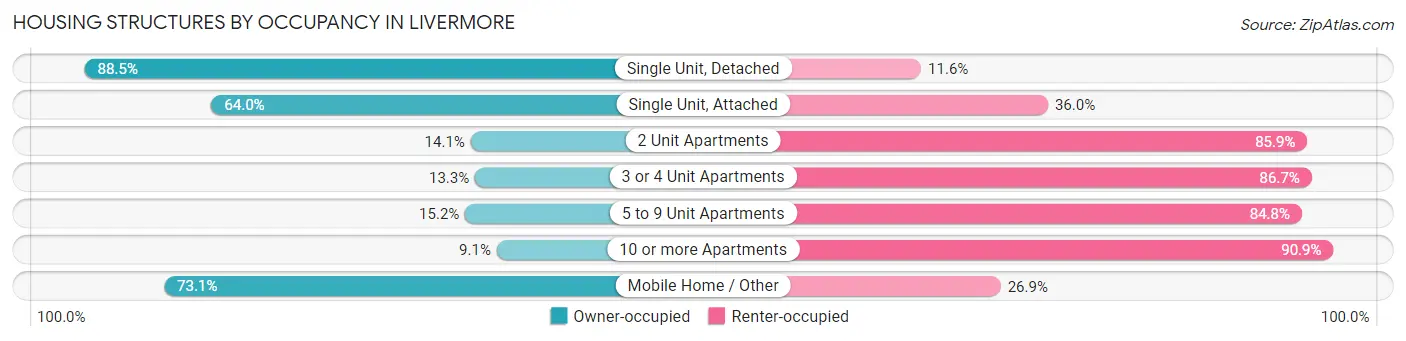
| Structure Type | Owner-occupied | Renter-occupied |
| Single Unit, Detached | 19,381 (88.4%) | 2,530 (11.6%) |
| Single Unit, Attached | 2,086 (64.0%) | 1,172 (36.0%) |
| 2 Unit Apartments | 48 (14.1%) | 292 (85.9%) |
| 3 or 4 Unit Apartments | 91 (13.3%) | 595 (86.7%) |
| 5 to 9 Unit Apartments | 140 (15.2%) | 783 (84.8%) |
| 10 or more Apartments | 290 (9.1%) | 2,897 (90.9%) |
| Mobile Home / Other | 264 (73.1%) | 97 (26.9%) |
| Total | 22,300 (72.7%) | 8,366 (27.3%) |
Housing Structures by Number of Rooms in Livermore
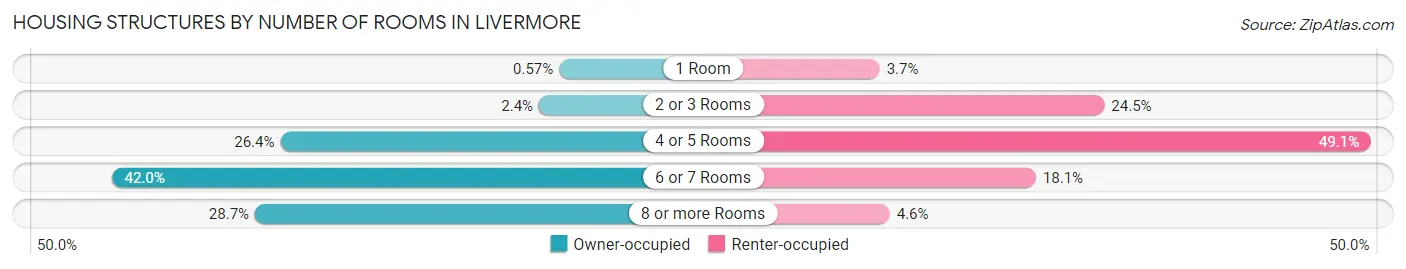
| Number of Rooms | Owner-occupied | Renter-occupied |
| 1 Room | 128 (0.6%) | 308 (3.7%) |
| 2 or 3 Rooms | 541 (2.4%) | 2,046 (24.5%) |
| 4 or 5 Rooms | 5,875 (26.4%) | 4,109 (49.1%) |
| 6 or 7 Rooms | 9,355 (41.9%) | 1,517 (18.1%) |
| 8 or more Rooms | 6,401 (28.7%) | 386 (4.6%) |
| Total | 22,300 (100.0%) | 8,366 (100.0%) |
Housing Structure by Heating Type in Livermore
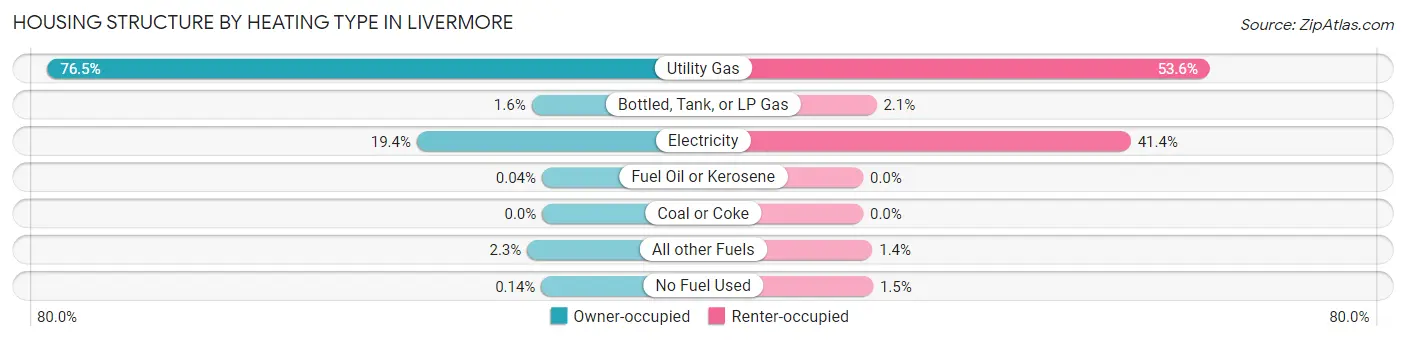
| Heating Type | Owner-occupied | Renter-occupied |
| Utility Gas | 17,056 (76.5%) | 4,483 (53.6%) |
| Bottled, Tank, or LP Gas | 365 (1.6%) | 173 (2.1%) |
| Electricity | 4,320 (19.4%) | 3,462 (41.4%) |
| Fuel Oil or Kerosene | 10 (0.0%) | 0 (0.0%) |
| Coal or Coke | 0 (0.0%) | 0 (0.0%) |
| All other Fuels | 518 (2.3%) | 120 (1.4%) |
| No Fuel Used | 31 (0.1%) | 128 (1.5%) |
| Total | 22,300 (100.0%) | 8,366 (100.0%) |
Household Vehicle Usage in Livermore
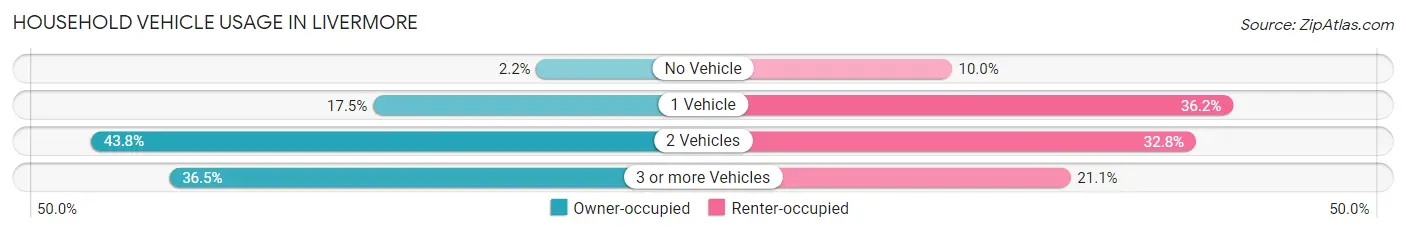
| Vehicles per Household | Owner-occupied | Renter-occupied |
| No Vehicle | 496 (2.2%) | 832 (10.0%) |
| 1 Vehicle | 3,895 (17.5%) | 3,032 (36.2%) |
| 2 Vehicles | 9,769 (43.8%) | 2,741 (32.8%) |
| 3 or more Vehicles | 8,140 (36.5%) | 1,761 (21.0%) |
| Total | 22,300 (100.0%) | 8,366 (100.0%) |
Real Estate & Mortgages in Livermore
Real Estate and Mortgage Overview in Livermore
| Characteristic | Without Mortgage | With Mortgage |
| Housing Units | 5,366 | 16,934 |
| Median Property Value | $922,800 | $978,000 |
| Median Household Income | $116,795 | $11,512 |
| Monthly Housing Costs | $838 | $11,832 |
| Real Estate Taxes | $4,682 | $191 |
Property Value by Mortgage Status in Livermore
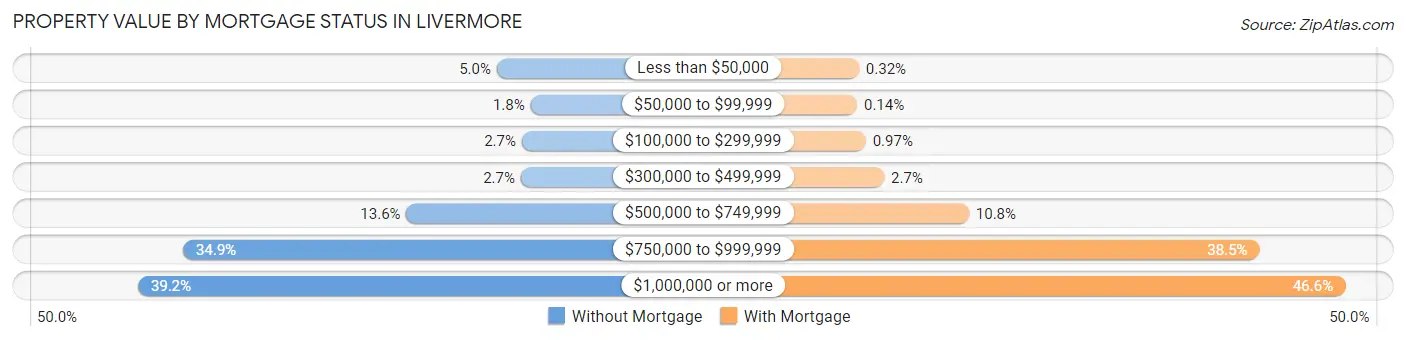
| Property Value | Without Mortgage | With Mortgage |
| Less than $50,000 | 270 (5.0%) | 54 (0.3%) |
| $50,000 to $99,999 | 97 (1.8%) | 24 (0.1%) |
| $100,000 to $299,999 | 142 (2.6%) | 164 (1.0%) |
| $300,000 to $499,999 | 147 (2.7%) | 460 (2.7%) |
| $500,000 to $749,999 | 732 (13.6%) | 1,827 (10.8%) |
| $750,000 to $999,999 | 1,874 (34.9%) | 6,512 (38.5%) |
| $1,000,000 or more | 2,104 (39.2%) | 7,893 (46.6%) |
| Total | 5,366 (100.0%) | 16,934 (100.0%) |
Household Income by Mortgage Status in Livermore
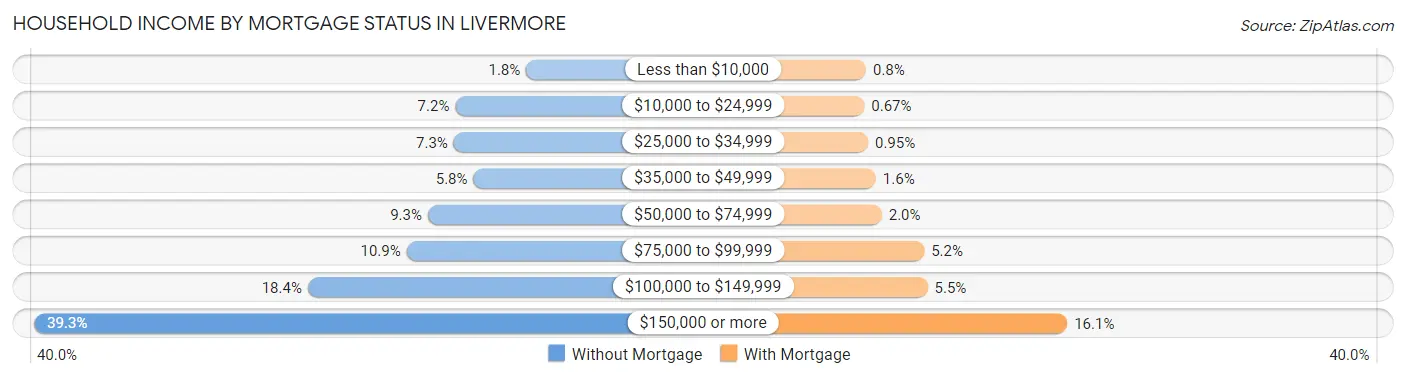
| Household Income | Without Mortgage | With Mortgage |
| Less than $10,000 | 96 (1.8%) | 135 (0.8%) |
| $10,000 to $24,999 | 386 (7.2%) | 113 (0.7%) |
| $25,000 to $34,999 | 392 (7.3%) | 161 (0.9%) |
| $35,000 to $49,999 | 312 (5.8%) | 262 (1.5%) |
| $50,000 to $74,999 | 498 (9.3%) | 339 (2.0%) |
| $75,000 to $99,999 | 585 (10.9%) | 886 (5.2%) |
| $100,000 to $149,999 | 989 (18.4%) | 930 (5.5%) |
| $150,000 or more | 2,108 (39.3%) | 2,731 (16.1%) |
| Total | 5,366 (100.0%) | 16,934 (100.0%) |
Property Value to Household Income Ratio in Livermore
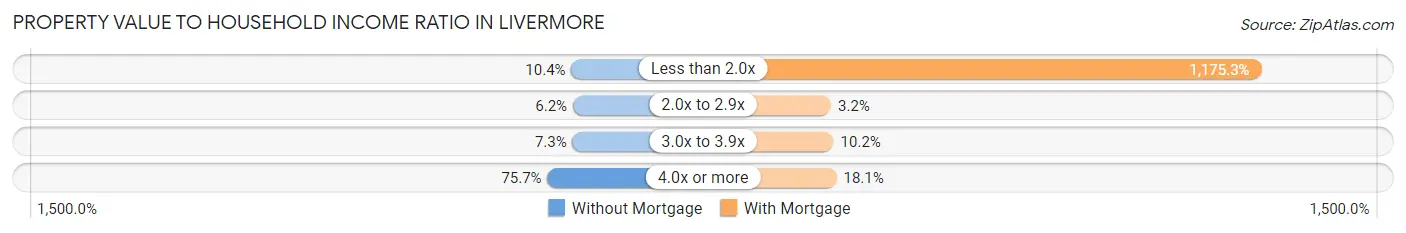
| Value-to-Income Ratio | Without Mortgage | With Mortgage |
| Less than 2.0x | 556 (10.4%) | 199,030 (1,175.3%) |
| 2.0x to 2.9x | 335 (6.2%) | 537 (3.2%) |
| 3.0x to 3.9x | 391 (7.3%) | 1,718 (10.2%) |
| 4.0x or more | 4,062 (75.7%) | 3,062 (18.1%) |
| Total | 5,366 (100.0%) | 16,934 (100.0%) |
Real Estate Taxes by Mortgage Status in Livermore
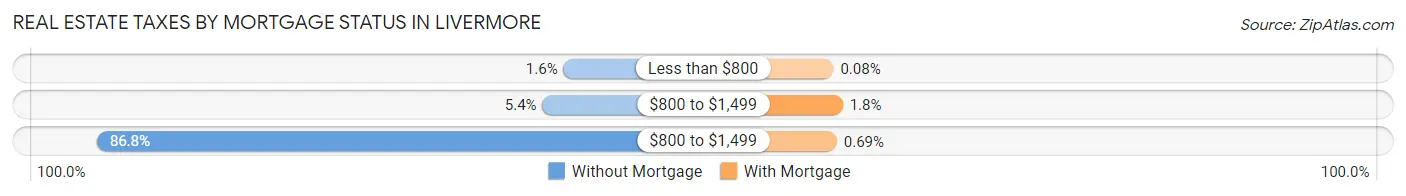
| Property Taxes | Without Mortgage | With Mortgage |
| Less than $800 | 84 (1.6%) | 13 (0.1%) |
| $800 to $1,499 | 291 (5.4%) | 299 (1.8%) |
| $800 to $1,499 | 4,658 (86.8%) | 116 (0.7%) |
| Total | 5,366 (100.0%) | 16,934 (100.0%) |
Health & Disability in Livermore
Health Insurance Coverage by Age in Livermore
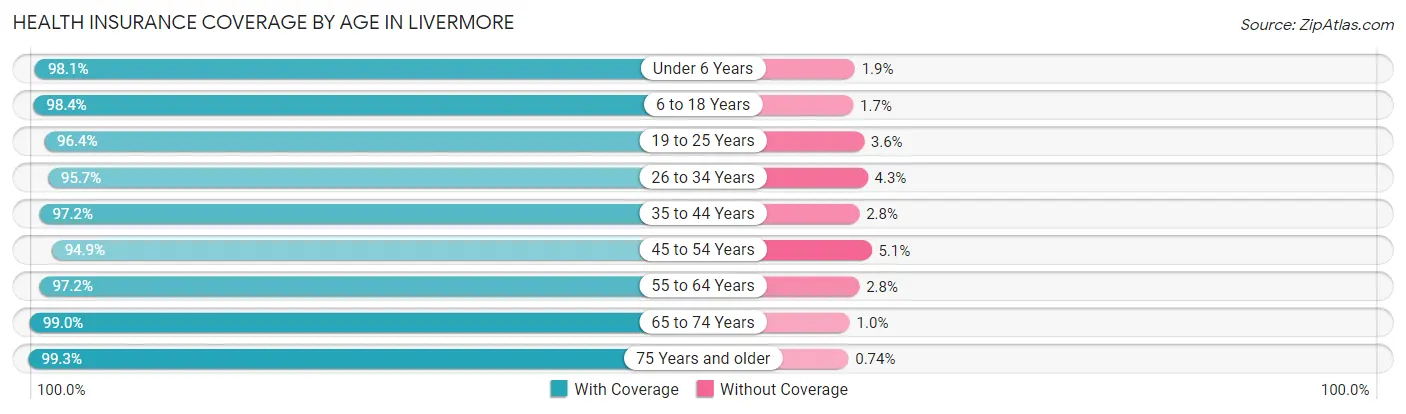
| Age Bracket | With Coverage | Without Coverage |
| Under 6 Years | 6,916 (98.1%) | 137 (1.9%) |
| 6 to 18 Years | 13,858 (98.4%) | 232 (1.7%) |
| 19 to 25 Years | 5,142 (96.4%) | 194 (3.6%) |
| 26 to 34 Years | 9,776 (95.7%) | 444 (4.3%) |
| 35 to 44 Years | 12,243 (97.2%) | 350 (2.8%) |
| 45 to 54 Years | 12,318 (94.9%) | 657 (5.1%) |
| 55 to 64 Years | 11,919 (97.2%) | 341 (2.8%) |
| 65 to 74 Years | 7,162 (99.0%) | 72 (1.0%) |
| 75 Years and older | 5,095 (99.3%) | 38 (0.7%) |
| Total | 84,429 (97.2%) | 2,465 (2.8%) |
Health Insurance Coverage by Citizenship Status in Livermore
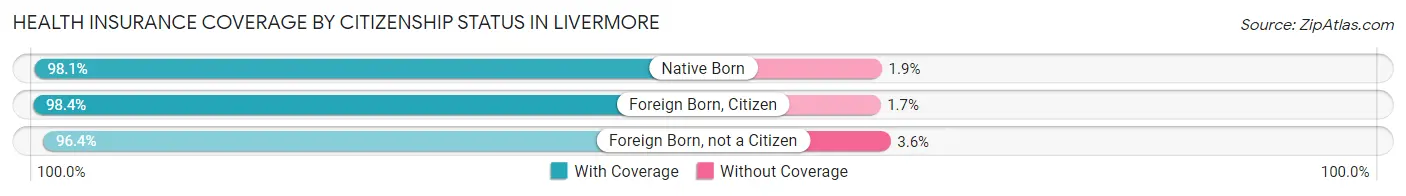
| Citizenship Status | With Coverage | Without Coverage |
| Native Born | 6,916 (98.1%) | 137 (1.9%) |
| Foreign Born, Citizen | 13,858 (98.4%) | 232 (1.7%) |
| Foreign Born, not a Citizen | 5,142 (96.4%) | 194 (3.6%) |
Health Insurance Coverage by Household Income in Livermore
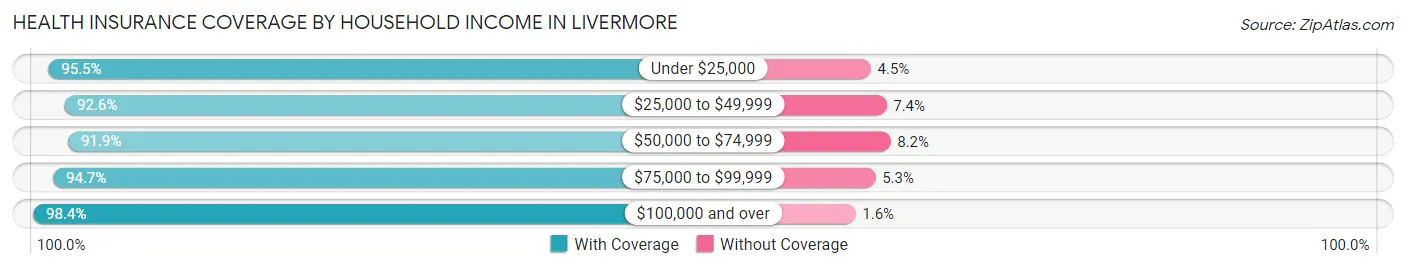
| Household Income | With Coverage | Without Coverage |
| Under $25,000 | 3,126 (95.5%) | 146 (4.5%) |
| $25,000 to $49,999 | 4,056 (92.6%) | 324 (7.4%) |
| $50,000 to $74,999 | 5,920 (91.8%) | 525 (8.2%) |
| $75,000 to $99,999 | 7,034 (94.7%) | 396 (5.3%) |
| $100,000 and over | 63,860 (98.4%) | 1,041 (1.6%) |
Public vs Private Health Insurance Coverage by Age in Livermore
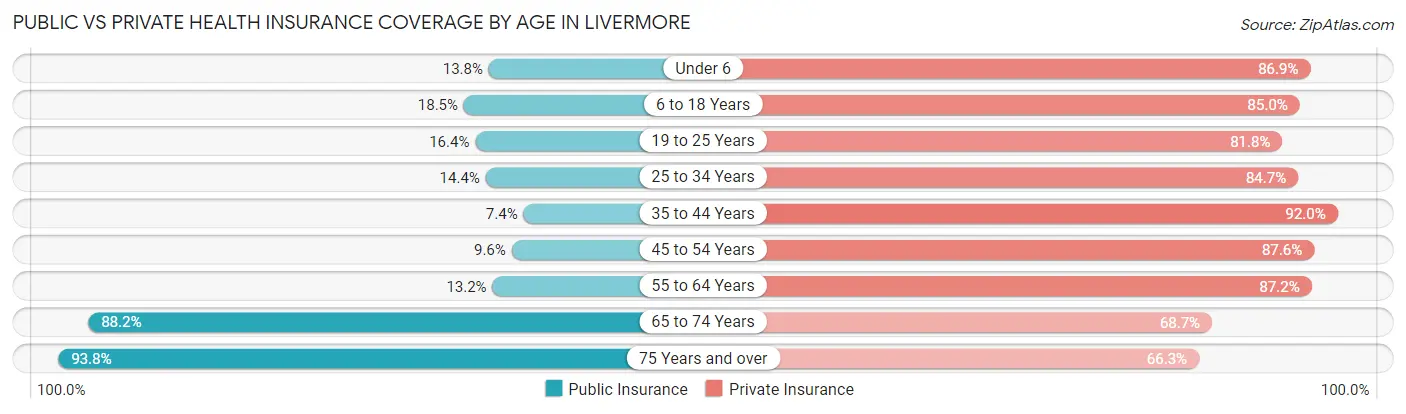
| Age Bracket | Public Insurance | Private Insurance |
| Under 6 | 976 (13.8%) | 6,132 (86.9%) |
| 6 to 18 Years | 2,603 (18.5%) | 11,974 (85.0%) |
| 19 to 25 Years | 873 (16.4%) | 4,362 (81.8%) |
| 25 to 34 Years | 1,474 (14.4%) | 8,653 (84.7%) |
| 35 to 44 Years | 932 (7.4%) | 11,587 (92.0%) |
| 45 to 54 Years | 1,245 (9.6%) | 11,371 (87.6%) |
| 55 to 64 Years | 1,613 (13.2%) | 10,688 (87.2%) |
| 65 to 74 Years | 6,379 (88.2%) | 4,970 (68.7%) |
| 75 Years and over | 4,812 (93.8%) | 3,402 (66.3%) |
| Total | 20,907 (24.1%) | 73,139 (84.2%) |
Disability Status by Sex by Age in Livermore
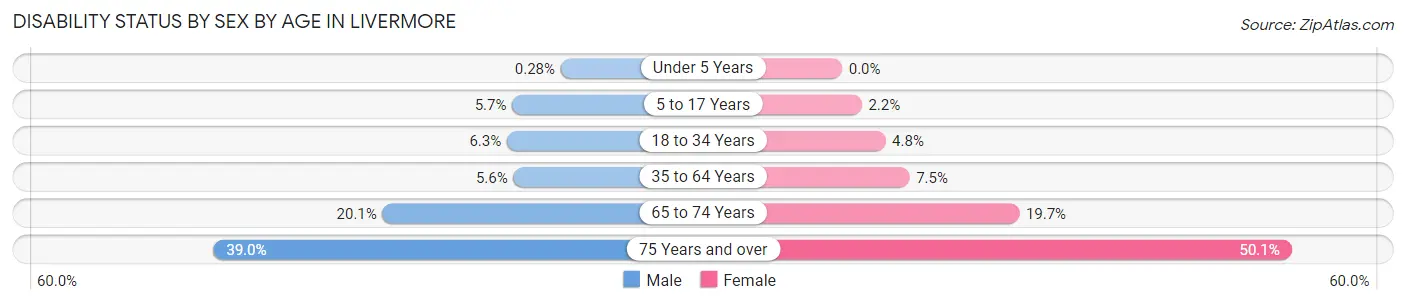
| Age Bracket | Male | Female |
| Under 5 Years | 9 (0.3%) | 0 (0.0%) |
| 5 to 17 Years | 363 (5.7%) | 168 (2.2%) |
| 18 to 34 Years | 544 (6.3%) | 394 (4.8%) |
| 35 to 64 Years | 1,068 (5.6%) | 1,396 (7.5%) |
| 65 to 74 Years | 644 (20.1%) | 796 (19.7%) |
| 75 Years and over | 835 (39.0%) | 1,498 (50.1%) |
Disability Class by Sex by Age in Livermore
Disability Class: Hearing Difficulty
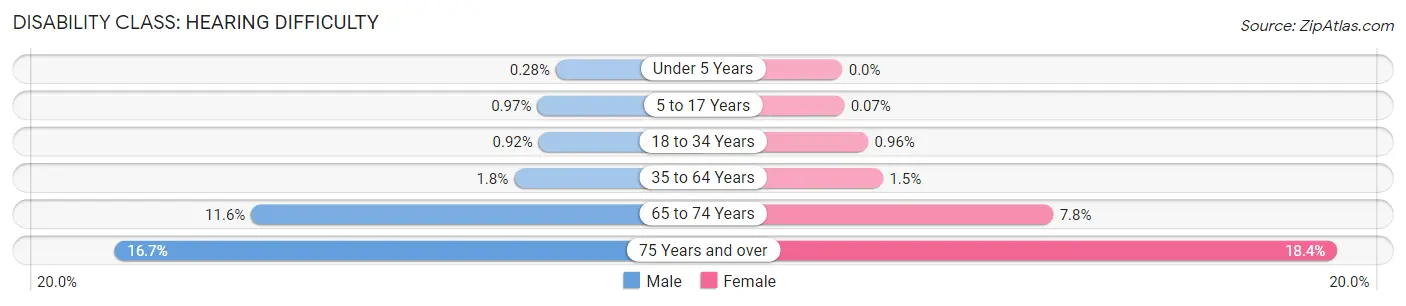
| Age Bracket | Male | Female |
| Under 5 Years | 9 (0.3%) | 0 (0.0%) |
| 5 to 17 Years | 62 (1.0%) | 5 (0.1%) |
| 18 to 34 Years | 80 (0.9%) | 78 (1.0%) |
| 35 to 64 Years | 352 (1.8%) | 281 (1.5%) |
| 65 to 74 Years | 371 (11.6%) | 316 (7.8%) |
| 75 Years and over | 357 (16.7%) | 550 (18.4%) |
Disability Class: Vision Difficulty
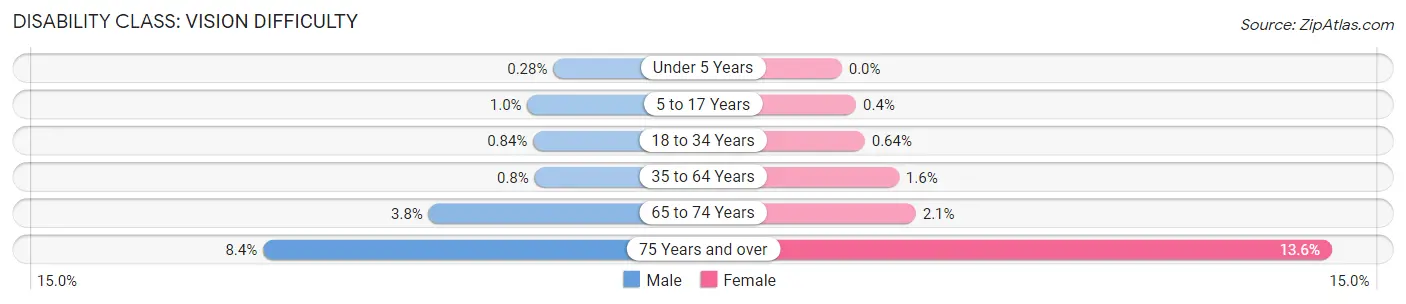
| Age Bracket | Male | Female |
| Under 5 Years | 9 (0.3%) | 0 (0.0%) |
| 5 to 17 Years | 64 (1.0%) | 31 (0.4%) |
| 18 to 34 Years | 73 (0.8%) | 52 (0.6%) |
| 35 to 64 Years | 154 (0.8%) | 296 (1.6%) |
| 65 to 74 Years | 120 (3.7%) | 83 (2.1%) |
| 75 Years and over | 179 (8.4%) | 408 (13.6%) |
Disability Class: Cognitive Difficulty
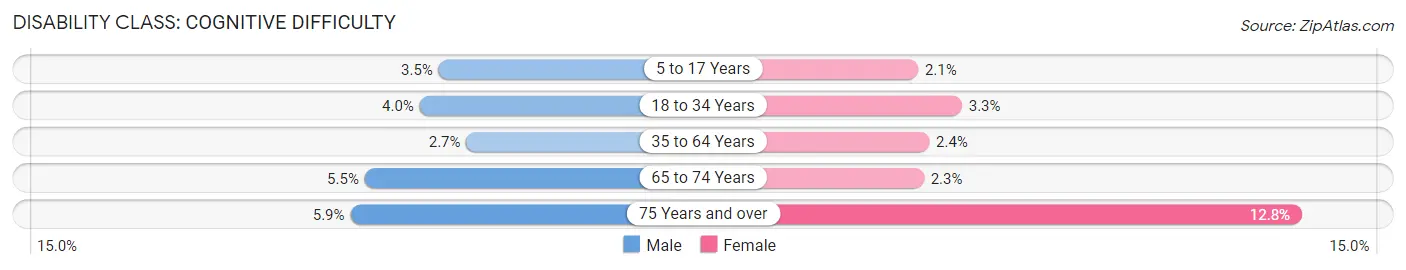
| Age Bracket | Male | Female |
| 5 to 17 Years | 221 (3.5%) | 163 (2.1%) |
| 18 to 34 Years | 347 (4.0%) | 272 (3.3%) |
| 35 to 64 Years | 520 (2.7%) | 452 (2.4%) |
| 65 to 74 Years | 177 (5.5%) | 92 (2.3%) |
| 75 Years and over | 127 (5.9%) | 383 (12.8%) |
Disability Class: Ambulatory Difficulty
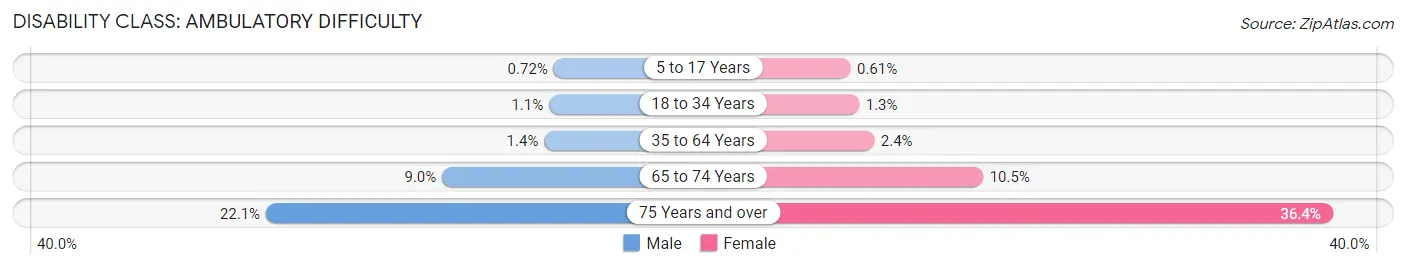
| Age Bracket | Male | Female |
| 5 to 17 Years | 46 (0.7%) | 47 (0.6%) |
| 18 to 34 Years | 92 (1.1%) | 103 (1.3%) |
| 35 to 64 Years | 274 (1.4%) | 443 (2.4%) |
| 65 to 74 Years | 288 (9.0%) | 422 (10.5%) |
| 75 Years and over | 473 (22.1%) | 1,090 (36.4%) |
Disability Class: Self-Care Difficulty
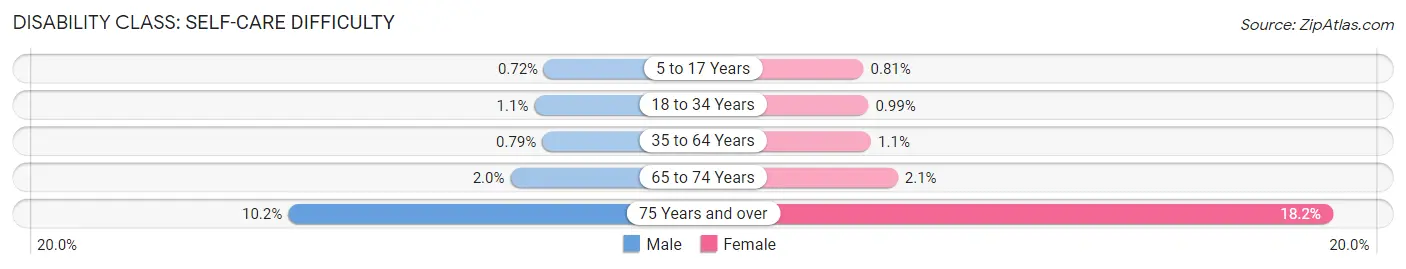
| Age Bracket | Male | Female |
| 5 to 17 Years | 46 (0.7%) | 62 (0.8%) |
| 18 to 34 Years | 94 (1.1%) | 81 (1.0%) |
| 35 to 64 Years | 152 (0.8%) | 203 (1.1%) |
| 65 to 74 Years | 63 (2.0%) | 84 (2.1%) |
| 75 Years and over | 219 (10.2%) | 545 (18.2%) |
Technology Access in Livermore
Computing Device Access in Livermore
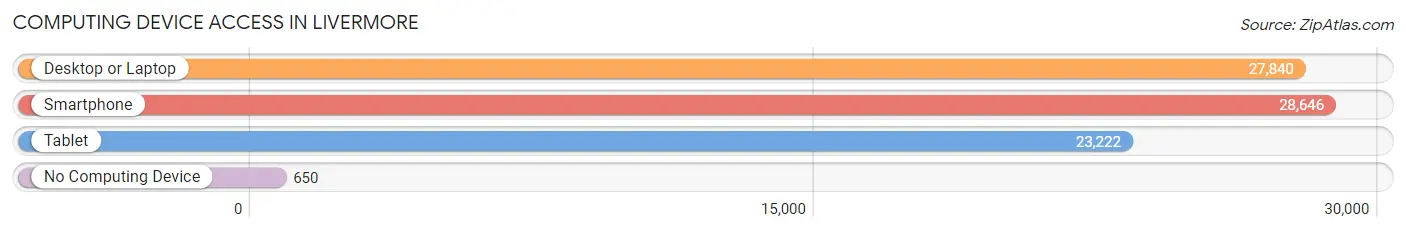
| Device Type | # Households | % Households |
| Desktop or Laptop | 27,840 | 90.8% |
| Smartphone | 28,646 | 93.4% |
| Tablet | 23,222 | 75.7% |
| No Computing Device | 650 | 2.1% |
| Total | 30,666 | 100.0% |
Internet Access in Livermore
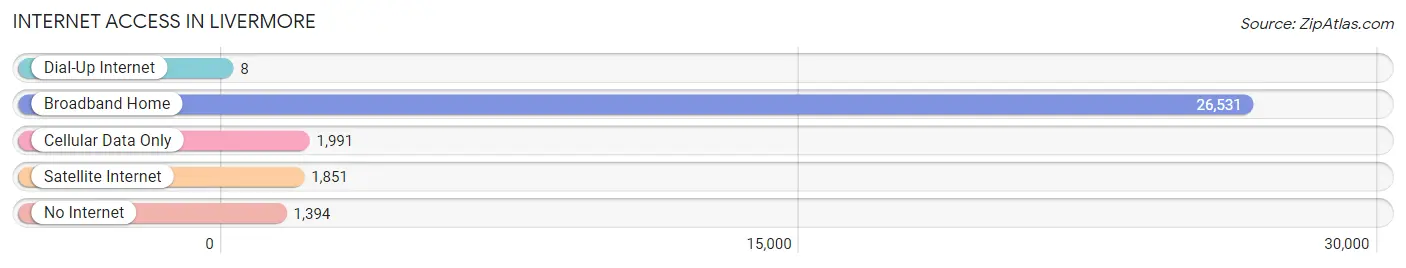
| Internet Type | # Households | % Households |
| Dial-Up Internet | 8 | 0.0% |
| Broadband Home | 26,531 | 86.5% |
| Cellular Data Only | 1,991 | 6.5% |
| Satellite Internet | 1,851 | 6.0% |
| No Internet | 1,394 | 4.5% |
| Total | 30,666 | 100.0% |
Livermore Summary
Livermore, California is a city located in Alameda County, in the San Francisco Bay Area. It is situated in the East Bay region of the Bay Area, about 40 miles east of San Francisco. The city is home to the Lawrence Livermore National Laboratory, which is one of the United States’ premier research facilities. The city is also home to the Livermore Valley AVA, a wine-producing region.
History
The area that is now Livermore was originally inhabited by the Ohlone people, who lived in the area for thousands of years before the arrival of Europeans. The first Europeans to settle in the area were the Spanish, who established a mission in the area in 1797. The area was then part of the Rancho Las Positas land grant, which was granted to the Mexican-born settler Jose Noriega in 1839.
In 1869, William Mendenhall and his family arrived in the area and established a ranch. The Mendenhall family was instrumental in the development of the area, and the city of Livermore was officially incorporated in 1876. The city was named after Robert Livermore, a rancher who had settled in the area in the 1840s.
Geography
Livermore is located in the East Bay region of the San Francisco Bay Area, about 40 miles east of San Francisco. The city is situated in the Livermore Valley, which is surrounded by the Diablo Range to the east and the Coast Range to the west. The city is located at the confluence of the Arroyo Seco and the Livermore Valley.
The city has a total area of 24.2 square miles, of which 24.1 square miles is land and 0.1 square miles is water. The city is located at an elevation of about 500 feet above sea level.
Economy
Livermore is home to the Lawrence Livermore National Laboratory, which is one of the United States’ premier research facilities. The laboratory is a major employer in the city, and is responsible for much of the city’s economic activity.
The city is also home to several wineries, which are part of the Livermore Valley AVA, a wine-producing region. The city is also home to several technology companies, including Sandia National Laboratories, Topcon Positioning Systems, and the National Ignition Facility.
Demographics
As of the 2010 census, the city had a population of 84,039. The racial makeup of the city was 63.2% White, 2.2% African American, 0.7% Native American, 16.2% Asian, 0.3% Pacific Islander, 11.3% from other races, and 6.3% from two or more races. Hispanic or Latino of any race were 24.7% of the population.
The median income for a household in the city was $87,821, and the median income for a family was $103,817. The per capita income for the city was $41,845. About 6.2% of families and 8.7% of the population were below the poverty line, including 11.2% of those under age 18 and 5.2% of those age 65 or over.
Common Questions
What is Per Capita Income in Livermore?
Per Capita income in Livermore is $67,965.
What is the Median Family Income in Livermore?
Median Family Income in Livermore is $173,560.
What is the Median Household income in Livermore?
Median Household Income in Livermore is $152,590.
What is Income or Wage Gap in Livermore?
Income or Wage Gap in Livermore is 40.3%.
Women in Livermore earn 59.7 cents for every dollar earned by a man.
What is Family Income Deficit in Livermore?
Family Income Deficit in Livermore is $12,852.
Families that are below poverty line in Livermore earn $12,852 less on average than the poverty threshold level.
What is Inequality or Gini Index in Livermore?
Inequality or Gini Index in Livermore is 0.42.
What is the Total Population of Livermore?
Total Population of Livermore is 87,154.
What is the Total Male Population of Livermore?
Total Male Population of Livermore is 43,048.
What is the Total Female Population of Livermore?
Total Female Population of Livermore is 44,106.
What is the Ratio of Males per 100 Females in Livermore?
There are 97.60 Males per 100 Females in Livermore.
What is the Ratio of Females per 100 Males in Livermore?
There are 102.46 Females per 100 Males in Livermore.
What is the Median Population Age in Livermore?
Median Population Age in Livermore is 40.3 Years.
What is the Average Family Size in Livermore
Average Family Size in Livermore is 3.3 People.
What is the Average Household Size in Livermore
Average Household Size in Livermore is 2.8 People.
How Large is the Labor Force in Livermore?
There are 48,544 People in the Labor Forcein in Livermore.
What is the Percentage of People in the Labor Force in Livermore?
69.8% of People are in the Labor Force in Livermore.
What is the Unemployment Rate in Livermore?
Unemployment Rate in Livermore is 3.3%.