Cities with the Lowest Poverty Level Among Families in Tennessee
RELATED REPORTS & OPTIONS
Lowest Family Poverty
Tennessee
Compare Cities
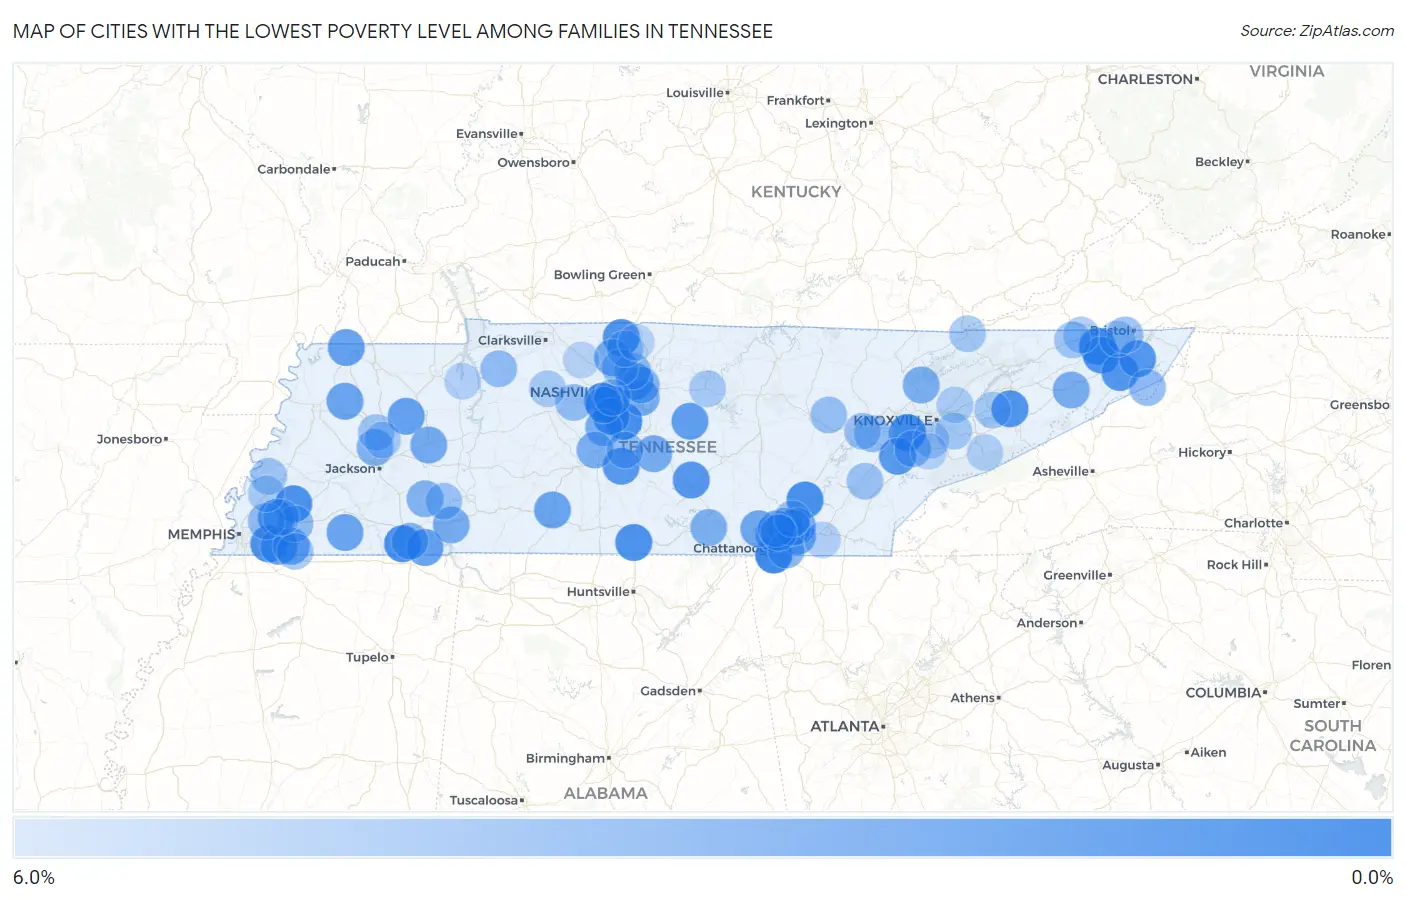
Map of Cities with the Lowest Poverty Level Among Families in Tennessee
6.0%
0.0%
Cities with the Lowest Poverty Level Among Families in Tennessee
| City | Family Poverty | vs State | vs National | |
| 1. | Oak Hill | 0.35% | 10.0%(-9.66)#1 | 8.8%(-8.43)#37 |
| 2. | Lookout Mountain | 0.49% | 10.0%(-9.52)#2 | 8.8%(-8.29)#81 |
| 3. | Belle Meade | 0.61% | 10.0%(-9.41)#3 | 8.8%(-8.18)#157 |
| 4. | Farragut | 0.80% | 10.0%(-9.22)#4 | 8.8%(-7.99)#312 |
| 5. | Nolensville | 0.90% | 10.0%(-9.11)#5 | 8.8%(-7.88)#424 |
| 6. | Ramer | 0.96% | 10.0%(-9.05)#6 | 8.8%(-7.82)#485 |
| 7. | Sale Creek | 1.1% | 10.0%(-8.94)#7 | 8.8%(-7.71)#617 |
| 8. | Park City | 1.2% | 10.0%(-8.78)#8 | 8.8%(-7.55)#802 |
| 9. | Colonial Heights | 1.2% | 10.0%(-8.78)#9 | 8.8%(-7.55)#807 |
| 10. | Braden | 1.3% | 10.0%(-8.73)#10 | 8.8%(-7.50)#871 |
| 11. | Germantown | 1.4% | 10.0%(-8.65)#11 | 8.8%(-7.43)#959 |
| 12. | Brentwood | 1.4% | 10.0%(-8.63)#12 | 8.8%(-7.40)#980 |
| 13. | Cross Plains | 1.4% | 10.0%(-8.63)#13 | 8.8%(-7.40)#984 |
| 14. | Gray | 1.4% | 10.0%(-8.58)#14 | 8.8%(-7.35)#1,059 |
| 15. | Baneberry | 1.5% | 10.0%(-8.47)#15 | 8.8%(-7.24)#1,207 |
| 16. | Pine Crest | 1.6% | 10.0%(-8.44)#16 | 8.8%(-7.21)#1,252 |
| 17. | New Union | 1.6% | 10.0%(-8.40)#17 | 8.8%(-7.17)#1,303 |
| 18. | Hunter | 1.6% | 10.0%(-8.38)#18 | 8.8%(-7.15)#1,339 |
| 19. | Chapel Hill | 1.7% | 10.0%(-8.30)#19 | 8.8%(-7.07)#1,446 |
| 20. | Tellico Village | 1.9% | 10.0%(-8.15)#20 | 8.8%(-6.92)#1,669 |
| 21. | Signal Mountain | 1.9% | 10.0%(-8.10)#21 | 8.8%(-6.87)#1,759 |
| 22. | Lakeland | 1.9% | 10.0%(-8.10)#22 | 8.8%(-6.87)#1,762 |
| 23. | Collierville | 2.1% | 10.0%(-7.95)#23 | 8.8%(-6.72)#1,973 |
| 24. | Auburntown | 2.1% | 10.0%(-7.95)#24 | 8.8%(-6.72)#1,978 |
| 25. | Green Hill | 2.1% | 10.0%(-7.92)#25 | 8.8%(-6.69)#2,024 |
| 26. | Michie | 2.2% | 10.0%(-7.81)#26 | 8.8%(-6.58)#2,186 |
| 27. | Woodland Mills | 2.3% | 10.0%(-7.74)#27 | 8.8%(-6.51)#2,302 |
| 28. | Mclemoresville | 2.3% | 10.0%(-7.74)#28 | 8.8%(-6.51)#2,307 |
| 29. | Karns | 2.4% | 10.0%(-7.61)#29 | 8.8%(-6.38)#2,520 |
| 30. | Ethridge | 2.6% | 10.0%(-7.45)#30 | 8.8%(-6.22)#2,780 |
| 31. | Yorkville | 2.6% | 10.0%(-7.45)#31 | 8.8%(-6.22)#2,785 |
| 32. | Hickory Valley | 2.6% | 10.0%(-7.45)#32 | 8.8%(-6.22)#2,796 |
| 33. | Harrison | 2.6% | 10.0%(-7.40)#33 | 8.8%(-6.17)#2,874 |
| 34. | Powells Crossroads | 2.7% | 10.0%(-7.30)#34 | 8.8%(-6.07)#3,044 |
| 35. | Oak Grove Cdp Washington County | 2.8% | 10.0%(-7.20)#35 | 8.8%(-5.97)#3,218 |
| 36. | Lakesite | 2.8% | 10.0%(-7.17)#36 | 8.8%(-5.94)#3,278 |
| 37. | Piperton | 2.9% | 10.0%(-7.11)#37 | 8.8%(-5.88)#3,384 |
| 38. | Falling Water | 2.9% | 10.0%(-7.09)#38 | 8.8%(-5.86)#3,411 |
| 39. | Ridgetop | 2.9% | 10.0%(-7.07)#39 | 8.8%(-5.84)#3,447 |
| 40. | Parker S Crossroads | 3.0% | 10.0%(-7.03)#40 | 8.8%(-5.81)#3,515 |
| 41. | Franklin | 3.1% | 10.0%(-6.91)#41 | 8.8%(-5.68)#3,729 |
| 42. | Olivet | 3.1% | 10.0%(-6.90)#42 | 8.8%(-5.67)#3,732 |
| 43. | Christiana | 3.1% | 10.0%(-6.87)#43 | 8.8%(-5.64)#3,796 |
| 44. | Tusculum | 3.2% | 10.0%(-6.80)#44 | 8.8%(-5.57)#3,902 |
| 45. | Rural Hill | 3.3% | 10.0%(-6.76)#45 | 8.8%(-5.53)#3,969 |
| 46. | Spring Hill | 3.3% | 10.0%(-6.73)#46 | 8.8%(-5.50)#4,017 |
| 47. | Norris | 3.3% | 10.0%(-6.70)#47 | 8.8%(-5.47)#4,062 |
| 48. | Sewanee | 3.4% | 10.0%(-6.64)#48 | 8.8%(-5.41)#4,172 |
| 49. | Three Way | 3.5% | 10.0%(-6.47)#49 | 8.8%(-5.24)#4,428 |
| 50. | Strawberry Plains | 3.6% | 10.0%(-6.46)#50 | 8.8%(-5.23)#4,447 |
| 51. | Enville | 3.6% | 10.0%(-6.44)#51 | 8.8%(-5.21)#4,502 |
| 52. | Eastview | 3.6% | 10.0%(-6.37)#52 | 8.8%(-5.14)#4,631 |
| 53. | Mount Juliet | 3.7% | 10.0%(-6.34)#53 | 8.8%(-5.11)#4,668 |
| 54. | Ridgeside | 3.7% | 10.0%(-6.28)#54 | 8.8%(-5.05)#4,785 |
| 55. | Middle Valley | 3.7% | 10.0%(-6.27)#55 | 8.8%(-5.04)#4,795 |
| 56. | Fairmount | 3.8% | 10.0%(-6.18)#56 | 8.8%(-4.95)#4,920 |
| 57. | Powell | 4.0% | 10.0%(-6.02)#57 | 8.8%(-4.79)#5,168 |
| 58. | Hendersonville | 4.1% | 10.0%(-5.92)#58 | 8.8%(-4.69)#5,339 |
| 59. | Friendsville | 4.1% | 10.0%(-5.90)#59 | 8.8%(-4.67)#5,360 |
| 60. | Oakland | 4.1% | 10.0%(-5.88)#60 | 8.8%(-4.65)#5,391 |
| 61. | Goodlettsville | 4.2% | 10.0%(-5.79)#61 | 8.8%(-4.56)#5,522 |
| 62. | Bartlett | 4.2% | 10.0%(-5.78)#62 | 8.8%(-4.55)#5,553 |
| 63. | Tennessee Ridge | 4.2% | 10.0%(-5.76)#63 | 8.8%(-4.53)#5,576 |
| 64. | Roan Mountain | 4.3% | 10.0%(-5.75)#64 | 8.8%(-4.52)#5,608 |
| 65. | Kingston Springs | 4.3% | 10.0%(-5.73)#65 | 8.8%(-4.50)#5,627 |
| 66. | Eagleville | 4.3% | 10.0%(-5.71)#66 | 8.8%(-4.48)#5,655 |
| 67. | Kingston | 4.3% | 10.0%(-5.68)#67 | 8.8%(-4.45)#5,710 |
| 68. | Walnut Hill | 4.4% | 10.0%(-5.57)#68 | 8.8%(-4.34)#5,882 |
| 69. | Fairfield Glade | 4.5% | 10.0%(-5.47)#69 | 8.8%(-4.24)#6,024 |
| 70. | Midtown | 4.6% | 10.0%(-5.45)#70 | 8.8%(-4.22)#6,078 |
| 71. | Niota | 4.7% | 10.0%(-5.36)#71 | 8.8%(-4.13)#6,212 |
| 72. | Saltillo | 4.7% | 10.0%(-5.35)#72 | 8.8%(-4.12)#6,247 |
| 73. | Church Hill | 4.8% | 10.0%(-5.25)#73 | 8.8%(-4.02)#6,356 |
| 74. | Gibson | 4.8% | 10.0%(-5.18)#74 | 8.8%(-3.95)#6,479 |
| 75. | White House | 4.9% | 10.0%(-5.14)#75 | 8.8%(-3.91)#6,539 |
| 76. | Rossville | 4.9% | 10.0%(-5.11)#76 | 8.8%(-3.88)#6,586 |
| 77. | Burlison | 4.9% | 10.0%(-5.11)#77 | 8.8%(-3.88)#6,595 |
| 78. | Forest Hills | 4.9% | 10.0%(-5.11)#78 | 8.8%(-3.88)#6,597 |
| 79. | Rarity Bay | 5.0% | 10.0%(-4.98)#79 | 8.8%(-3.75)#6,830 |
| 80. | Harrogate | 5.0% | 10.0%(-4.97)#80 | 8.8%(-3.74)#6,846 |
| 81. | Seymour | 5.1% | 10.0%(-4.94)#81 | 8.8%(-3.71)#6,881 |
| 82. | Soddy Daisy | 5.1% | 10.0%(-4.93)#82 | 8.8%(-3.70)#6,891 |
| 83. | Dandridge | 5.1% | 10.0%(-4.90)#83 | 8.8%(-3.67)#6,951 |
| 84. | Arlington | 5.1% | 10.0%(-4.88)#84 | 8.8%(-3.65)#6,989 |
| 85. | Mount Carmel | 5.2% | 10.0%(-4.85)#85 | 8.8%(-3.62)#7,021 |
| 86. | Charlotte | 5.2% | 10.0%(-4.80)#86 | 8.8%(-3.57)#7,079 |
| 87. | Berry Hill | 5.2% | 10.0%(-4.80)#87 | 8.8%(-3.57)#7,080 |
| 88. | Medina | 5.2% | 10.0%(-4.80)#88 | 8.8%(-3.57)#7,086 |
| 89. | Walden | 5.3% | 10.0%(-4.75)#89 | 8.8%(-3.52)#7,155 |
| 90. | Munford | 5.3% | 10.0%(-4.74)#90 | 8.8%(-3.51)#7,205 |
| 91. | Gordonsville | 5.3% | 10.0%(-4.72)#91 | 8.8%(-3.49)#7,235 |
| 92. | Alcoa | 5.3% | 10.0%(-4.72)#92 | 8.8%(-3.49)#7,240 |
| 93. | Mascot | 5.4% | 10.0%(-4.59)#93 | 8.8%(-3.36)#7,428 |
| 94. | Blountville | 5.6% | 10.0%(-4.41)#94 | 8.8%(-3.18)#7,681 |
| 95. | Gatlinburg | 5.7% | 10.0%(-4.36)#95 | 8.8%(-3.13)#7,763 |
| 96. | Big Sandy | 5.7% | 10.0%(-4.34)#96 | 8.8%(-3.11)#7,808 |
| 97. | South Cleveland | 5.7% | 10.0%(-4.29)#97 | 8.8%(-3.06)#7,881 |
| 98. | Maryville | 5.7% | 10.0%(-4.27)#98 | 8.8%(-3.04)#7,910 |
| 99. | New Deal | 5.8% | 10.0%(-4.20)#99 | 8.8%(-2.97)#8,025 |
| 100. | Pleasant View | 5.9% | 10.0%(-4.12)#100 | 8.8%(-2.89)#8,154 |
Common Questions
What are the Top 10 Cities with the Lowest Poverty Level Among Families in Tennessee?
Top 10 Cities with the Lowest Poverty Level Among Families in Tennessee are:
#1
0.35%
#2
0.49%
#3
0.61%
#4
0.80%
#5
0.90%
#6
0.96%
#7
1.1%
#8
1.2%
#9
1.2%
#10
1.3%
What city has the Lowest Poverty Level Among Families in Tennessee?
Oak Hill has the Lowest Poverty Level Among Families in Tennessee with 0.35%.
What is the Poverty Level Among Families in the State of Tennessee?
Poverty Level Among Families in Tennessee is 10.0%.
What is the Poverty Level Among Families in the United States?
Poverty Level Among Families in the United States is 8.8%.