Templeton, CA Map & Demographics
Templeton Map
Templeton Overview
$50,322
PER CAPITA INCOME
$150,423
AVG FAMILY INCOME
$116,316
AVG HOUSEHOLD INCOME
47.7%
WAGE / INCOME GAP [ % ]
52.3¢/ $1
WAGE / INCOME GAP [ $ ]
0.37
INEQUALITY / GINI INDEX
8,614
TOTAL POPULATION
3,864
MALE POPULATION
4,750
FEMALE POPULATION
81.35
MALES / 100 FEMALES
122.93
FEMALES / 100 MALES
44.5
MEDIAN AGE
2.8
AVG FAMILY SIZE
2.5
AVG HOUSEHOLD SIZE
4,558
LABOR FORCE [ PEOPLE ]
66.1%
PERCENT IN LABOR FORCE
5.6%
UNEMPLOYMENT RATE
Templeton Zip Codes
Templeton Area Codes
Income in Templeton
Income Overview in Templeton
Per Capita Income in Templeton is $50,322, while median incomes of families and households are $150,423 and $116,316 respectively.
| Characteristic | Number | Measure |
| Per Capita Income | 8,614 | $50,322 |
| Median Family Income | 2,541 | $150,423 |
| Mean Family Income | 2,541 | $146,574 |
| Median Household Income | 3,334 | $116,316 |
| Mean Household Income | 3,334 | $132,920 |
| Income Deficit | 2,541 | $0 |
| Wage / Income Gap (%) | 8,614 | 47.68% |
| Wage / Income Gap ($) | 8,614 | 52.32¢ per $1 |
| Gini / Inequality Index | 8,614 | 0.37 |
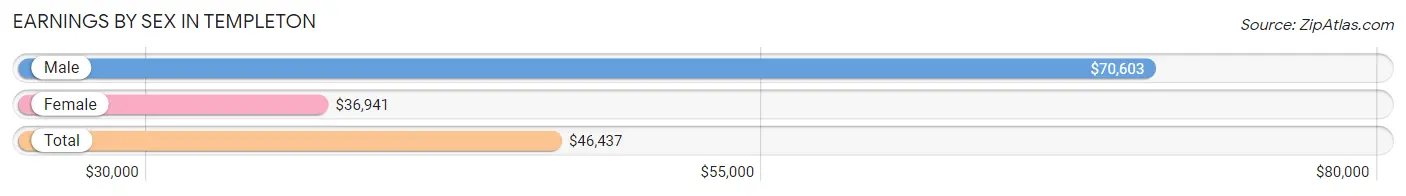
Earnings by Sex in Templeton
Average Earnings in Templeton are $46,437, $70,603 for men and $36,941 for women, a difference of 47.7%.
| Sex | Number | Average Earnings |
| Male | 2,146 (45.4%) | $70,603 |
| Female | 2,585 (54.6%) | $36,941 |
| Total | 4,731 (100.0%) | $46,437 |
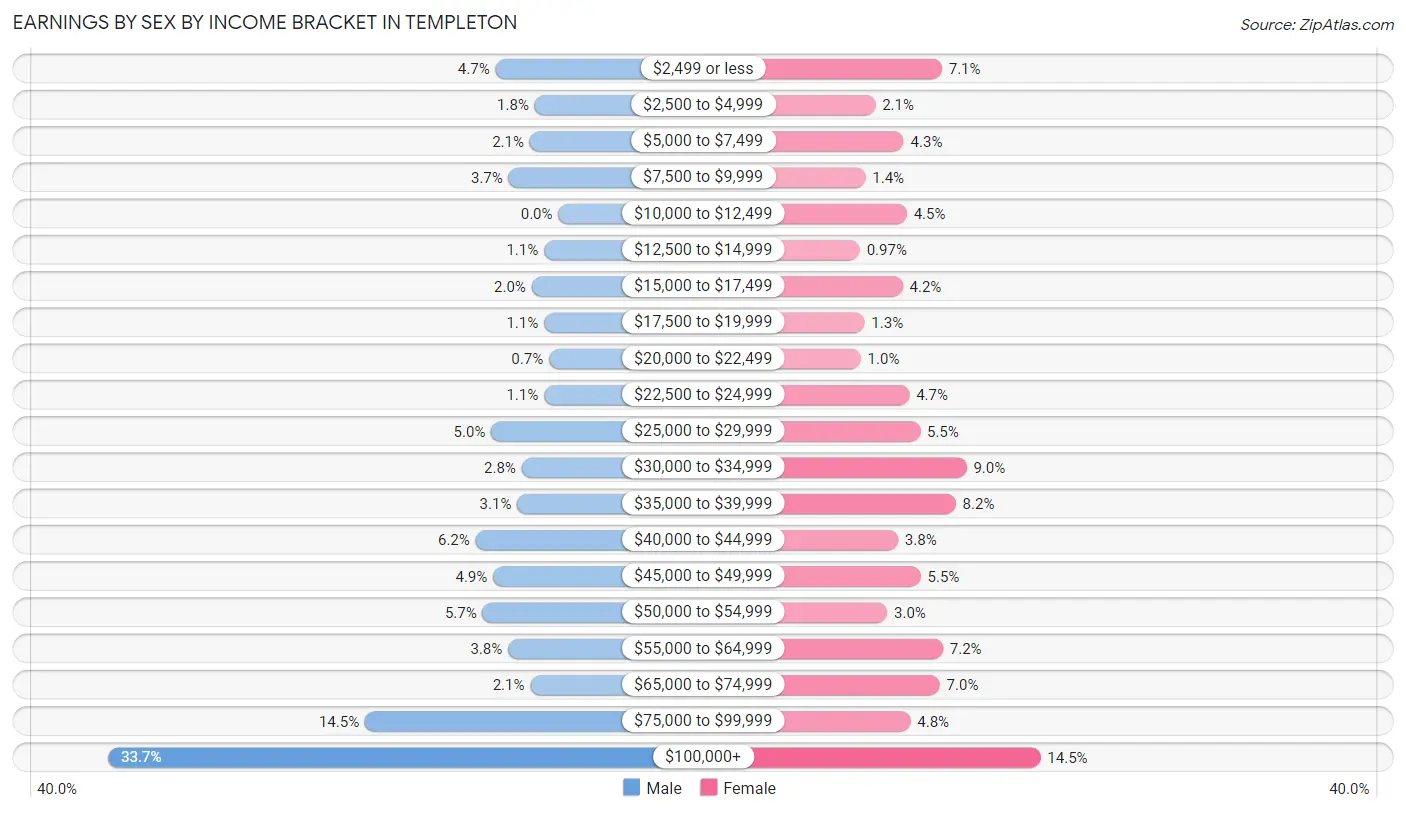
Earnings by Sex by Income Bracket in Templeton
The most common earnings brackets in Templeton are $100,000+ for men (724 | 33.7%) and $100,000+ for women (375 | 14.5%).
| Income | Male | Female |
| $2,499 or less | 101 (4.7%) | 184 (7.1%) |
| $2,500 to $4,999 | 38 (1.8%) | 55 (2.1%) |
| $5,000 to $7,499 | 46 (2.1%) | 110 (4.3%) |
| $7,500 to $9,999 | 80 (3.7%) | 36 (1.4%) |
| $10,000 to $12,499 | 0 (0.0%) | 116 (4.5%) |
| $12,500 to $14,999 | 23 (1.1%) | 25 (1.0%) |
| $15,000 to $17,499 | 43 (2.0%) | 108 (4.2%) |
| $17,500 to $19,999 | 23 (1.1%) | 34 (1.3%) |
| $20,000 to $22,499 | 15 (0.7%) | 27 (1.0%) |
| $22,500 to $24,999 | 23 (1.1%) | 121 (4.7%) |
| $25,000 to $29,999 | 108 (5.0%) | 142 (5.5%) |
| $30,000 to $34,999 | 59 (2.8%) | 232 (9.0%) |
| $35,000 to $39,999 | 66 (3.1%) | 211 (8.2%) |
| $40,000 to $44,999 | 133 (6.2%) | 99 (3.8%) |
| $45,000 to $49,999 | 105 (4.9%) | 143 (5.5%) |
| $50,000 to $54,999 | 122 (5.7%) | 78 (3.0%) |
| $55,000 to $64,999 | 81 (3.8%) | 186 (7.2%) |
| $65,000 to $74,999 | 45 (2.1%) | 180 (7.0%) |
| $75,000 to $99,999 | 311 (14.5%) | 123 (4.8%) |
| $100,000+ | 724 (33.7%) | 375 (14.5%) |
| Total | 2,146 (100.0%) | 2,585 (100.0%) |
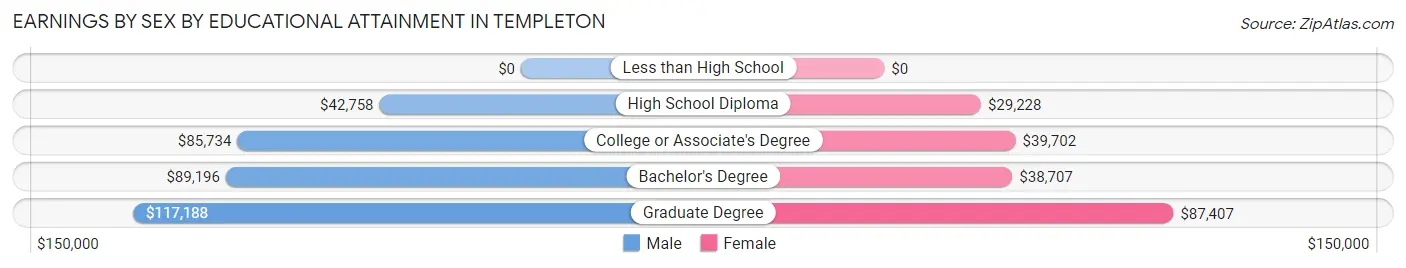
Earnings by Sex by Educational Attainment in Templeton
Average earnings in Templeton are $79,219 for men and $40,345 for women, a difference of 49.1%. Men with an educational attainment of graduate degree enjoy the highest average annual earnings of $117,188, while those with high school diploma education earn the least with $42,758. Women with an educational attainment of graduate degree earn the most with the average annual earnings of $87,407, while those with high school diploma education have the smallest earnings of $29,228.
| Educational Attainment | Male Income | Female Income |
| Less than High School | - | - |
| High School Diploma | $42,758 | $29,228 |
| College or Associate's Degree | $85,734 | $39,702 |
| Bachelor's Degree | $89,196 | $38,707 |
| Graduate Degree | $117,188 | $87,407 |
| Total | $79,219 | $40,345 |
Family Income in Templeton
Family Income Brackets in Templeton
According to the Templeton family income data, there are 864 families falling into the $150,000 to $199,999 income range, which is the most common income bracket and makes up 34.0% of all families.
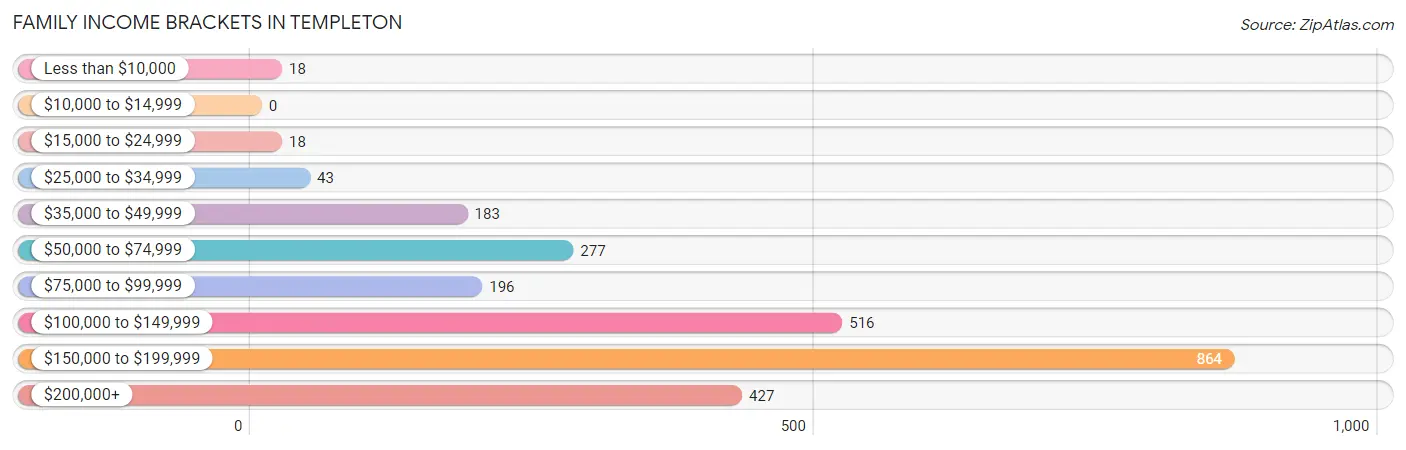
| Income Bracket | # Families | % Families |
| Less than $10,000 | 18 | 0.7% |
| $10,000 to $14,999 | 0 | 0.0% |
| $15,000 to $24,999 | 18 | 0.7% |
| $25,000 to $34,999 | 43 | 1.7% |
| $35,000 to $49,999 | 183 | 7.2% |
| $50,000 to $74,999 | 277 | 10.9% |
| $75,000 to $99,999 | 196 | 7.7% |
| $100,000 to $149,999 | 516 | 20.3% |
| $150,000 to $199,999 | 864 | 34.0% |
| $200,000+ | 427 | 16.8% |
Family Income by Famaliy Size in Templeton
4-person families (393 | 15.5%) account for the highest median family income in Templeton with $165,417 per family, while 2-person families (1,430 | 56.3%) have the highest median income of $70,662 per family member.
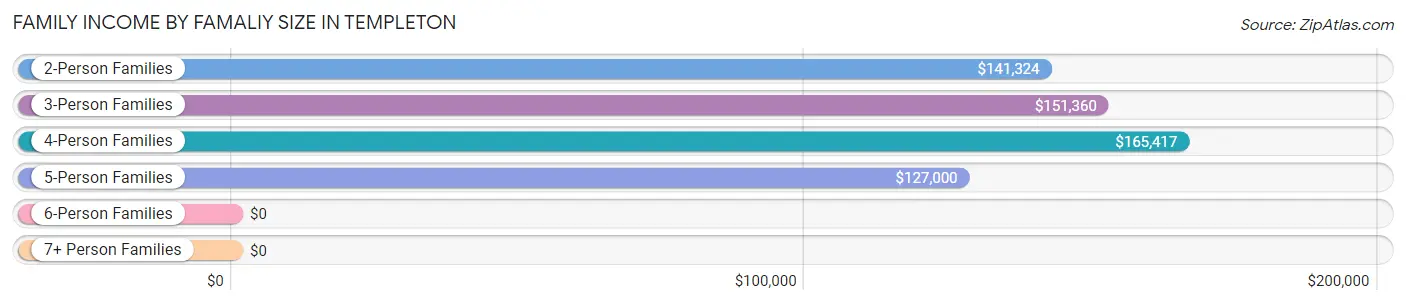
| Income Bracket | # Families | Median Income |
| 2-Person Families | 1,430 (56.3%) | $141,324 |
| 3-Person Families | 545 (21.4%) | $151,360 |
| 4-Person Families | 393 (15.5%) | $165,417 |
| 5-Person Families | 152 (6.0%) | $127,000 |
| 6-Person Families | 21 (0.8%) | $0 |
| 7+ Person Families | 0 (0.0%) | $0 |
| Total | 2,541 (100.0%) | $150,423 |
Family Income by Number of Earners in Templeton
The median family income in Templeton is $150,423, with families comprising 3+ earners (241) having the highest median family income of $198,790, while families with 1 earner (649) have the lowest median family income of $79,653, accounting for 9.5% and 25.5% of families, respectively.
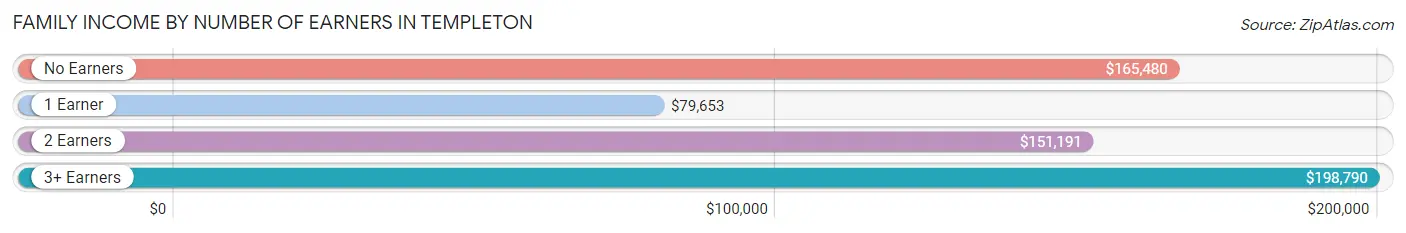
| Number of Earners | # Families | Median Income |
| No Earners | 466 (18.3%) | $165,480 |
| 1 Earner | 649 (25.5%) | $79,653 |
| 2 Earners | 1,185 (46.6%) | $151,191 |
| 3+ Earners | 241 (9.5%) | $198,790 |
| Total | 2,541 (100.0%) | $150,423 |
Household Income in Templeton
Household Income Brackets in Templeton
With 830 households falling in the category, the $150,000 to $199,999 income range is the most frequent in Templeton, accounting for 24.9% of all households. In contrast, only 67 households (2.0%) fall into the $15,000 to $24,999 income bracket, making it the least populous group.
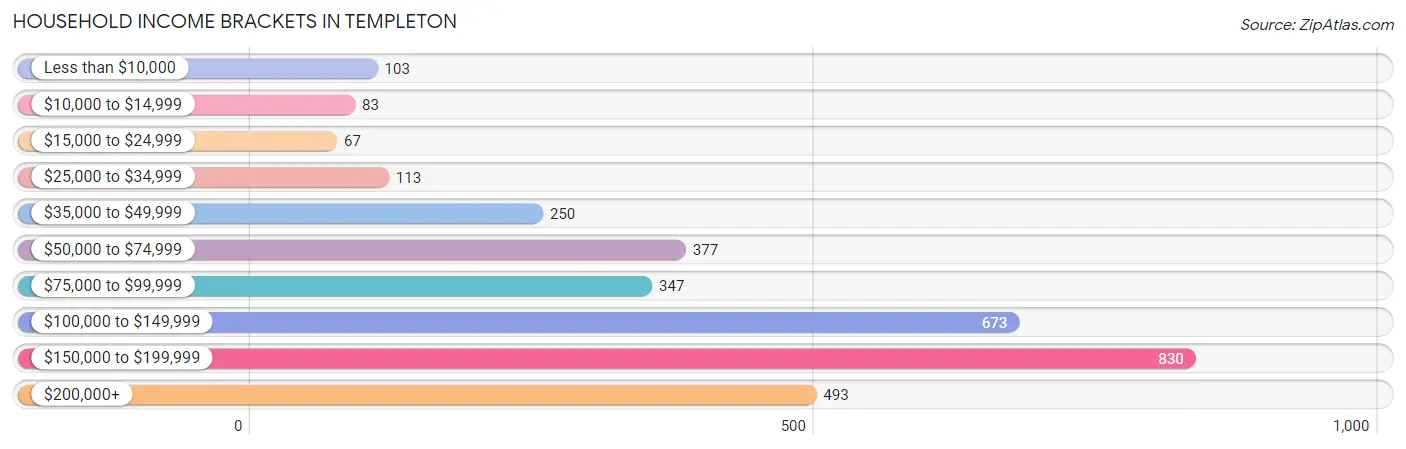
| Income Bracket | # Households | % Households |
| Less than $10,000 | 103 | 3.1% |
| $10,000 to $14,999 | 83 | 2.5% |
| $15,000 to $24,999 | 67 | 2.0% |
| $25,000 to $34,999 | 113 | 3.4% |
| $35,000 to $49,999 | 250 | 7.5% |
| $50,000 to $74,999 | 377 | 11.3% |
| $75,000 to $99,999 | 347 | 10.4% |
| $100,000 to $149,999 | 673 | 20.2% |
| $150,000 to $199,999 | 830 | 24.9% |
| $200,000+ | 493 | 14.8% |
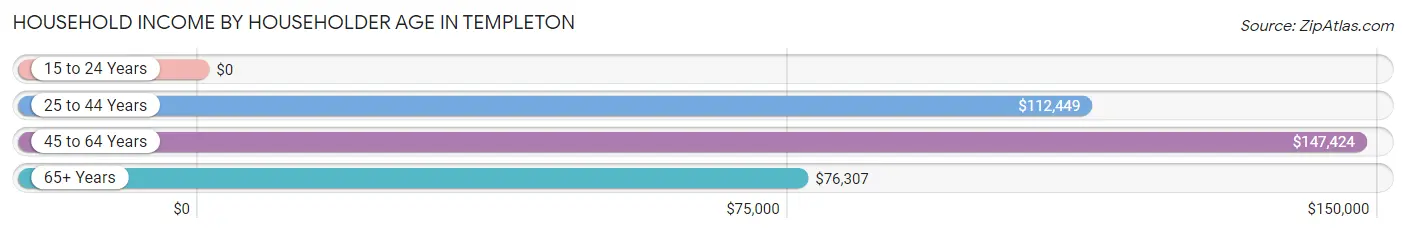
Household Income by Householder Age in Templeton
The median household income in Templeton is $116,316, with the highest median household income of $147,424 found in the 45 to 64 years age bracket for the primary householder. A total of 1,340 households (40.2%) fall into this category.
| Income Bracket | # Households | Median Income |
| 15 to 24 Years | 0 (0.0%) | $0 |
| 25 to 44 Years | 903 (27.1%) | $112,449 |
| 45 to 64 Years | 1,340 (40.2%) | $147,424 |
| 65+ Years | 1,091 (32.7%) | $76,307 |
| Total | 3,334 (100.0%) | $116,316 |
Poverty in Templeton
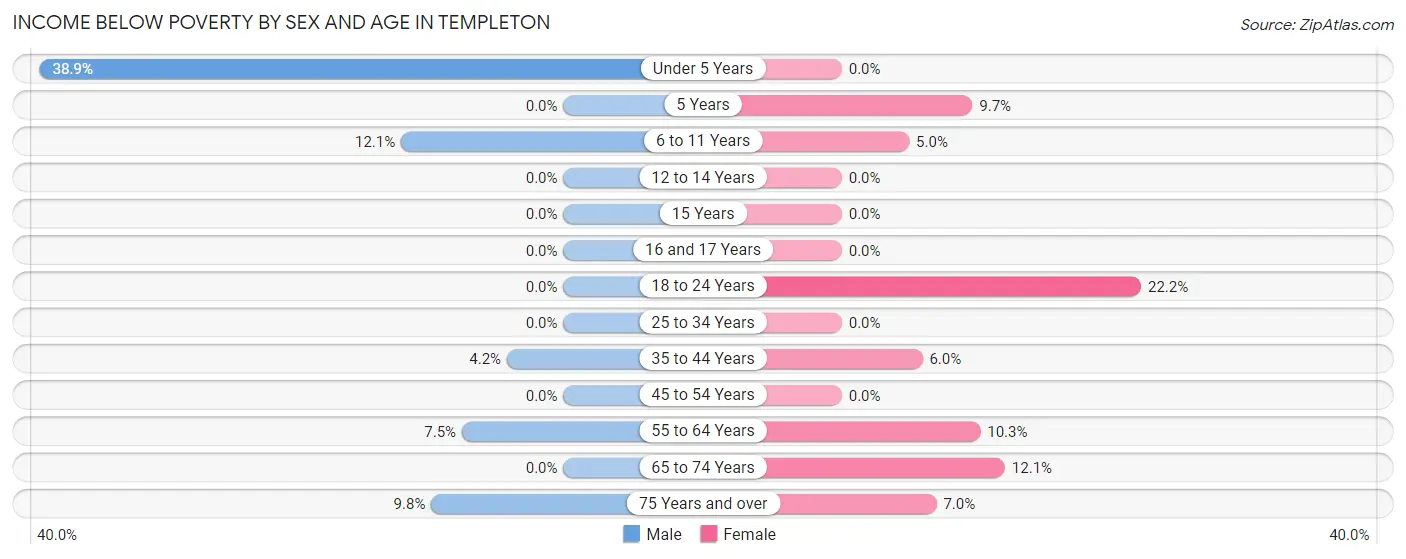
Income Below Poverty by Sex and Age in Templeton
With 5.1% poverty level for males and 5.7% for females among the residents of Templeton, under 5 year old males and 18 to 24 year old females are the most vulnerable to poverty, with 35 males (38.9%) and 48 females (22.2%) in their respective age groups living below the poverty level.
| Age Bracket | Male | Female |
| Under 5 Years | 35 (38.9%) | 0 (0.0%) |
| 5 Years | 0 (0.0%) | 19 (9.7%) |
| 6 to 11 Years | 37 (12.0%) | 19 (5.0%) |
| 12 to 14 Years | 0 (0.0%) | 0 (0.0%) |
| 15 Years | 0 (0.0%) | 0 (0.0%) |
| 16 and 17 Years | 0 (0.0%) | 0 (0.0%) |
| 18 to 24 Years | 0 (0.0%) | 48 (22.2%) |
| 25 to 34 Years | 0 (0.0%) | 0 (0.0%) |
| 35 to 44 Years | 20 (4.2%) | 38 (6.0%) |
| 45 to 54 Years | 0 (0.0%) | 0 (0.0%) |
| 55 to 64 Years | 54 (7.5%) | 70 (10.3%) |
| 65 to 74 Years | 0 (0.0%) | 43 (12.1%) |
| 75 Years and over | 47 (9.8%) | 32 (7.0%) |
| Total | 193 (5.1%) | 269 (5.7%) |
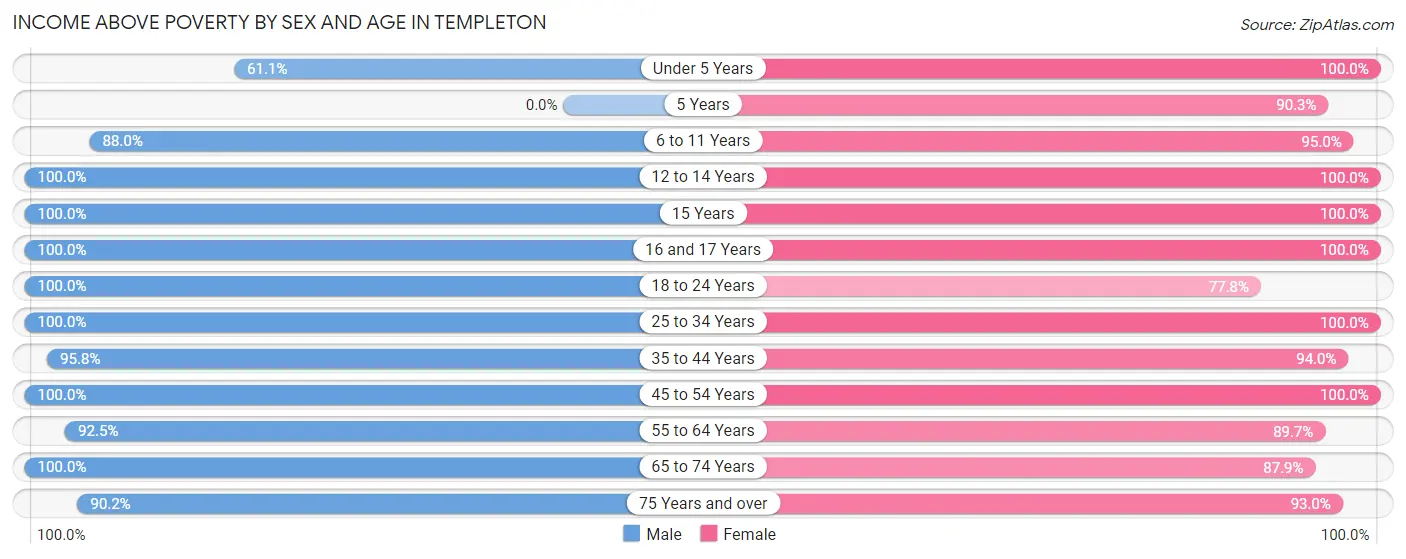
Income Above Poverty by Sex and Age in Templeton
According to the poverty statistics in Templeton, males aged 12 to 14 years and females aged under 5 years are the age groups that are most secure financially, with 100.0% of males and 100.0% of females in these age groups living above the poverty line.
| Age Bracket | Male | Female |
| Under 5 Years | 55 (61.1%) | 149 (100.0%) |
| 5 Years | 0 (0.0%) | 177 (90.3%) |
| 6 to 11 Years | 270 (87.9%) | 361 (95.0%) |
| 12 to 14 Years | 253 (100.0%) | 252 (100.0%) |
| 15 Years | 69 (100.0%) | 8 (100.0%) |
| 16 and 17 Years | 101 (100.0%) | 186 (100.0%) |
| 18 to 24 Years | 52 (100.0%) | 168 (77.8%) |
| 25 to 34 Years | 502 (100.0%) | 472 (100.0%) |
| 35 to 44 Years | 457 (95.8%) | 596 (94.0%) |
| 45 to 54 Years | 372 (100.0%) | 710 (100.0%) |
| 55 to 64 Years | 663 (92.5%) | 611 (89.7%) |
| 65 to 74 Years | 394 (100.0%) | 312 (87.9%) |
| 75 Years and over | 432 (90.2%) | 423 (93.0%) |
| Total | 3,620 (94.9%) | 4,425 (94.3%) |
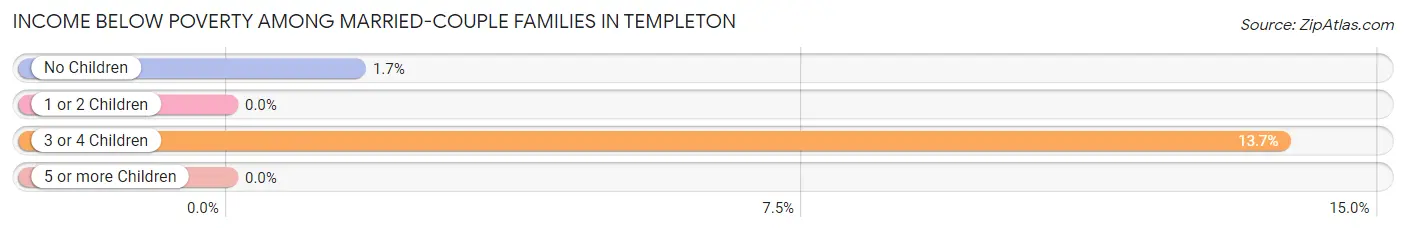
Income Below Poverty Among Married-Couple Families in Templeton
The poverty statistics for married-couple families in Templeton show that 2.0% or 37 of the total 1,844 families live below the poverty line. Families with 3 or 4 children have the highest poverty rate of 13.7%, comprising of 18 families. On the other hand, families with 1 or 2 children have the lowest poverty rate of 0.0%, which includes 0 families.
| Children | Above Poverty | Below Poverty |
| No Children | 1,117 (98.3%) | 19 (1.7%) |
| 1 or 2 Children | 577 (100.0%) | 0 (0.0%) |
| 3 or 4 Children | 113 (86.3%) | 18 (13.7%) |
| 5 or more Children | 0 (0.0%) | 0 (0.0%) |
| Total | 1,807 (98.0%) | 37 (2.0%) |
Income Below Poverty Among Single-Parent Households in Templeton
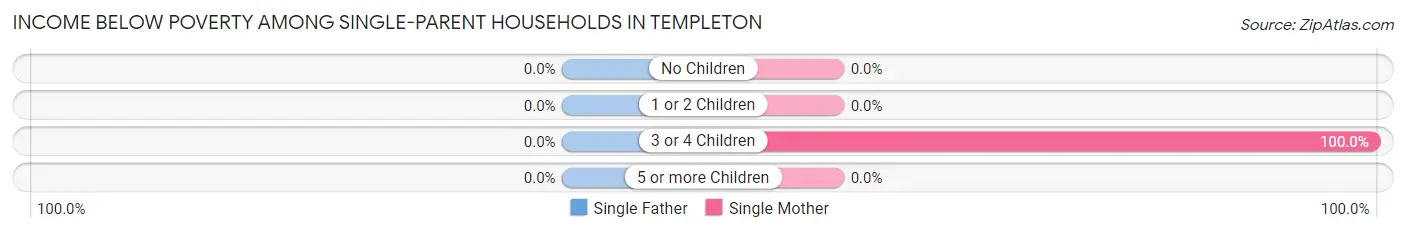
| Children | Single Father | Single Mother |
| No Children | 0 (0.0%) | 0 (0.0%) |
| 1 or 2 Children | 0 (0.0%) | 0 (0.0%) |
| 3 or 4 Children | 0 (0.0%) | 20 (100.0%) |
| 5 or more Children | 0 (0.0%) | 0 (0.0%) |
| Total | 0 (0.0%) | 20 (3.7%) |
Income Below Poverty Among Married-Couple vs Single-Parent Households in Templeton
The poverty data for Templeton shows that 37 of the married-couple family households (2.0%) and 20 of the single-parent households (2.9%) are living below the poverty level. Within the married-couple family households, those with 3 or 4 children have the highest poverty rate, with 18 households (13.7%) falling below the poverty line. Among the single-parent households, those with 3 or 4 children have the highest poverty rate, with 20 household (100.0%) living below poverty.
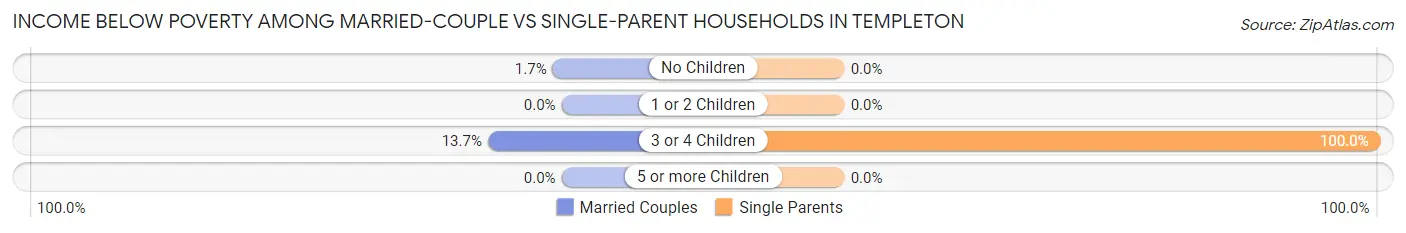
| Children | Married-Couple Families | Single-Parent Households |
| No Children | 19 (1.7%) | 0 (0.0%) |
| 1 or 2 Children | 0 (0.0%) | 0 (0.0%) |
| 3 or 4 Children | 18 (13.7%) | 20 (100.0%) |
| 5 or more Children | 0 (0.0%) | 0 (0.0%) |
| Total | 37 (2.0%) | 20 (2.9%) |
Race in Templeton
The most populous races in Templeton are White / Caucasian (7,058 | 81.9%), Hispanic or Latino (1,432 | 16.6%), and Two or more Races (1,312 | 15.2%).
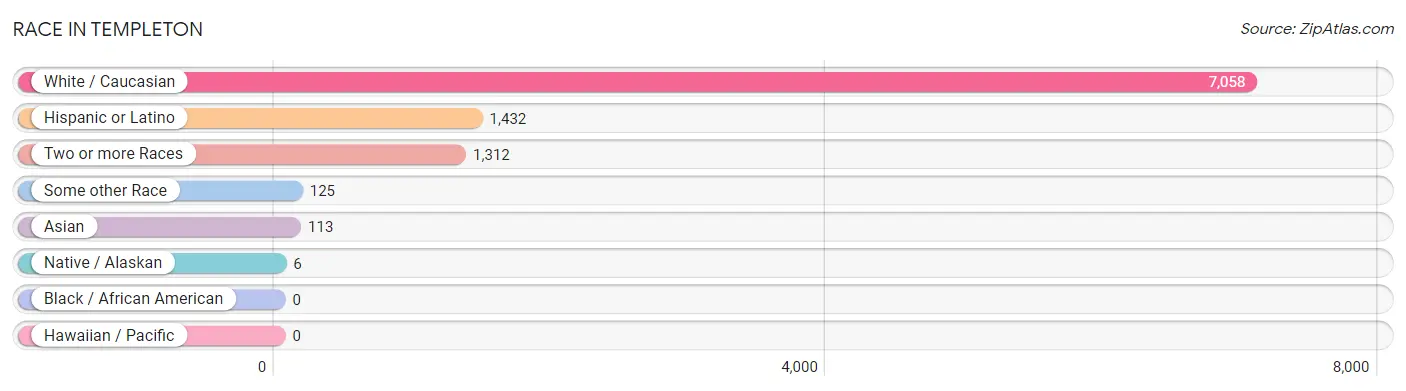
| Race | # Population | % Population |
| Asian | 113 | 1.3% |
| Black / African American | 0 | 0.0% |
| Hawaiian / Pacific | 0 | 0.0% |
| Hispanic or Latino | 1,432 | 16.6% |
| Native / Alaskan | 6 | 0.1% |
| White / Caucasian | 7,058 | 81.9% |
| Two or more Races | 1,312 | 15.2% |
| Some other Race | 125 | 1.5% |
| Total | 8,614 | 100.0% |
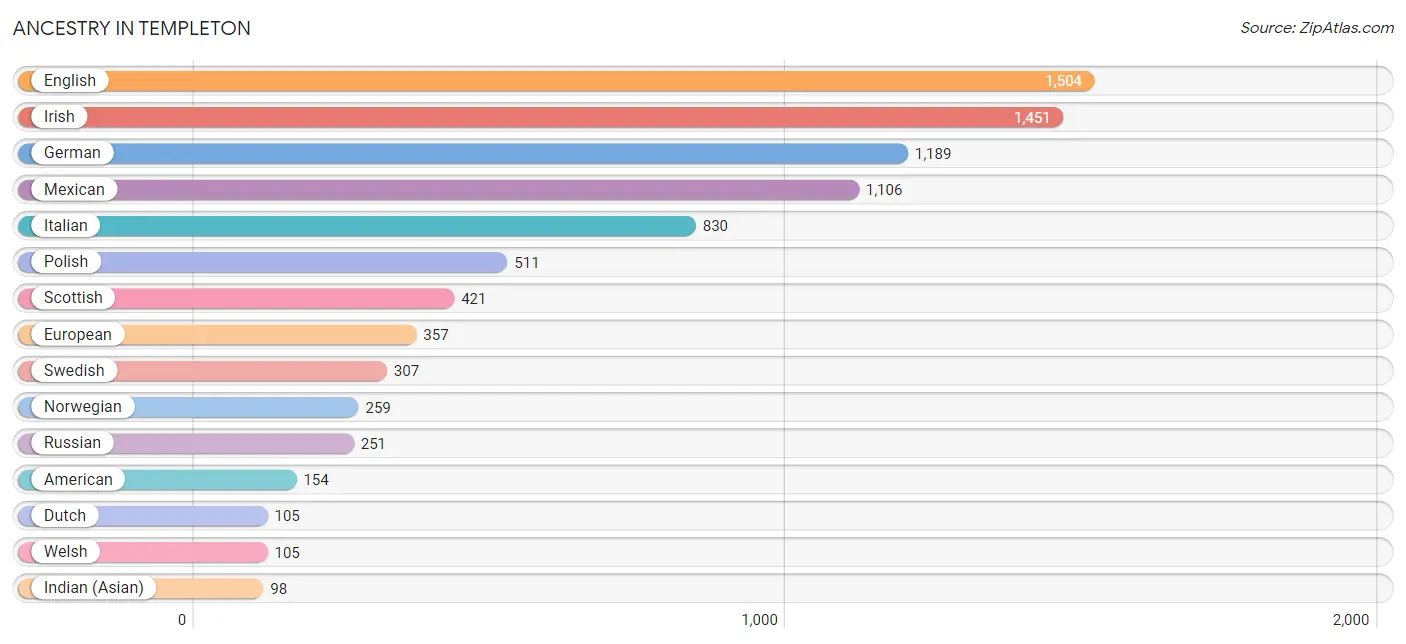
Ancestry in Templeton
The most populous ancestries reported in Templeton are English (1,504 | 17.5%), Irish (1,451 | 16.8%), German (1,189 | 13.8%), Mexican (1,106 | 12.8%), and Italian (830 | 9.6%), together accounting for 70.6% of all Templeton residents.
| Ancestry | # Population | % Population |
| Albanian | 15 | 0.2% |
| American | 154 | 1.8% |
| Apache | 1 | 0.0% |
| Arab | 18 | 0.2% |
| Austrian | 96 | 1.1% |
| Bhutanese | 46 | 0.5% |
| British | 61 | 0.7% |
| Burmese | 27 | 0.3% |
| Canadian | 8 | 0.1% |
| Central American | 9 | 0.1% |
| Colombian | 11 | 0.1% |
| Croatian | 61 | 0.7% |
| Czech | 86 | 1.0% |
| Danish | 73 | 0.9% |
| Dutch | 105 | 1.2% |
| Eastern European | 14 | 0.2% |
| English | 1,504 | 17.5% |
| European | 357 | 4.1% |
| Finnish | 21 | 0.2% |
| French | 85 | 1.0% |
| French Canadian | 68 | 0.8% |
| German | 1,189 | 13.8% |
| Greek | 1 | 0.0% |
| Hungarian | 7 | 0.1% |
| Indian (Asian) | 98 | 1.1% |
| Irish | 1,451 | 16.8% |
| Italian | 830 | 9.6% |
| Korean | 91 | 1.1% |
| Laotian | 47 | 0.5% |
| Latvian | 17 | 0.2% |
| Lebanese | 17 | 0.2% |
| Lithuanian | 50 | 0.6% |
| Mexican | 1,106 | 12.8% |
| Northern European | 35 | 0.4% |
| Norwegian | 259 | 3.0% |
| Palestinian | 1 | 0.0% |
| Polish | 511 | 5.9% |
| Portuguese | 46 | 0.5% |
| Romanian | 13 | 0.2% |
| Russian | 251 | 2.9% |
| Salvadoran | 9 | 0.1% |
| Scandinavian | 23 | 0.3% |
| Scotch-Irish | 57 | 0.7% |
| Scottish | 421 | 4.9% |
| Slovak | 13 | 0.2% |
| South African | 77 | 0.9% |
| South American | 49 | 0.6% |
| Spaniard | 61 | 0.7% |
| Spanish | 90 | 1.0% |
| Sri Lankan | 44 | 0.5% |
| Subsaharan African | 77 | 0.9% |
| Swedish | 307 | 3.6% |
| Swiss | 50 | 0.6% |
| Thai | 1 | 0.0% |
| Ukrainian | 50 | 0.6% |
| Welsh | 105 | 1.2% | View All 56 Rows |
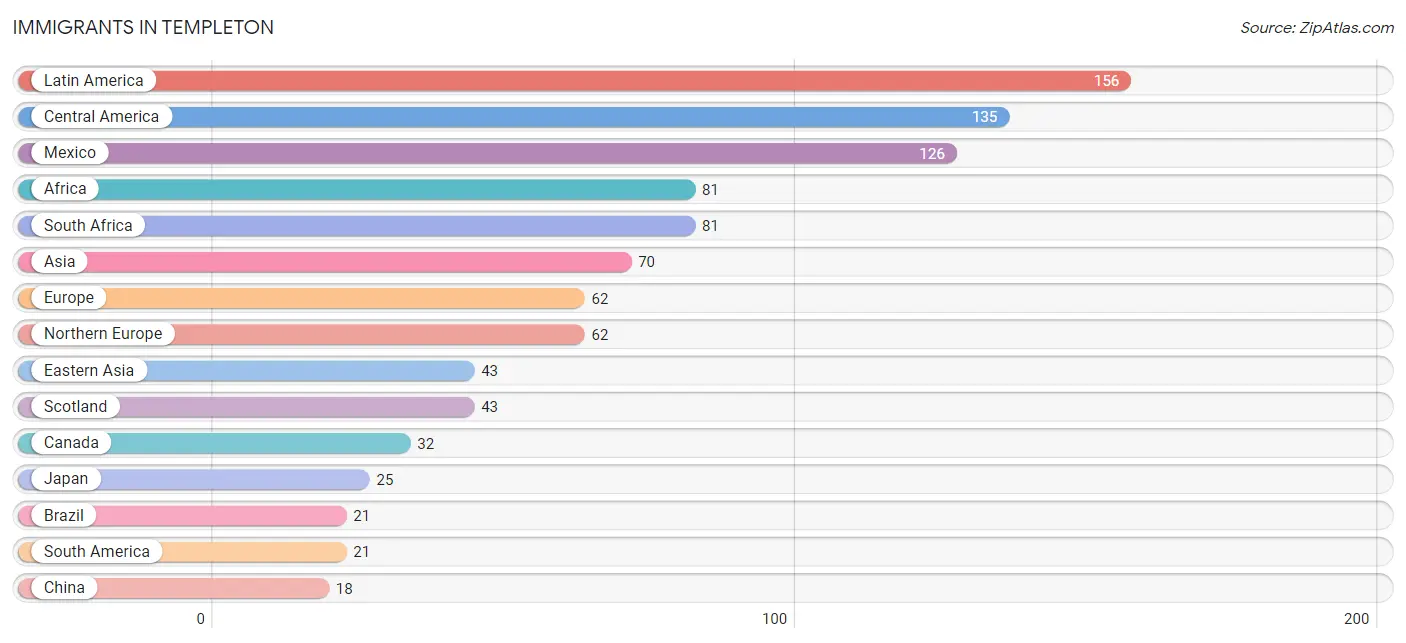
Immigrants in Templeton
The most numerous immigrant groups reported in Templeton came from Latin America (156 | 1.8%), Central America (135 | 1.6%), Mexico (126 | 1.5%), Africa (81 | 0.9%), and South Africa (81 | 0.9%), together accounting for 6.7% of all Templeton residents.
| Immigration Origin | # Population | % Population |
| Africa | 81 | 0.9% |
| Asia | 70 | 0.8% |
| Australia | 15 | 0.2% |
| Brazil | 21 | 0.2% |
| Canada | 32 | 0.4% |
| Central America | 135 | 1.6% |
| China | 18 | 0.2% |
| Eastern Asia | 43 | 0.5% |
| El Salvador | 9 | 0.1% |
| Europe | 62 | 0.7% |
| India | 12 | 0.1% |
| Ireland | 8 | 0.1% |
| Japan | 25 | 0.3% |
| Latin America | 156 | 1.8% |
| Mexico | 126 | 1.5% |
| Northern Europe | 62 | 0.7% |
| Oceania | 15 | 0.2% |
| Scotland | 43 | 0.5% |
| South Africa | 81 | 0.9% |
| South America | 21 | 0.2% |
| South Central Asia | 12 | 0.1% |
| South Eastern Asia | 15 | 0.2% |
| Vietnam | 15 | 0.2% | View All 23 Rows |
Sex and Age in Templeton
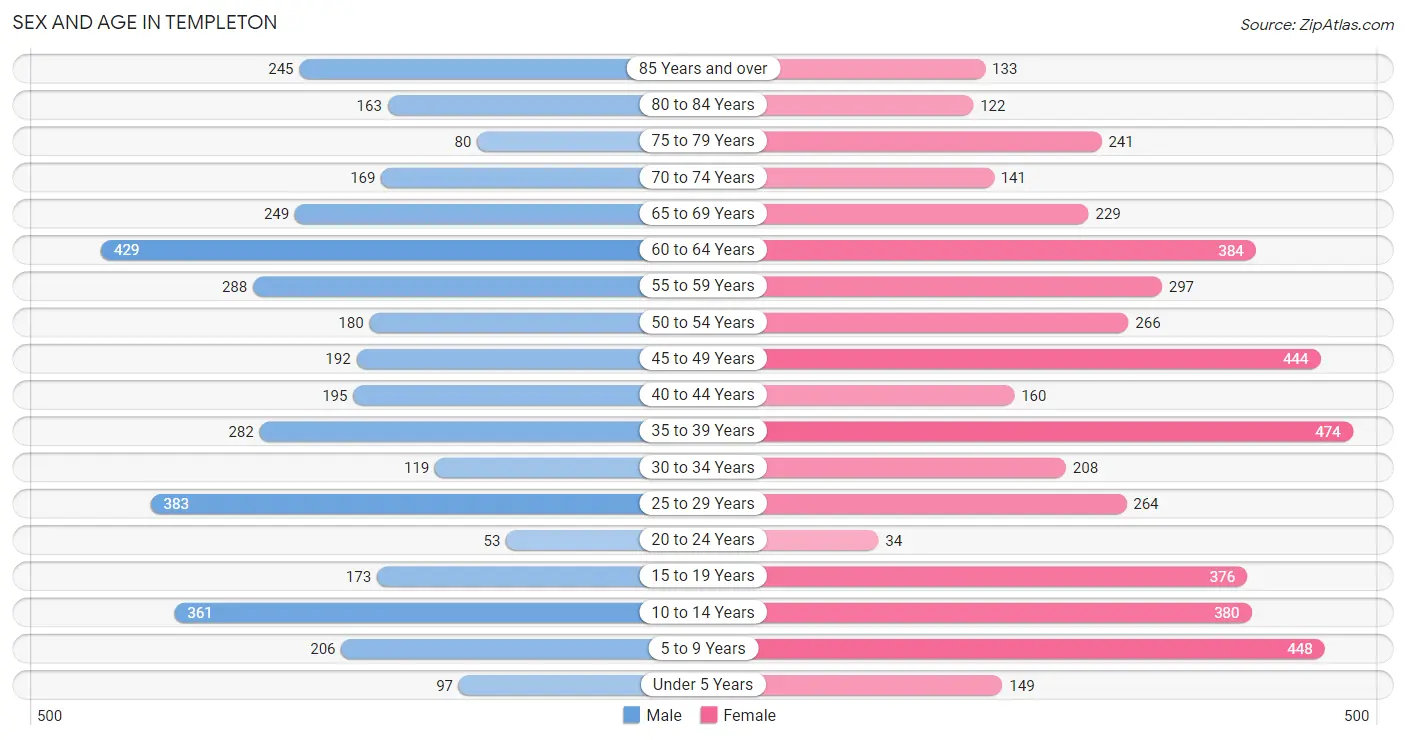
Sex and Age in Templeton
The most populous age groups in Templeton are 60 to 64 Years (429 | 11.1%) for men and 35 to 39 Years (474 | 10.0%) for women.
| Age Bracket | Male | Female |
| Under 5 Years | 97 (2.5%) | 149 (3.1%) |
| 5 to 9 Years | 206 (5.3%) | 448 (9.4%) |
| 10 to 14 Years | 361 (9.3%) | 380 (8.0%) |
| 15 to 19 Years | 173 (4.5%) | 376 (7.9%) |
| 20 to 24 Years | 53 (1.4%) | 34 (0.7%) |
| 25 to 29 Years | 383 (9.9%) | 264 (5.6%) |
| 30 to 34 Years | 119 (3.1%) | 208 (4.4%) |
| 35 to 39 Years | 282 (7.3%) | 474 (10.0%) |
| 40 to 44 Years | 195 (5.1%) | 160 (3.4%) |
| 45 to 49 Years | 192 (5.0%) | 444 (9.3%) |
| 50 to 54 Years | 180 (4.7%) | 266 (5.6%) |
| 55 to 59 Years | 288 (7.4%) | 297 (6.2%) |
| 60 to 64 Years | 429 (11.1%) | 384 (8.1%) |
| 65 to 69 Years | 249 (6.4%) | 229 (4.8%) |
| 70 to 74 Years | 169 (4.4%) | 141 (3.0%) |
| 75 to 79 Years | 80 (2.1%) | 241 (5.1%) |
| 80 to 84 Years | 163 (4.2%) | 122 (2.6%) |
| 85 Years and over | 245 (6.3%) | 133 (2.8%) |
| Total | 3,864 (100.0%) | 4,750 (100.0%) |
Families and Households in Templeton
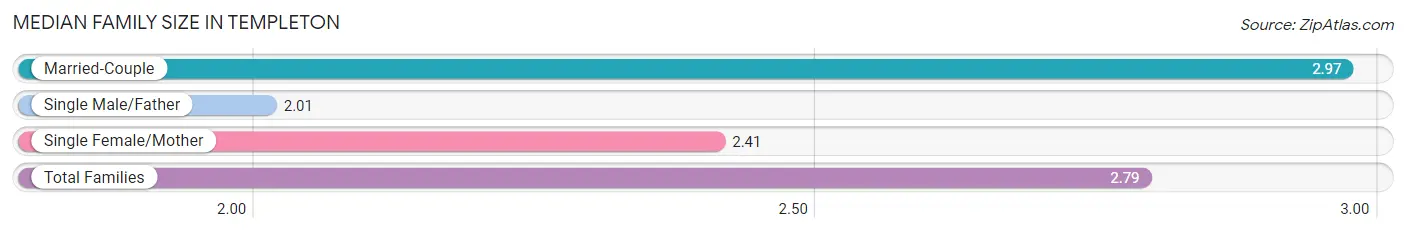
Median Family Size in Templeton
The median family size in Templeton is 2.79 persons per family, with married-couple families (1,844 | 72.6%) accounting for the largest median family size of 2.97 persons per family. On the other hand, single male/father families (155 | 6.1%) represent the smallest median family size with 2.01 persons per family.
| Family Type | # Families | Family Size |
| Married-Couple | 1,844 (72.6%) | 2.97 |
| Single Male/Father | 155 (6.1%) | 2.01 |
| Single Female/Mother | 542 (21.3%) | 2.41 |
| Total Families | 2,541 (100.0%) | 2.79 |
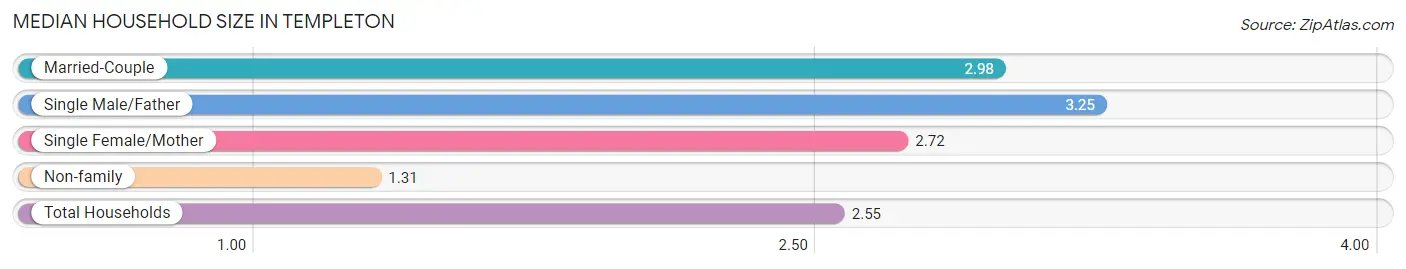
Median Household Size in Templeton
The median household size in Templeton is 2.55 persons per household, with single male/father households (155 | 4.6%) accounting for the largest median household size of 3.25 persons per household. non-family households (793 | 23.8%) represent the smallest median household size with 1.31 persons per household.
| Household Type | # Households | Household Size |
| Married-Couple | 1,844 (55.3%) | 2.98 |
| Single Male/Father | 155 (4.6%) | 3.25 |
| Single Female/Mother | 542 (16.3%) | 2.72 |
| Non-family | 793 (23.8%) | 1.31 |
| Total Households | 3,334 (100.0%) | 2.55 |
Household Size by Marriage Status in Templeton
Out of a total of 3,334 households in Templeton, 2,541 (76.2%) are family households, while 793 (23.8%) are nonfamily households. The most numerous type of family households are 2-person households, comprising 1,163, and the most common type of nonfamily households are 1-person households, comprising 598.
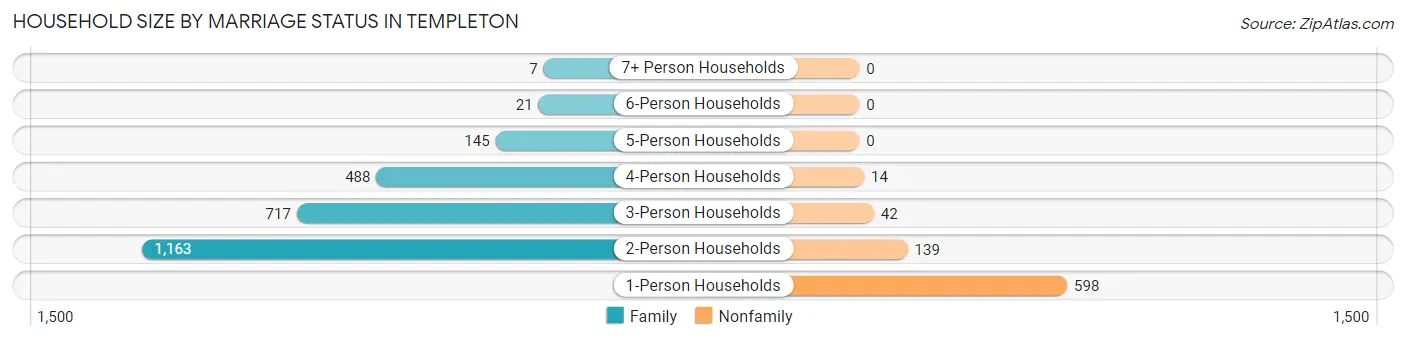
| Household Size | Family Households | Nonfamily Households |
| 1-Person Households | - | 598 (17.9%) |
| 2-Person Households | 1,163 (34.9%) | 139 (4.2%) |
| 3-Person Households | 717 (21.5%) | 42 (1.3%) |
| 4-Person Households | 488 (14.6%) | 14 (0.4%) |
| 5-Person Households | 145 (4.3%) | 0 (0.0%) |
| 6-Person Households | 21 (0.6%) | 0 (0.0%) |
| 7+ Person Households | 7 (0.2%) | 0 (0.0%) |
| Total | 2,541 (76.2%) | 793 (23.8%) |
Female Fertility in Templeton
Fertility by Age in Templeton
| Age Bracket | Women with Births | Births / 1,000 Women |
| 15 to 19 years | 0 (0.0%) | 0.0 |
| 20 to 34 years | 0 (0.0%) | 0.0 |
| 35 to 50 years | 0 (0.0%) | 0.0 |
| Total | 0 (0.0%) | 0.0 |
Fertility by Age by Marriage Status in Templeton
| Age Bracket | Married | Unmarried |
| 15 to 19 years | 0 (0.0%) | 0 (0.0%) |
| 20 to 34 years | 0 (0.0%) | 0 (0.0%) |
| 35 to 50 years | 0 (0.0%) | 0 (0.0%) |
| Total | 0 (0.0%) | 0 (0.0%) |
Fertility by Education in Templeton
| Educational Attainment | Women with Births | Births / 1,000 Women |
| Less than High School | 0 (0.0%) | 0.0 |
| High School Diploma | 0 (0.0%) | 0.0 |
| College or Associate's Degree | 0 (0.0%) | 0.0 |
| Bachelor's Degree | 0 (0.0%) | 0.0 |
| Graduate Degree | 0 (0.0%) | 0.0 |
| Total | 0 (0.0%) | 0.0 |
Fertility by Education by Marriage Status in Templeton
| Educational Attainment | Married | Unmarried |
| Less than High School | 0 (0.0%) | 0 (0.0%) |
| High School Diploma | 0 (0.0%) | 0 (0.0%) |
| College or Associate's Degree | 0 (0.0%) | 0 (0.0%) |
| Bachelor's Degree | 0 (0.0%) | 0 (0.0%) |
| Graduate Degree | 0 (0.0%) | 0 (0.0%) |
| Total | 0 (0.0%) | 0 (0.0%) |
Employment Characteristics in Templeton
Employment by Class of Employer in Templeton
Among the 4,275 employed individuals in Templeton, private company employees (2,689 | 62.9%), self-employed (not incorporated) (514 | 12.0%), and state government employees (393 | 9.2%) make up the most common classes of employment.
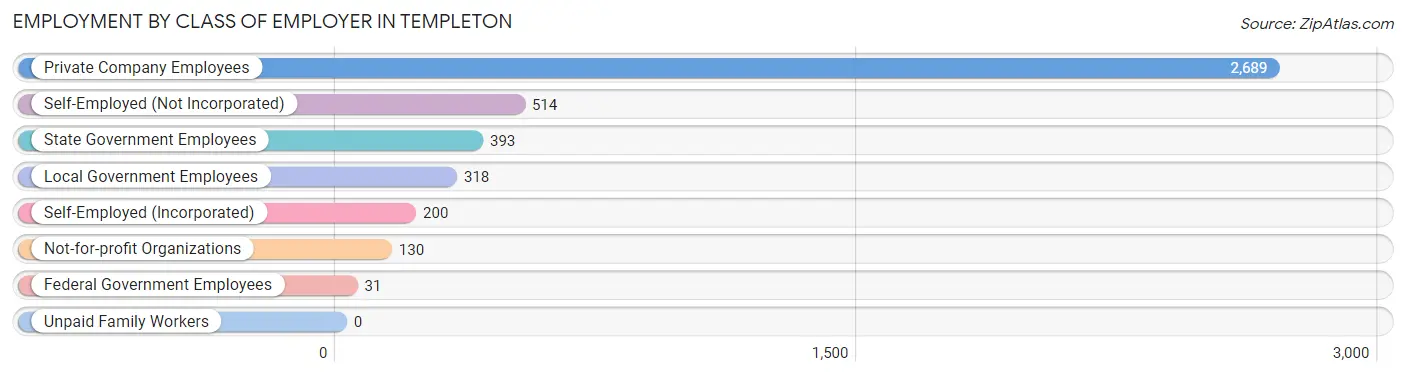
| Employer Class | # Employees | % Employees |
| Private Company Employees | 2,689 | 62.9% |
| Self-Employed (Incorporated) | 200 | 4.7% |
| Self-Employed (Not Incorporated) | 514 | 12.0% |
| Not-for-profit Organizations | 130 | 3.0% |
| Local Government Employees | 318 | 7.4% |
| State Government Employees | 393 | 9.2% |
| Federal Government Employees | 31 | 0.7% |
| Unpaid Family Workers | 0 | 0.0% |
| Total | 4,275 | 100.0% |
Employment Status by Age in Templeton
According to the labor force statistics for Templeton, out of the total population over 16 years of age (6,896), 66.1% or 4,558 individuals are in the labor force, with 5.6% or 255 of them unemployed. The age group with the highest labor force participation rate is 25 to 29 years, with 100.0% or 647 individuals in the labor force. Within the labor force, the 55 to 59 years age range has the highest percentage of unemployed individuals, with 12.8% or 66 of them being unemployed.
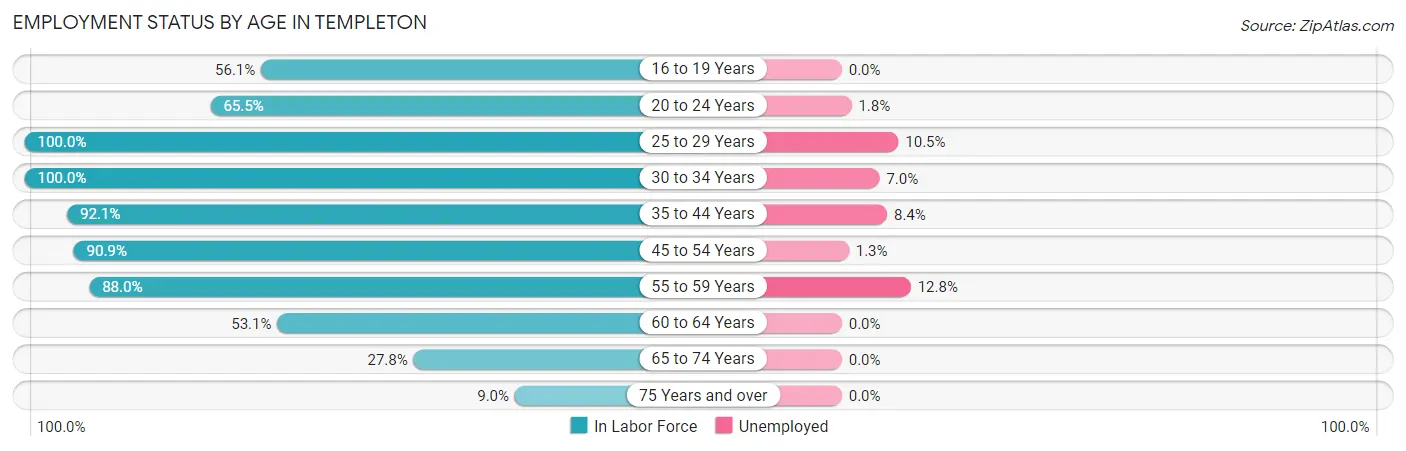
| Age Bracket | In Labor Force | Unemployed |
| 16 to 19 Years | 265 (56.1%) | 0 (0.0%) |
| 20 to 24 Years | 57 (65.5%) | 1 (1.8%) |
| 25 to 29 Years | 647 (100.0%) | 68 (10.5%) |
| 30 to 34 Years | 327 (100.0%) | 23 (7.0%) |
| 35 to 44 Years | 1,023 (92.1%) | 86 (8.4%) |
| 45 to 54 Years | 984 (90.9%) | 13 (1.3%) |
| 55 to 59 Years | 515 (88.0%) | 66 (12.8%) |
| 60 to 64 Years | 432 (53.1%) | 0 (0.0%) |
| 65 to 74 Years | 219 (27.8%) | 0 (0.0%) |
| 75 Years and over | 89 (9.0%) | 0 (0.0%) |
| Total | 4,558 (66.1%) | 255 (5.6%) |
Employment Status by Educational Attainment in Templeton
According to labor force statistics for Templeton, 86.0% of individuals (3,926) out of the total population between 25 and 64 years of age (4,565) are in the labor force, with 6.5% or 255 of them being unemployed. The group with the highest labor force participation rate are those with the educational attainment of high school diploma, with 88.3% or 460 individuals in the labor force. Within the labor force, individuals with less than high school education have the highest percentage of unemployment, with 22.5% or 23 of them being unemployed.
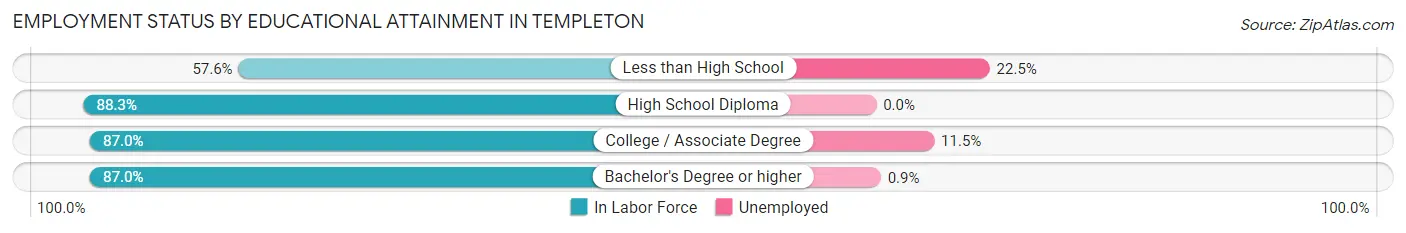
| Educational Attainment | In Labor Force | Unemployed |
| Less than High School | 102 (57.6%) | 40 (22.5%) |
| High School Diploma | 460 (88.3%) | 0 (0.0%) |
| College / Associate Degree | 1,909 (87.0%) | 252 (11.5%) |
| Bachelor's Degree or higher | 1,456 (87.0%) | 15 (0.9%) |
| Total | 3,926 (86.0%) | 297 (6.5%) |
Employment Occupations by Sex in Templeton
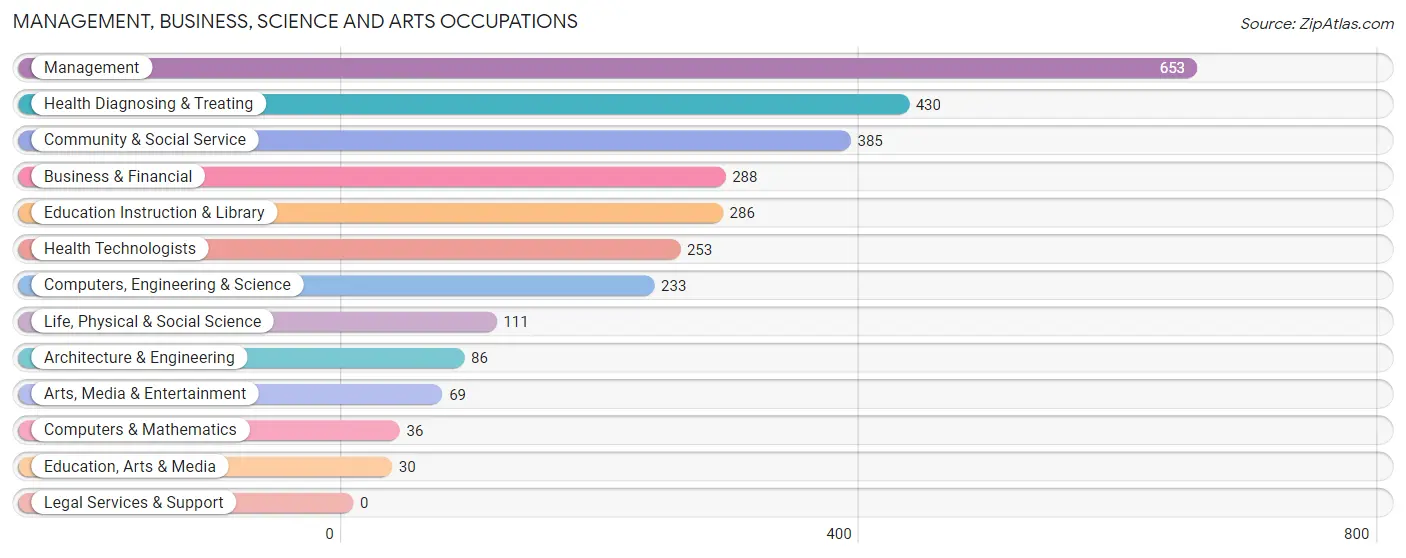
Management, Business, Science and Arts Occupations
The most common Management, Business, Science and Arts occupations in Templeton are Management (653 | 15.2%), Health Diagnosing & Treating (430 | 10.0%), Community & Social Service (385 | 8.9%), Business & Financial (288 | 6.7%), and Education Instruction & Library (286 | 6.7%).
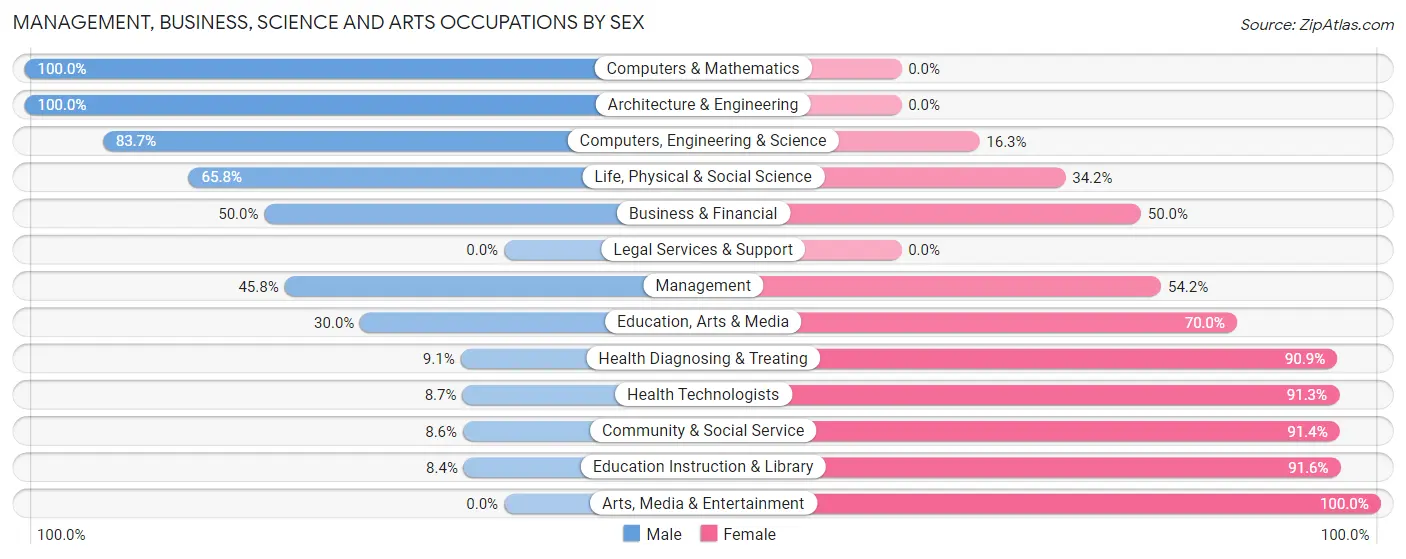
Management, Business, Science and Arts Occupations by Sex
Within the Management, Business, Science and Arts occupations in Templeton, the most male-oriented occupations are Computers & Mathematics (100.0%), Architecture & Engineering (100.0%), and Computers, Engineering & Science (83.7%), while the most female-oriented occupations are Arts, Media & Entertainment (100.0%), Education Instruction & Library (91.6%), and Community & Social Service (91.4%).
| Occupation | Male | Female |
| Management | 299 (45.8%) | 354 (54.2%) |
| Business & Financial | 144 (50.0%) | 144 (50.0%) |
| Computers, Engineering & Science | 195 (83.7%) | 38 (16.3%) |
| Computers & Mathematics | 36 (100.0%) | 0 (0.0%) |
| Architecture & Engineering | 86 (100.0%) | 0 (0.0%) |
| Life, Physical & Social Science | 73 (65.8%) | 38 (34.2%) |
| Community & Social Service | 33 (8.6%) | 352 (91.4%) |
| Education, Arts & Media | 9 (30.0%) | 21 (70.0%) |
| Legal Services & Support | 0 (0.0%) | 0 (0.0%) |
| Education Instruction & Library | 24 (8.4%) | 262 (91.6%) |
| Arts, Media & Entertainment | 0 (0.0%) | 69 (100.0%) |
| Health Diagnosing & Treating | 39 (9.1%) | 391 (90.9%) |
| Health Technologists | 22 (8.7%) | 231 (91.3%) |
| Total (Category) | 710 (35.7%) | 1,279 (64.3%) |
| Total (Overall) | 1,890 (44.0%) | 2,410 (56.0%) |
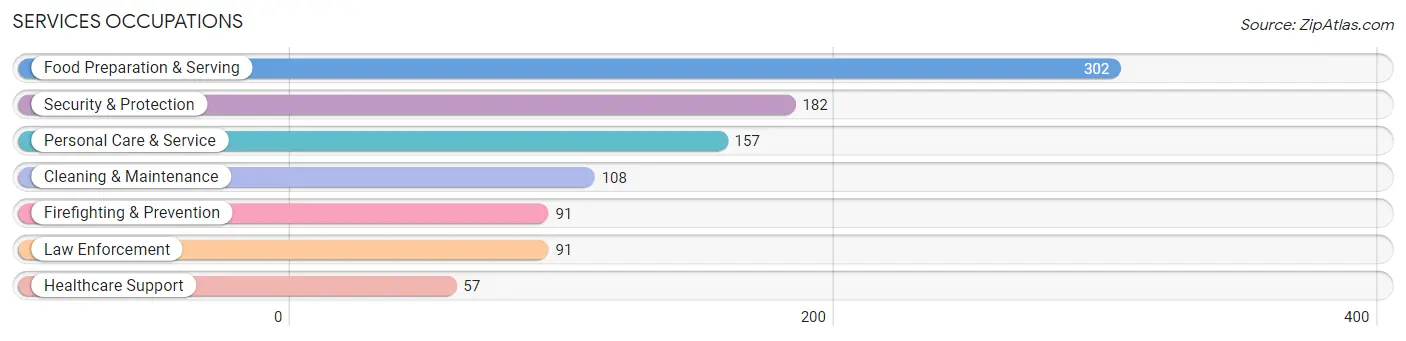
Services Occupations
The most common Services occupations in Templeton are Food Preparation & Serving (302 | 7.0%), Security & Protection (182 | 4.2%), Personal Care & Service (157 | 3.6%), Cleaning & Maintenance (108 | 2.5%), and Firefighting & Prevention (91 | 2.1%).
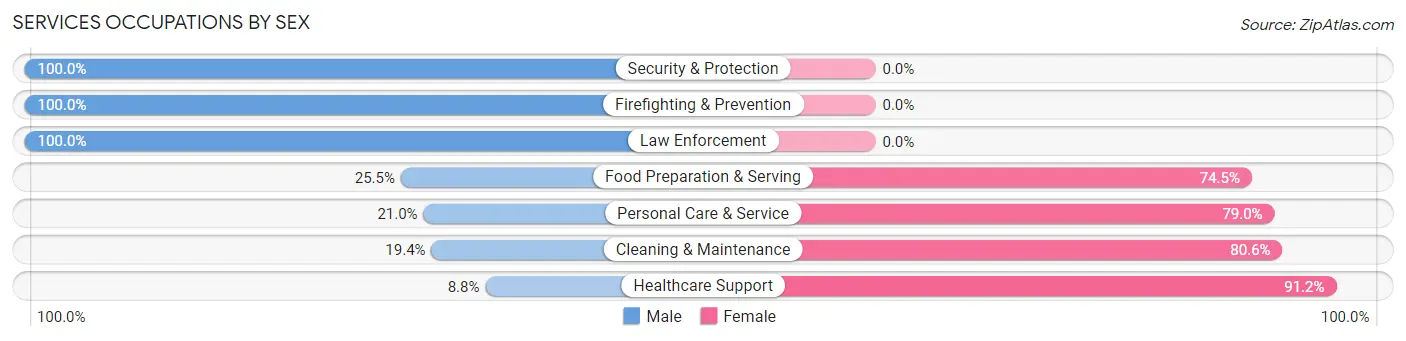
Services Occupations by Sex
Within the Services occupations in Templeton, the most male-oriented occupations are Security & Protection (100.0%), Firefighting & Prevention (100.0%), and Law Enforcement (100.0%), while the most female-oriented occupations are Healthcare Support (91.2%), Cleaning & Maintenance (80.6%), and Personal Care & Service (79.0%).
| Occupation | Male | Female |
| Healthcare Support | 5 (8.8%) | 52 (91.2%) |
| Security & Protection | 182 (100.0%) | 0 (0.0%) |
| Firefighting & Prevention | 91 (100.0%) | 0 (0.0%) |
| Law Enforcement | 91 (100.0%) | 0 (0.0%) |
| Food Preparation & Serving | 77 (25.5%) | 225 (74.5%) |
| Cleaning & Maintenance | 21 (19.4%) | 87 (80.6%) |
| Personal Care & Service | 33 (21.0%) | 124 (79.0%) |
| Total (Category) | 318 (39.5%) | 488 (60.6%) |
| Total (Overall) | 1,890 (44.0%) | 2,410 (56.0%) |
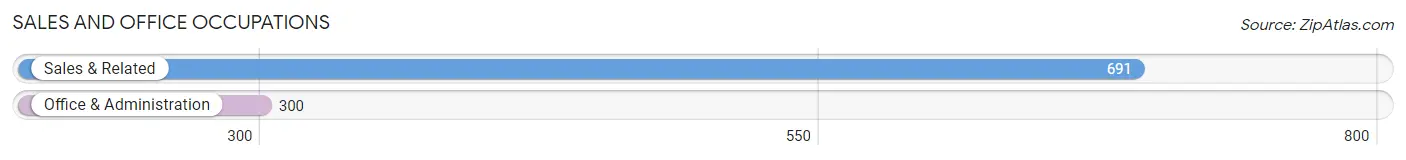
Sales and Office Occupations
The most common Sales and Office occupations in Templeton are Sales & Related (691 | 16.1%), and Office & Administration (300 | 7.0%).
Sales and Office Occupations by Sex
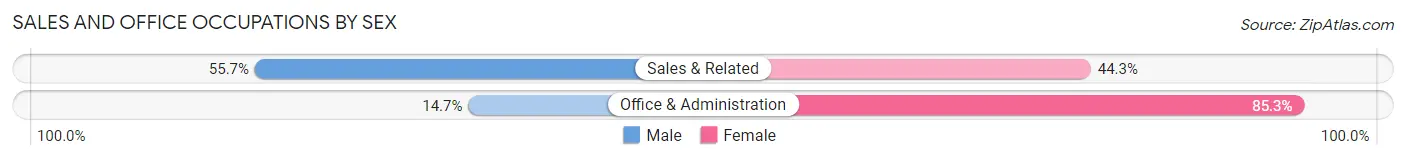
| Occupation | Male | Female |
| Sales & Related | 385 (55.7%) | 306 (44.3%) |
| Office & Administration | 44 (14.7%) | 256 (85.3%) |
| Total (Category) | 429 (43.3%) | 562 (56.7%) |
| Total (Overall) | 1,890 (44.0%) | 2,410 (56.0%) |
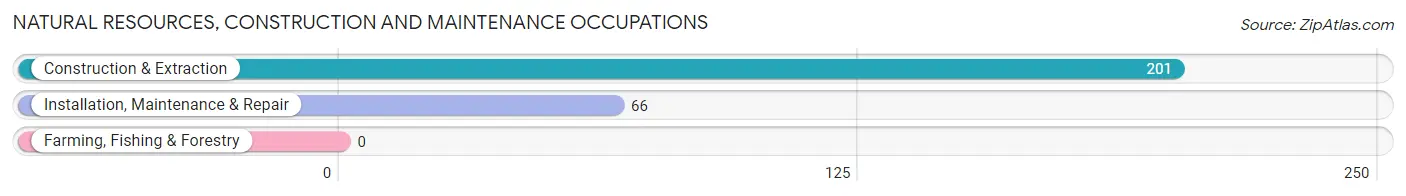
Natural Resources, Construction and Maintenance Occupations
The most common Natural Resources, Construction and Maintenance occupations in Templeton are Construction & Extraction (201 | 4.7%), and Installation, Maintenance & Repair (66 | 1.5%).
Natural Resources, Construction and Maintenance Occupations by Sex
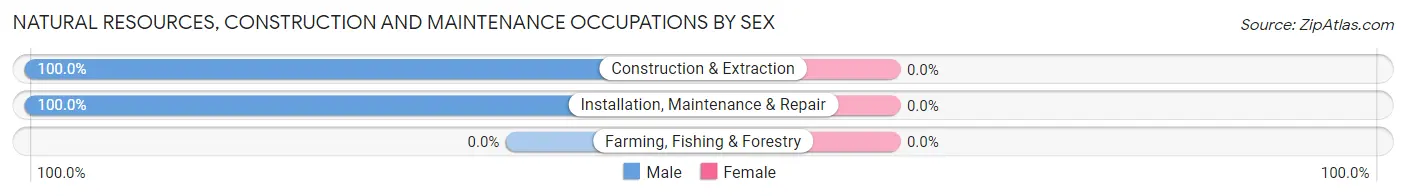
| Occupation | Male | Female |
| Farming, Fishing & Forestry | 0 (0.0%) | 0 (0.0%) |
| Construction & Extraction | 201 (100.0%) | 0 (0.0%) |
| Installation, Maintenance & Repair | 66 (100.0%) | 0 (0.0%) |
| Total (Category) | 267 (100.0%) | 0 (0.0%) |
| Total (Overall) | 1,890 (44.0%) | 2,410 (56.0%) |
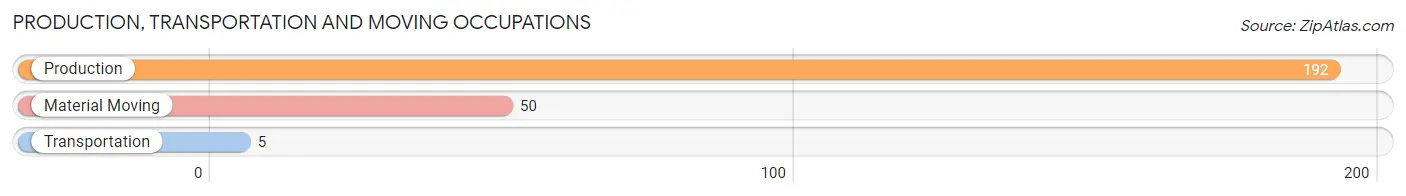
Production, Transportation and Moving Occupations
The most common Production, Transportation and Moving occupations in Templeton are Production (192 | 4.5%), Material Moving (50 | 1.2%), and Transportation (5 | 0.1%).
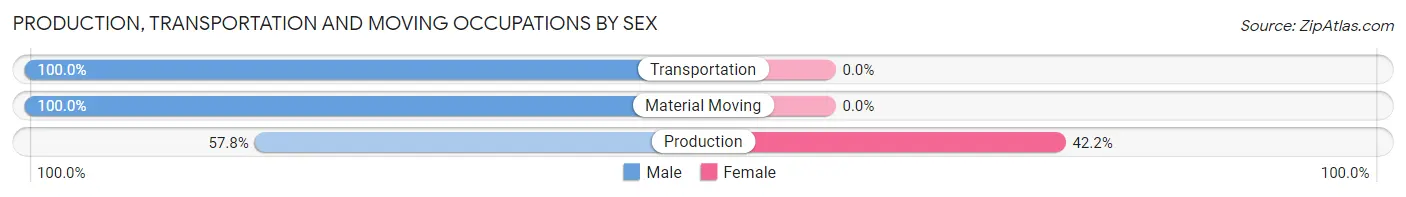
Production, Transportation and Moving Occupations by Sex
| Occupation | Male | Female |
| Production | 111 (57.8%) | 81 (42.2%) |
| Transportation | 5 (100.0%) | 0 (0.0%) |
| Material Moving | 50 (100.0%) | 0 (0.0%) |
| Total (Category) | 166 (67.2%) | 81 (32.8%) |
| Total (Overall) | 1,890 (44.0%) | 2,410 (56.0%) |
Employment Industries by Sex in Templeton
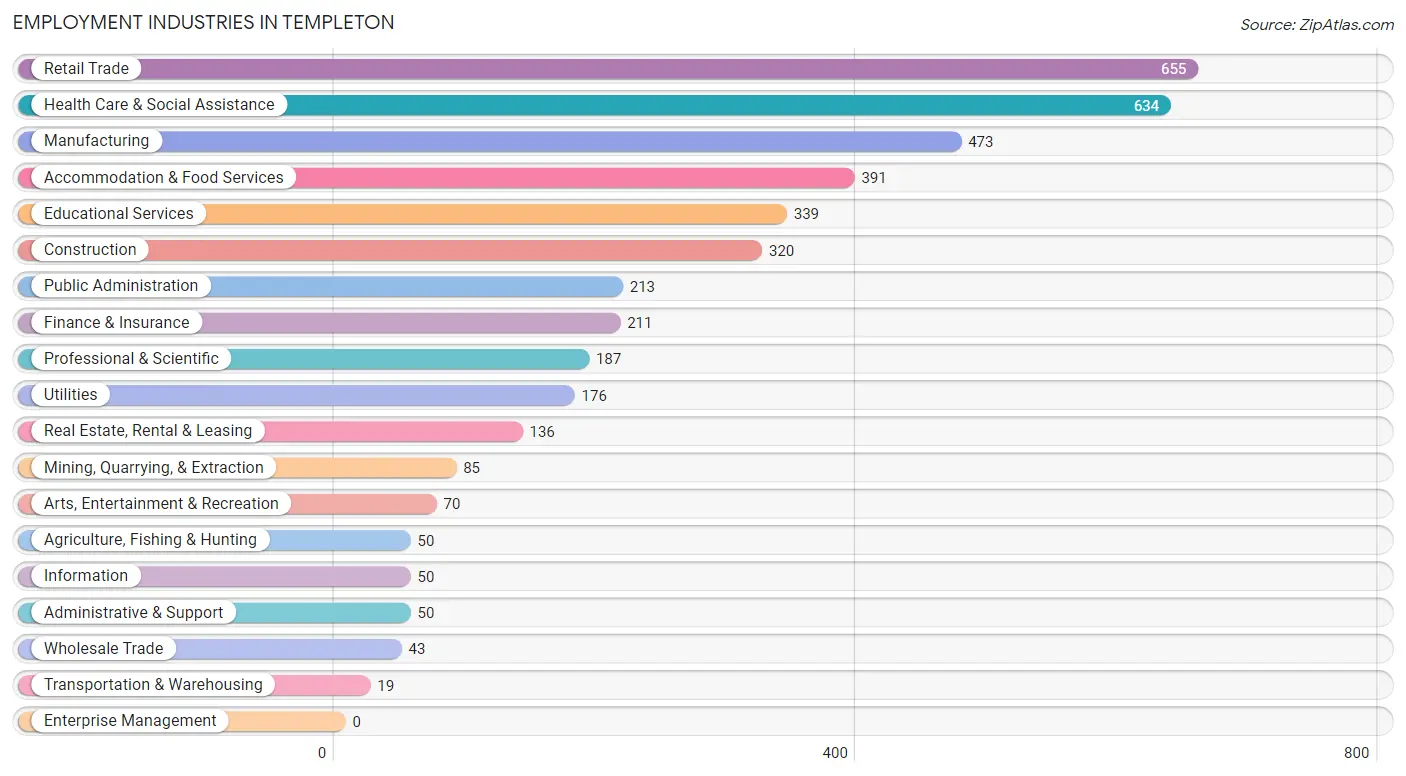
Employment Industries in Templeton
The major employment industries in Templeton include Retail Trade (655 | 15.2%), Health Care & Social Assistance (634 | 14.7%), Manufacturing (473 | 11.0%), Accommodation & Food Services (391 | 9.1%), and Educational Services (339 | 7.9%).
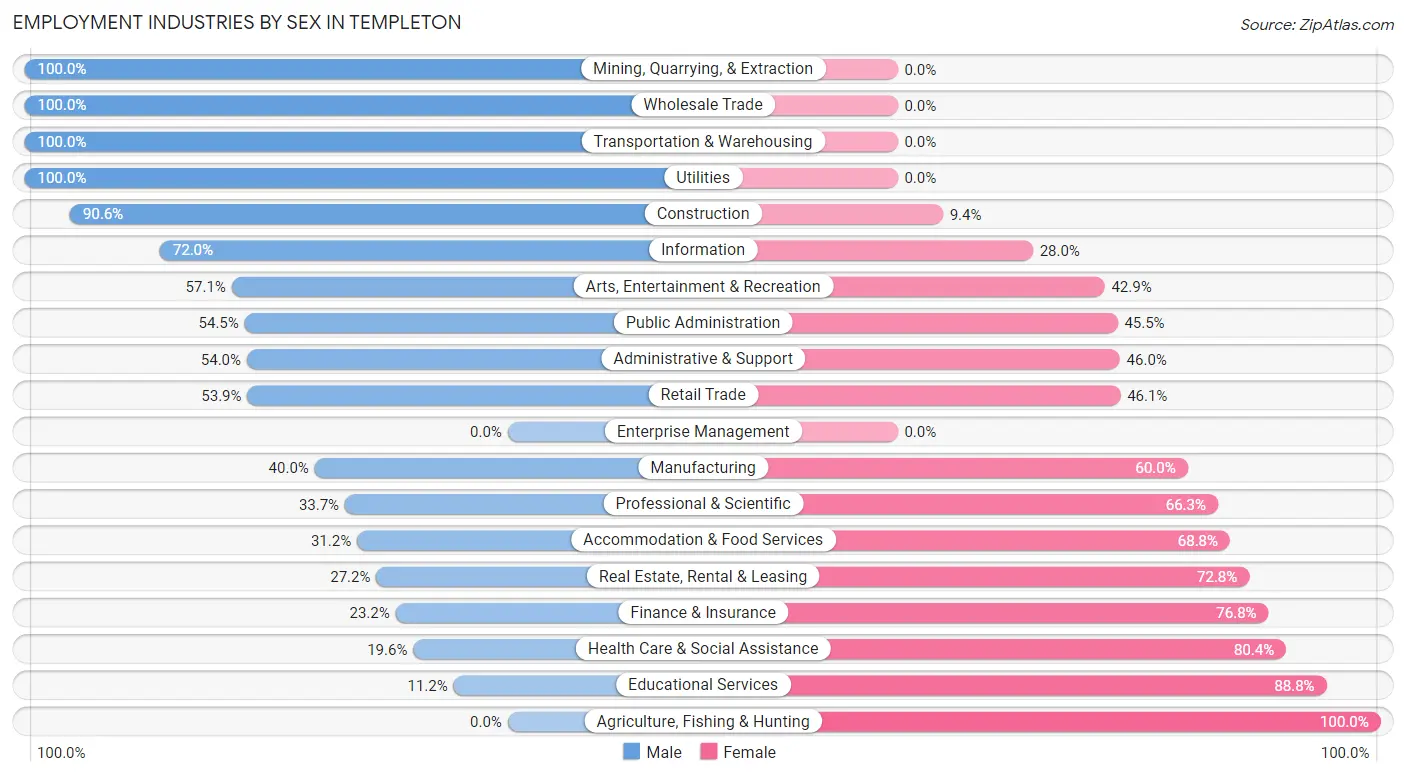
Employment Industries by Sex in Templeton
The Templeton industries that see more men than women are Mining, Quarrying, & Extraction (100.0%), Wholesale Trade (100.0%), and Transportation & Warehousing (100.0%), whereas the industries that tend to have a higher number of women are Agriculture, Fishing & Hunting (100.0%), Educational Services (88.8%), and Health Care & Social Assistance (80.4%).
| Industry | Male | Female |
| Agriculture, Fishing & Hunting | 0 (0.0%) | 50 (100.0%) |
| Mining, Quarrying, & Extraction | 85 (100.0%) | 0 (0.0%) |
| Construction | 290 (90.6%) | 30 (9.4%) |
| Manufacturing | 189 (40.0%) | 284 (60.0%) |
| Wholesale Trade | 43 (100.0%) | 0 (0.0%) |
| Retail Trade | 353 (53.9%) | 302 (46.1%) |
| Transportation & Warehousing | 19 (100.0%) | 0 (0.0%) |
| Utilities | 176 (100.0%) | 0 (0.0%) |
| Information | 36 (72.0%) | 14 (28.0%) |
| Finance & Insurance | 49 (23.2%) | 162 (76.8%) |
| Real Estate, Rental & Leasing | 37 (27.2%) | 99 (72.8%) |
| Professional & Scientific | 63 (33.7%) | 124 (66.3%) |
| Enterprise Management | 0 (0.0%) | 0 (0.0%) |
| Administrative & Support | 27 (54.0%) | 23 (46.0%) |
| Educational Services | 38 (11.2%) | 301 (88.8%) |
| Health Care & Social Assistance | 124 (19.6%) | 510 (80.4%) |
| Arts, Entertainment & Recreation | 40 (57.1%) | 30 (42.9%) |
| Accommodation & Food Services | 122 (31.2%) | 269 (68.8%) |
| Public Administration | 116 (54.5%) | 97 (45.5%) |
| Total | 1,890 (44.0%) | 2,410 (56.0%) |
Education in Templeton
School Enrollment in Templeton
The most common levels of schooling among the 2,066 students in Templeton are middle school (638 | 30.9%), high school (475 | 23.0%), and elementary school (423 | 20.5%).
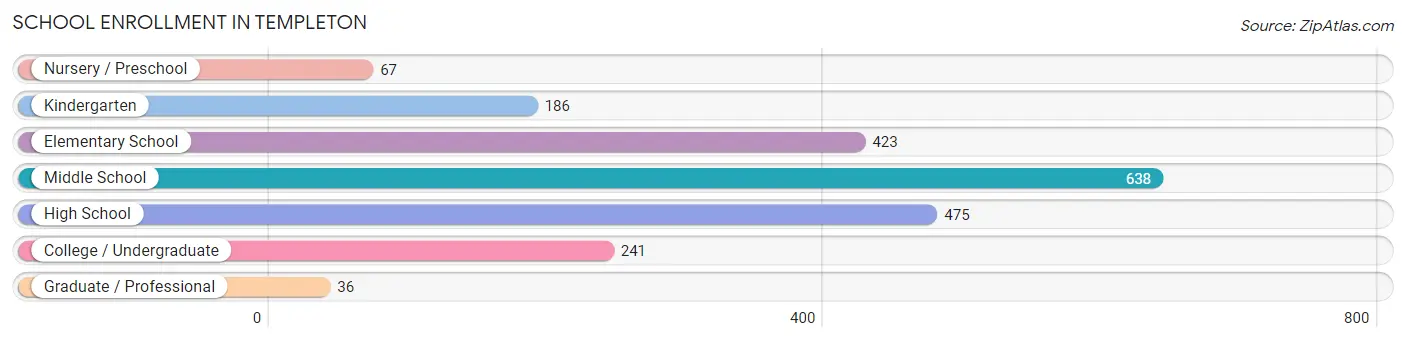
| School Level | # Students | % Students |
| Nursery / Preschool | 67 | 3.2% |
| Kindergarten | 186 | 9.0% |
| Elementary School | 423 | 20.5% |
| Middle School | 638 | 30.9% |
| High School | 475 | 23.0% |
| College / Undergraduate | 241 | 11.7% |
| Graduate / Professional | 36 | 1.7% |
| Total | 2,066 | 100.0% |
School Enrollment by Age by Funding Source in Templeton
Out of a total of 2,066 students who are enrolled in schools in Templeton, 242 (11.7%) attend a private institution, while the remaining 1,824 (88.3%) are enrolled in public schools. The age group of 25 to 34 year olds has the highest likelihood of being enrolled in private schools, with 10 (100.0% in the age bracket) enrolled. Conversely, the age group of 18 to 19 year olds has the lowest likelihood of being enrolled in a private school, with 86 (100.0% in the age bracket) attending a public institution.
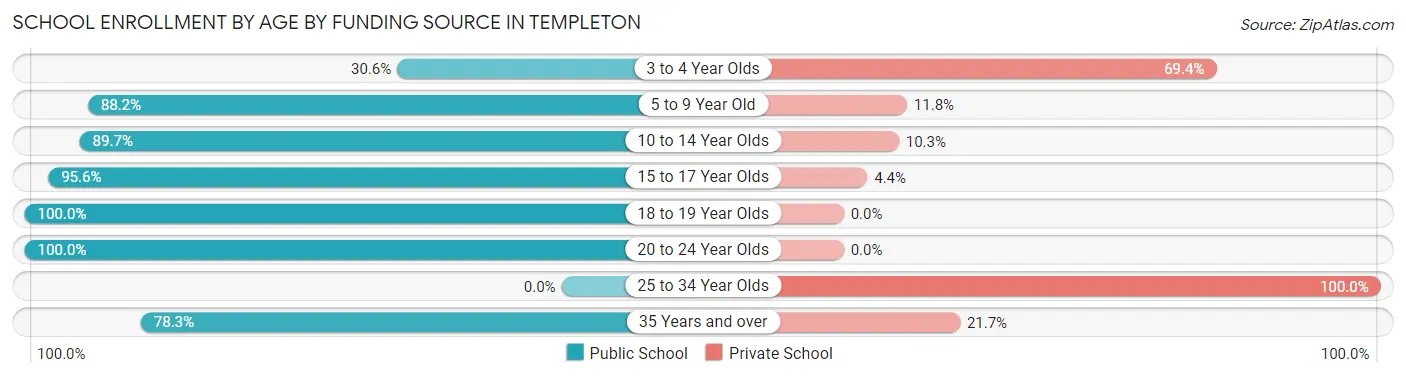
| Age Bracket | Public School | Private School |
| 3 to 4 Year Olds | 15 (30.6%) | 34 (69.4%) |
| 5 to 9 Year Old | 539 (88.2%) | 72 (11.8%) |
| 10 to 14 Year Olds | 665 (89.7%) | 76 (10.3%) |
| 15 to 17 Year Olds | 348 (95.6%) | 16 (4.4%) |
| 18 to 19 Year Olds | 86 (100.0%) | 0 (0.0%) |
| 20 to 24 Year Olds | 48 (100.0%) | 0 (0.0%) |
| 25 to 34 Year Olds | 0 (0.0%) | 10 (100.0%) |
| 35 Years and over | 123 (78.3%) | 34 (21.7%) |
| Total | 1,824 (88.3%) | 242 (11.7%) |
Educational Attainment by Field of Study in Templeton
Bio, nature & agricultural (509 | 18.1%), education (373 | 13.3%), business (359 | 12.8%), science & technology (334 | 11.9%), and arts & humanities (198 | 7.0%) are the most common fields of study among 2,808 individuals in Templeton who have obtained a bachelor's degree or higher.
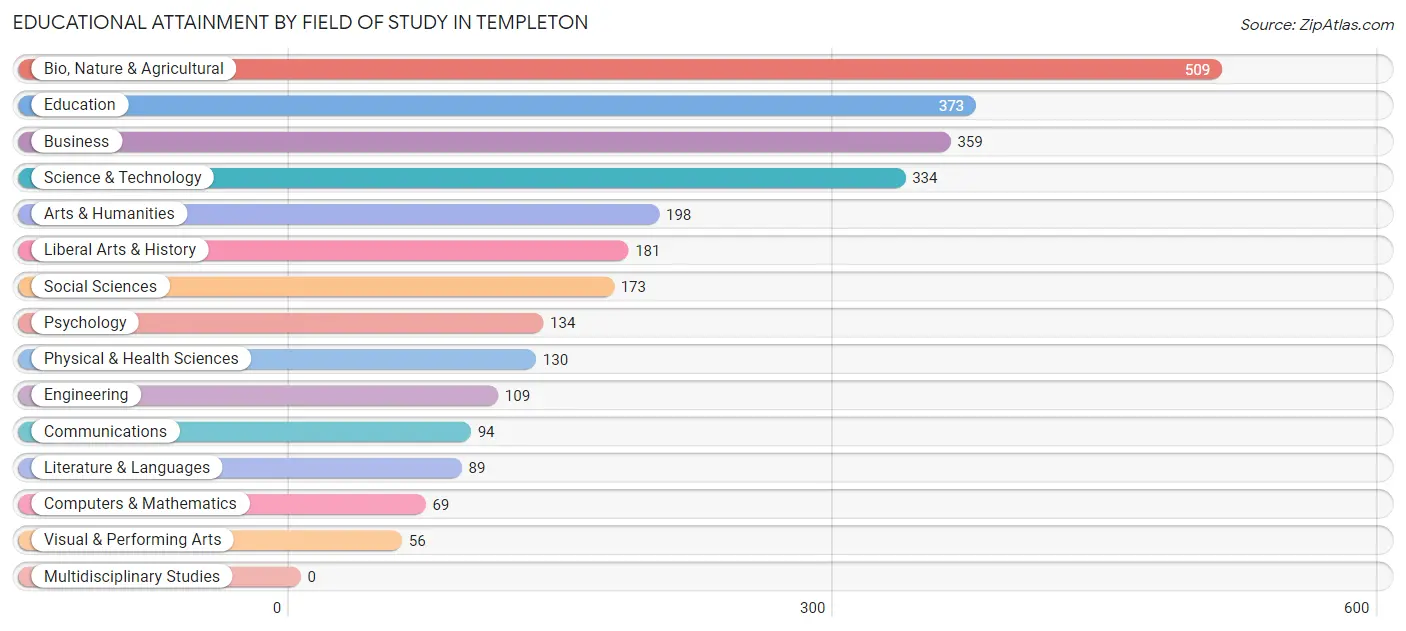
| Field of Study | # Graduates | % Graduates |
| Computers & Mathematics | 69 | 2.5% |
| Bio, Nature & Agricultural | 509 | 18.1% |
| Physical & Health Sciences | 130 | 4.6% |
| Psychology | 134 | 4.8% |
| Social Sciences | 173 | 6.2% |
| Engineering | 109 | 3.9% |
| Multidisciplinary Studies | 0 | 0.0% |
| Science & Technology | 334 | 11.9% |
| Business | 359 | 12.8% |
| Education | 373 | 13.3% |
| Literature & Languages | 89 | 3.2% |
| Liberal Arts & History | 181 | 6.5% |
| Visual & Performing Arts | 56 | 2.0% |
| Communications | 94 | 3.4% |
| Arts & Humanities | 198 | 7.0% |
| Total | 2,808 | 100.0% |
Transportation & Commute in Templeton
Vehicle Availability by Sex in Templeton
The most prevalent vehicle ownership categories in Templeton are males with 2 vehicles (696, accounting for 36.8%) and females with 2 vehicles (708, making up 29.2%).
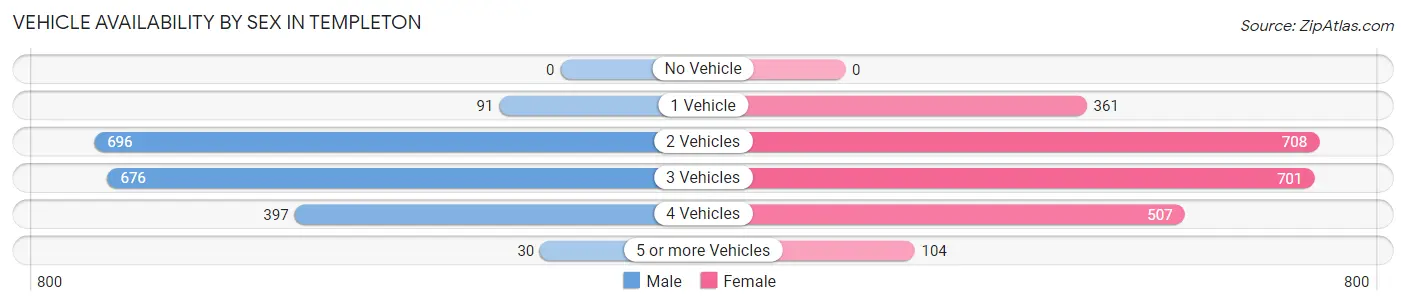
| Vehicles Available | Male | Female |
| No Vehicle | 0 (0.0%) | 0 (0.0%) |
| 1 Vehicle | 91 (4.8%) | 361 (15.2%) |
| 2 Vehicles | 696 (36.8%) | 708 (29.7%) |
| 3 Vehicles | 676 (35.8%) | 701 (29.4%) |
| 4 Vehicles | 397 (21.0%) | 507 (21.3%) |
| 5 or more Vehicles | 30 (1.6%) | 104 (4.4%) |
| Total | 1,890 (100.0%) | 2,381 (100.0%) |
Commute Time in Templeton
The most frequently occuring commute durations in Templeton are 5 to 9 minutes (1,078 commuters, 27.2%), 10 to 14 minutes (677 commuters, 17.1%), and 15 to 19 minutes (455 commuters, 11.5%).
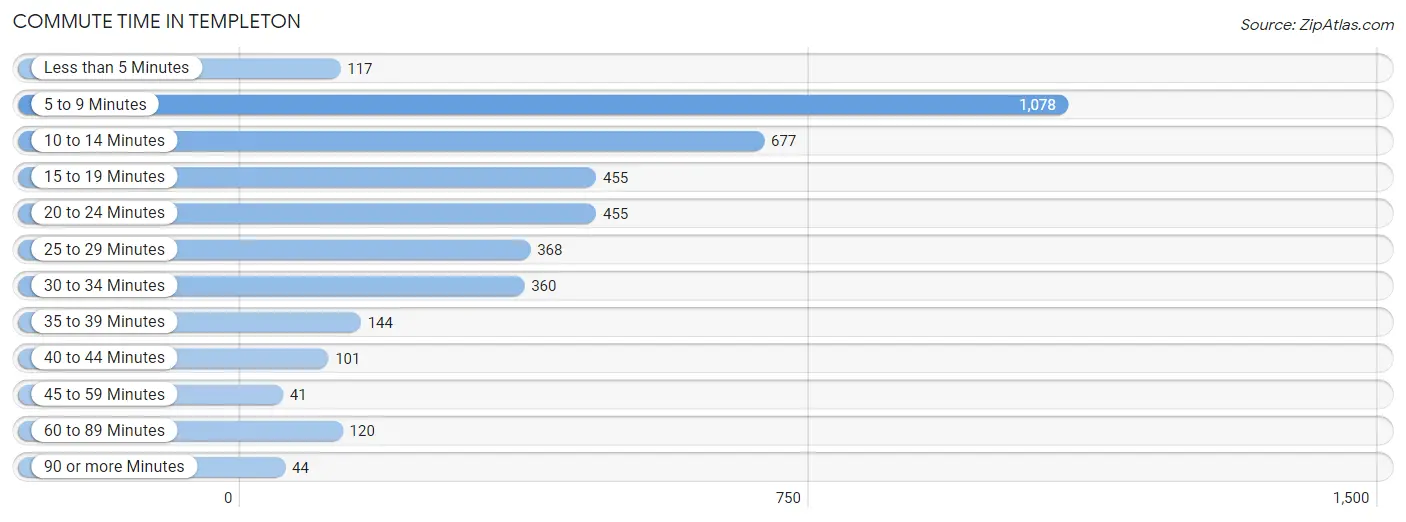
| Commute Time | # Commuters | % Commuters |
| Less than 5 Minutes | 117 | 2.9% |
| 5 to 9 Minutes | 1,078 | 27.2% |
| 10 to 14 Minutes | 677 | 17.1% |
| 15 to 19 Minutes | 455 | 11.5% |
| 20 to 24 Minutes | 455 | 11.5% |
| 25 to 29 Minutes | 368 | 9.3% |
| 30 to 34 Minutes | 360 | 9.1% |
| 35 to 39 Minutes | 144 | 3.6% |
| 40 to 44 Minutes | 101 | 2.5% |
| 45 to 59 Minutes | 41 | 1.0% |
| 60 to 89 Minutes | 120 | 3.0% |
| 90 or more Minutes | 44 | 1.1% |
Commute Time by Sex in Templeton
The most common commute times in Templeton are 5 to 9 minutes (338 commuters, 19.1%) for males and 5 to 9 minutes (740 commuters, 33.8%) for females.
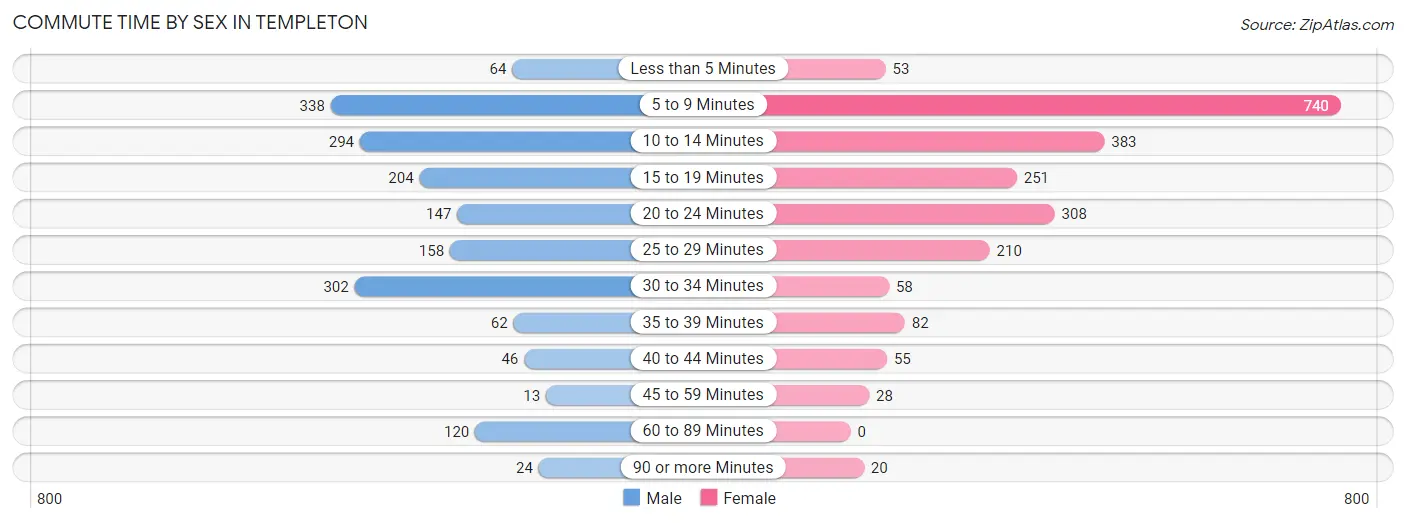
| Commute Time | Male | Female |
| Less than 5 Minutes | 64 (3.6%) | 53 (2.4%) |
| 5 to 9 Minutes | 338 (19.1%) | 740 (33.8%) |
| 10 to 14 Minutes | 294 (16.6%) | 383 (17.5%) |
| 15 to 19 Minutes | 204 (11.5%) | 251 (11.5%) |
| 20 to 24 Minutes | 147 (8.3%) | 308 (14.1%) |
| 25 to 29 Minutes | 158 (8.9%) | 210 (9.6%) |
| 30 to 34 Minutes | 302 (17.0%) | 58 (2.6%) |
| 35 to 39 Minutes | 62 (3.5%) | 82 (3.7%) |
| 40 to 44 Minutes | 46 (2.6%) | 55 (2.5%) |
| 45 to 59 Minutes | 13 (0.7%) | 28 (1.3%) |
| 60 to 89 Minutes | 120 (6.8%) | 0 (0.0%) |
| 90 or more Minutes | 24 (1.3%) | 20 (0.9%) |
Time of Departure to Work by Sex in Templeton
The most frequent times of departure to work in Templeton are 7:00 AM to 7:29 AM (335, 18.9%) for males and 9:00 AM to 9:59 AM (513, 23.4%) for females.
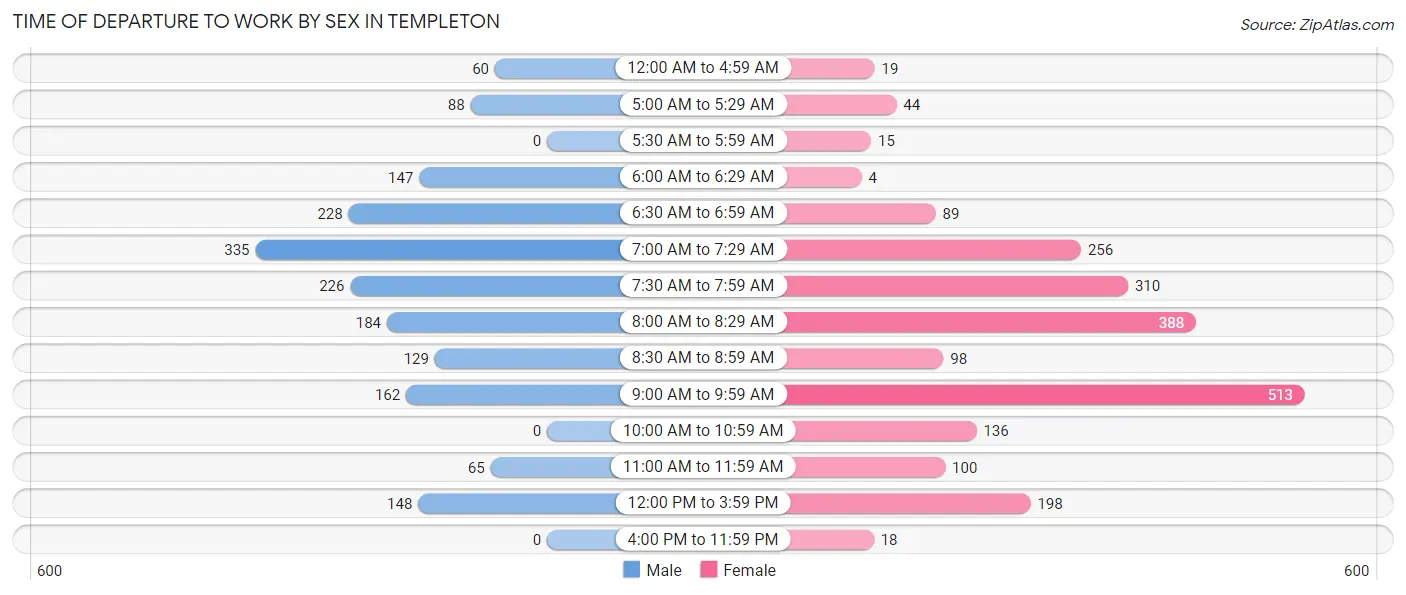
| Time of Departure | Male | Female |
| 12:00 AM to 4:59 AM | 60 (3.4%) | 19 (0.9%) |
| 5:00 AM to 5:29 AM | 88 (5.0%) | 44 (2.0%) |
| 5:30 AM to 5:59 AM | 0 (0.0%) | 15 (0.7%) |
| 6:00 AM to 6:29 AM | 147 (8.3%) | 4 (0.2%) |
| 6:30 AM to 6:59 AM | 228 (12.9%) | 89 (4.1%) |
| 7:00 AM to 7:29 AM | 335 (18.9%) | 256 (11.7%) |
| 7:30 AM to 7:59 AM | 226 (12.8%) | 310 (14.2%) |
| 8:00 AM to 8:29 AM | 184 (10.4%) | 388 (17.7%) |
| 8:30 AM to 8:59 AM | 129 (7.3%) | 98 (4.5%) |
| 9:00 AM to 9:59 AM | 162 (9.1%) | 513 (23.4%) |
| 10:00 AM to 10:59 AM | 0 (0.0%) | 136 (6.2%) |
| 11:00 AM to 11:59 AM | 65 (3.7%) | 100 (4.6%) |
| 12:00 PM to 3:59 PM | 148 (8.4%) | 198 (9.0%) |
| 4:00 PM to 11:59 PM | 0 (0.0%) | 18 (0.8%) |
| Total | 1,772 (100.0%) | 2,188 (100.0%) |
Housing Occupancy in Templeton
Occupancy by Ownership in Templeton
Of the total 3,334 dwellings in Templeton, owner-occupied units account for 2,571 (77.1%), while renter-occupied units make up 763 (22.9%).
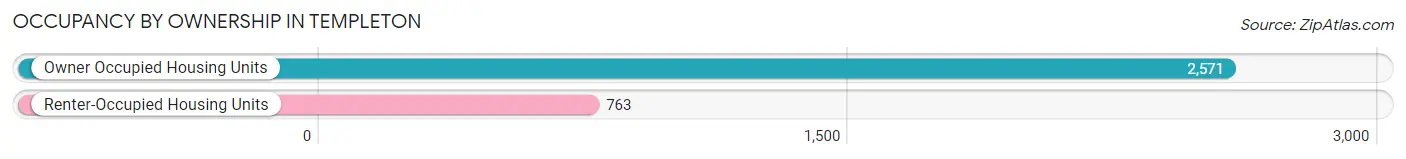
| Occupancy | # Housing Units | % Housing Units |
| Owner Occupied Housing Units | 2,571 | 77.1% |
| Renter-Occupied Housing Units | 763 | 22.9% |
| Total Occupied Housing Units | 3,334 | 100.0% |
Occupancy by Household Size in Templeton
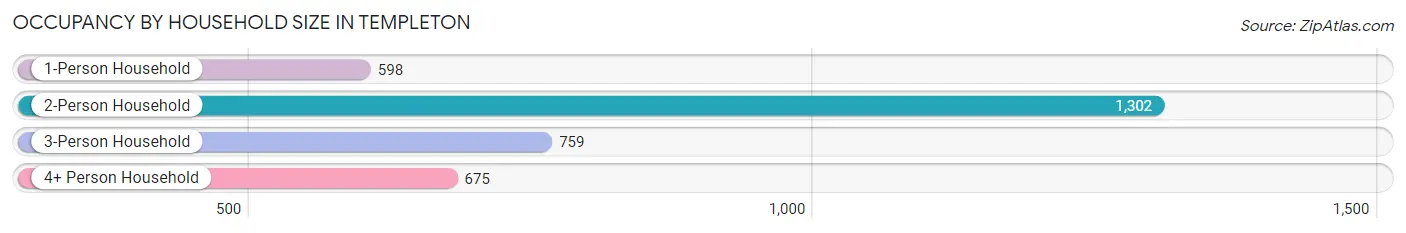
| Household Size | # Housing Units | % Housing Units |
| 1-Person Household | 598 | 17.9% |
| 2-Person Household | 1,302 | 39.1% |
| 3-Person Household | 759 | 22.8% |
| 4+ Person Household | 675 | 20.3% |
| Total Housing Units | 3,334 | 100.0% |
Occupancy by Ownership by Household Size in Templeton
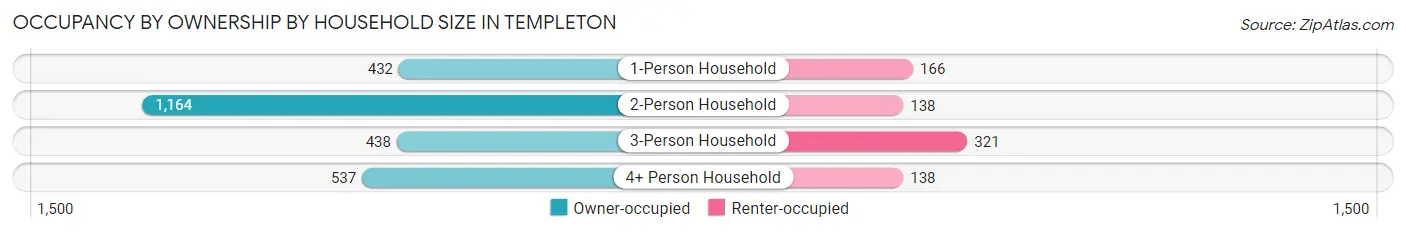
| Household Size | Owner-occupied | Renter-occupied |
| 1-Person Household | 432 (72.2%) | 166 (27.8%) |
| 2-Person Household | 1,164 (89.4%) | 138 (10.6%) |
| 3-Person Household | 438 (57.7%) | 321 (42.3%) |
| 4+ Person Household | 537 (79.6%) | 138 (20.4%) |
| Total Housing Units | 2,571 (77.1%) | 763 (22.9%) |
Occupancy by Educational Attainment in Templeton
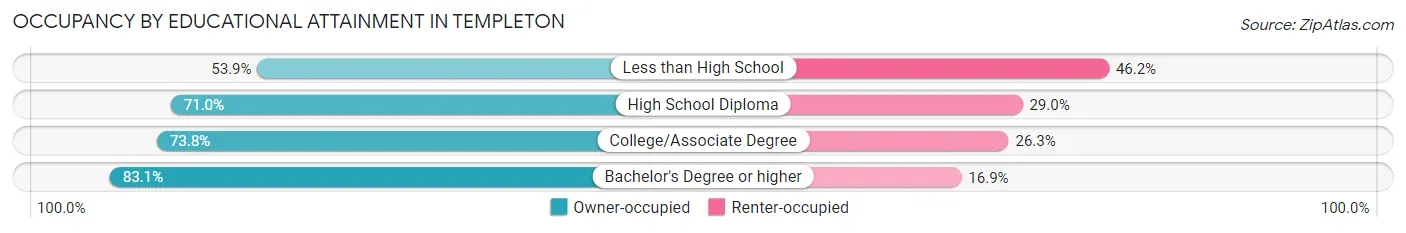
| Household Size | Owner-occupied | Renter-occupied |
| Less than High School | 28 (53.8%) | 24 (46.2%) |
| High School Diploma | 279 (71.0%) | 114 (29.0%) |
| College/Associate Degree | 1,079 (73.8%) | 384 (26.3%) |
| Bachelor's Degree or higher | 1,185 (83.1%) | 241 (16.9%) |
Occupancy by Age of Householder in Templeton
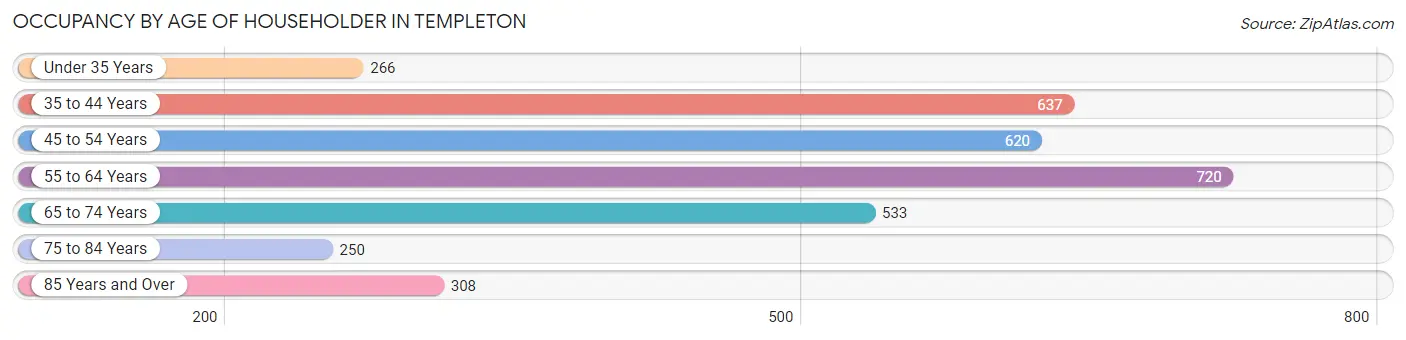
| Age Bracket | # Households | % Households |
| Under 35 Years | 266 | 8.0% |
| 35 to 44 Years | 637 | 19.1% |
| 45 to 54 Years | 620 | 18.6% |
| 55 to 64 Years | 720 | 21.6% |
| 65 to 74 Years | 533 | 16.0% |
| 75 to 84 Years | 250 | 7.5% |
| 85 Years and Over | 308 | 9.2% |
| Total | 3,334 | 100.0% |
Housing Finances in Templeton
Median Income by Occupancy in Templeton
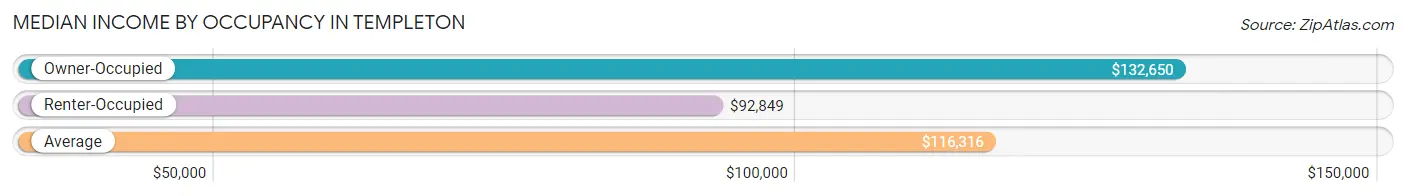
| Occupancy Type | # Households | Median Income |
| Owner-Occupied | 2,571 (77.1%) | $132,650 |
| Renter-Occupied | 763 (22.9%) | $92,849 |
| Average | 3,334 (100.0%) | $116,316 |
Occupancy by Householder Income Bracket in Templeton
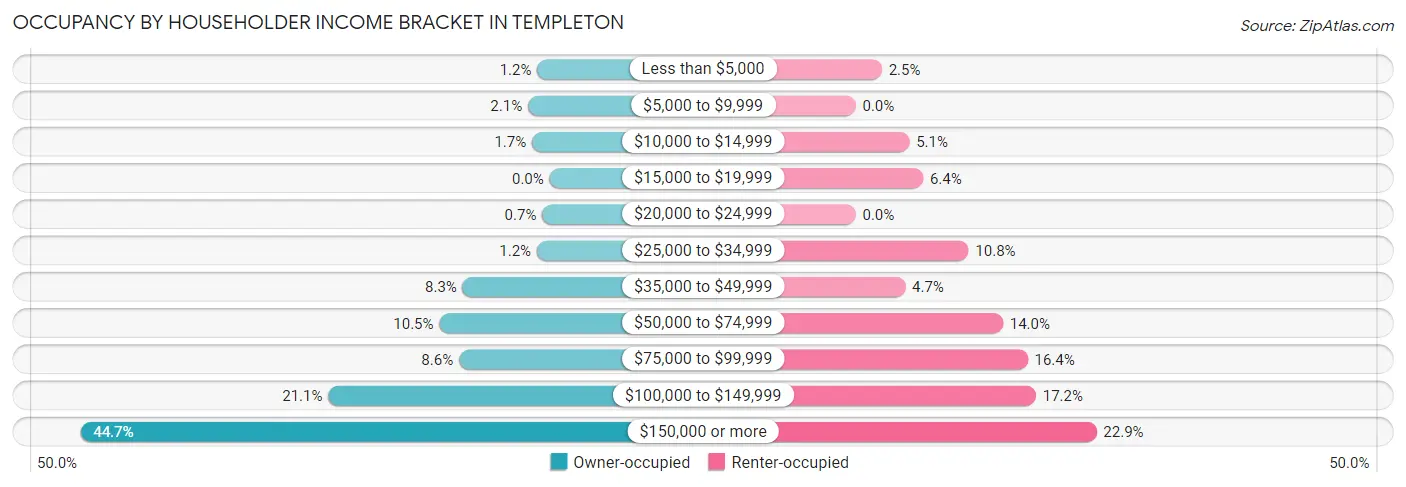
| Income Bracket | Owner-occupied | Renter-occupied |
| Less than $5,000 | 30 (1.2%) | 19 (2.5%) |
| $5,000 to $9,999 | 53 (2.1%) | 0 (0.0%) |
| $10,000 to $14,999 | 43 (1.7%) | 39 (5.1%) |
| $15,000 to $19,999 | 0 (0.0%) | 49 (6.4%) |
| $20,000 to $24,999 | 18 (0.7%) | 0 (0.0%) |
| $25,000 to $34,999 | 31 (1.2%) | 82 (10.7%) |
| $35,000 to $49,999 | 213 (8.3%) | 36 (4.7%) |
| $50,000 to $74,999 | 270 (10.5%) | 107 (14.0%) |
| $75,000 to $99,999 | 222 (8.6%) | 125 (16.4%) |
| $100,000 to $149,999 | 542 (21.1%) | 131 (17.2%) |
| $150,000 or more | 1,149 (44.7%) | 175 (22.9%) |
| Total | 2,571 (100.0%) | 763 (100.0%) |
Monthly Housing Cost Tiers in Templeton
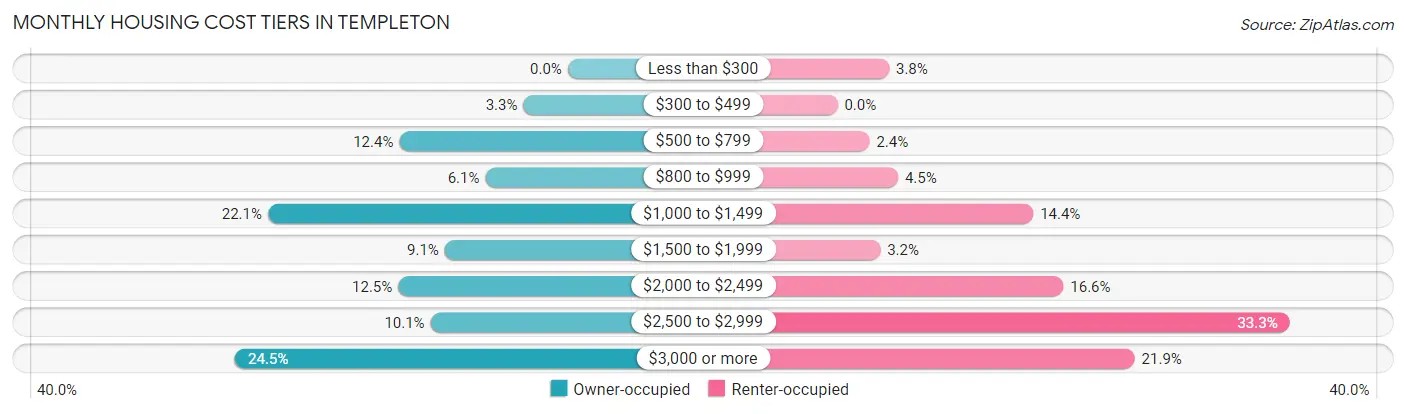
| Monthly Cost | Owner-occupied | Renter-occupied |
| Less than $300 | 0 (0.0%) | 29 (3.8%) |
| $300 to $499 | 84 (3.3%) | 0 (0.0%) |
| $500 to $799 | 319 (12.4%) | 18 (2.4%) |
| $800 to $999 | 156 (6.1%) | 34 (4.5%) |
| $1,000 to $1,499 | 568 (22.1%) | 110 (14.4%) |
| $1,500 to $1,999 | 233 (9.1%) | 24 (3.2%) |
| $2,000 to $2,499 | 321 (12.5%) | 127 (16.6%) |
| $2,500 to $2,999 | 260 (10.1%) | 254 (33.3%) |
| $3,000 or more | 630 (24.5%) | 167 (21.9%) |
| Total | 2,571 (100.0%) | 763 (100.0%) |
Physical Housing Characteristics in Templeton
Housing Structures in Templeton
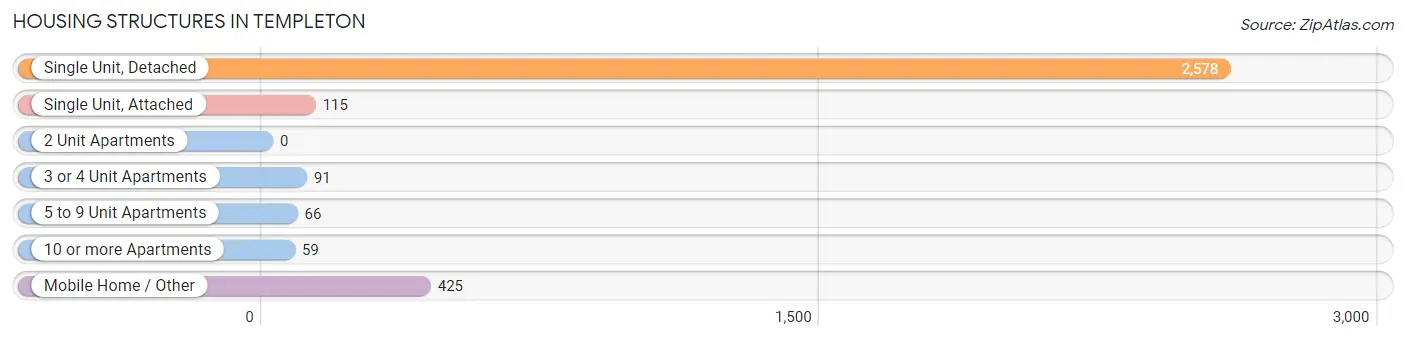
| Structure Type | # Housing Units | % Housing Units |
| Single Unit, Detached | 2,578 | 77.3% |
| Single Unit, Attached | 115 | 3.5% |
| 2 Unit Apartments | 0 | 0.0% |
| 3 or 4 Unit Apartments | 91 | 2.7% |
| 5 to 9 Unit Apartments | 66 | 2.0% |
| 10 or more Apartments | 59 | 1.8% |
| Mobile Home / Other | 425 | 12.8% |
| Total | 3,334 | 100.0% |
Housing Structures by Occupancy in Templeton
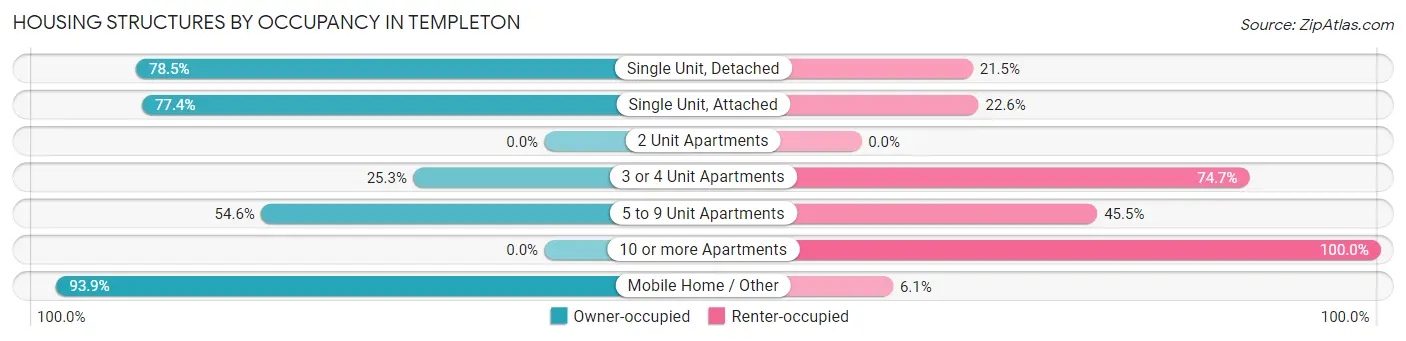
| Structure Type | Owner-occupied | Renter-occupied |
| Single Unit, Detached | 2,024 (78.5%) | 554 (21.5%) |
| Single Unit, Attached | 89 (77.4%) | 26 (22.6%) |
| 2 Unit Apartments | 0 (0.0%) | 0 (0.0%) |
| 3 or 4 Unit Apartments | 23 (25.3%) | 68 (74.7%) |
| 5 to 9 Unit Apartments | 36 (54.5%) | 30 (45.5%) |
| 10 or more Apartments | 0 (0.0%) | 59 (100.0%) |
| Mobile Home / Other | 399 (93.9%) | 26 (6.1%) |
| Total | 2,571 (77.1%) | 763 (22.9%) |
Housing Structures by Number of Rooms in Templeton
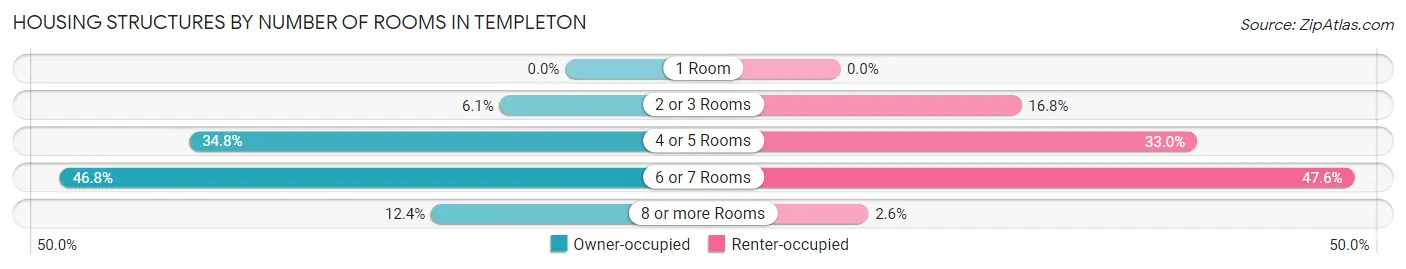
| Number of Rooms | Owner-occupied | Renter-occupied |
| 1 Room | 0 (0.0%) | 0 (0.0%) |
| 2 or 3 Rooms | 156 (6.1%) | 128 (16.8%) |
| 4 or 5 Rooms | 894 (34.8%) | 252 (33.0%) |
| 6 or 7 Rooms | 1,202 (46.8%) | 363 (47.6%) |
| 8 or more Rooms | 319 (12.4%) | 20 (2.6%) |
| Total | 2,571 (100.0%) | 763 (100.0%) |
Housing Structure by Heating Type in Templeton
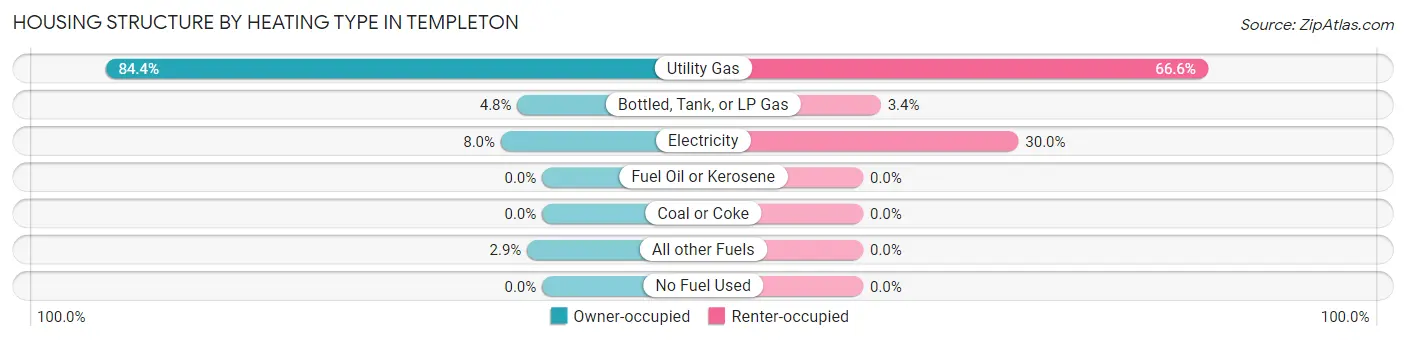
| Heating Type | Owner-occupied | Renter-occupied |
| Utility Gas | 2,169 (84.4%) | 508 (66.6%) |
| Bottled, Tank, or LP Gas | 123 (4.8%) | 26 (3.4%) |
| Electricity | 205 (8.0%) | 229 (30.0%) |
| Fuel Oil or Kerosene | 0 (0.0%) | 0 (0.0%) |
| Coal or Coke | 0 (0.0%) | 0 (0.0%) |
| All other Fuels | 74 (2.9%) | 0 (0.0%) |
| No Fuel Used | 0 (0.0%) | 0 (0.0%) |
| Total | 2,571 (100.0%) | 763 (100.0%) |
Household Vehicle Usage in Templeton
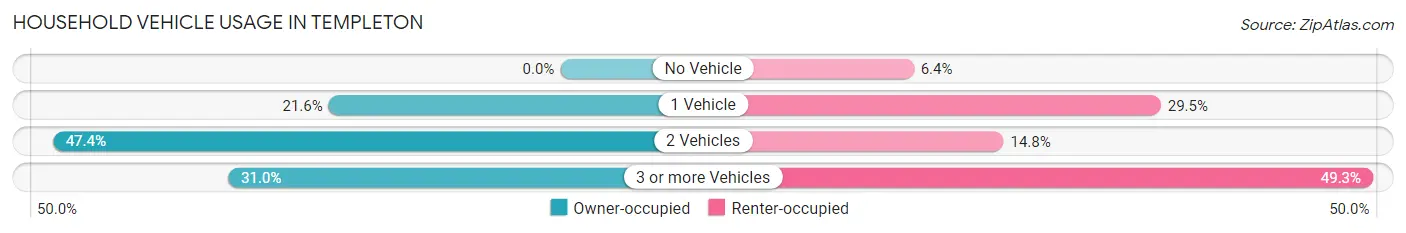
| Vehicles per Household | Owner-occupied | Renter-occupied |
| No Vehicle | 0 (0.0%) | 49 (6.4%) |
| 1 Vehicle | 556 (21.6%) | 225 (29.5%) |
| 2 Vehicles | 1,218 (47.4%) | 113 (14.8%) |
| 3 or more Vehicles | 797 (31.0%) | 376 (49.3%) |
| Total | 2,571 (100.0%) | 763 (100.0%) |
Real Estate & Mortgages in Templeton
Real Estate and Mortgage Overview in Templeton
| Characteristic | Without Mortgage | With Mortgage |
| Housing Units | 1,042 | 1,529 |
| Median Property Value | $733,800 | $687,100 |
| Median Household Income | $87,344 | $879 |
| Monthly Housing Costs | $969 | $610 |
| Real Estate Taxes | $4,330 | $0 |
Property Value by Mortgage Status in Templeton
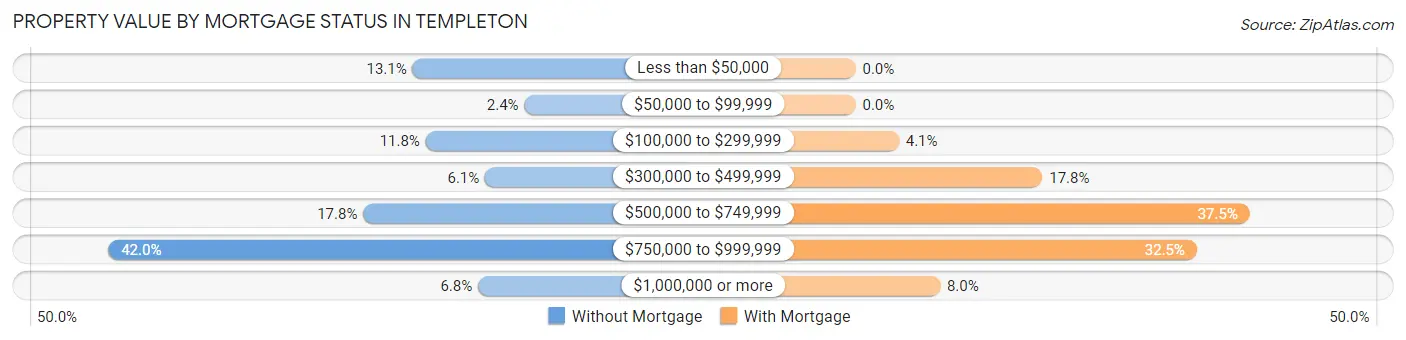
| Property Value | Without Mortgage | With Mortgage |
| Less than $50,000 | 136 (13.1%) | 0 (0.0%) |
| $50,000 to $99,999 | 25 (2.4%) | 0 (0.0%) |
| $100,000 to $299,999 | 123 (11.8%) | 63 (4.1%) |
| $300,000 to $499,999 | 64 (6.1%) | 272 (17.8%) |
| $500,000 to $749,999 | 185 (17.7%) | 574 (37.5%) |
| $750,000 to $999,999 | 438 (42.0%) | 497 (32.5%) |
| $1,000,000 or more | 71 (6.8%) | 123 (8.0%) |
| Total | 1,042 (100.0%) | 1,529 (100.0%) |
Household Income by Mortgage Status in Templeton
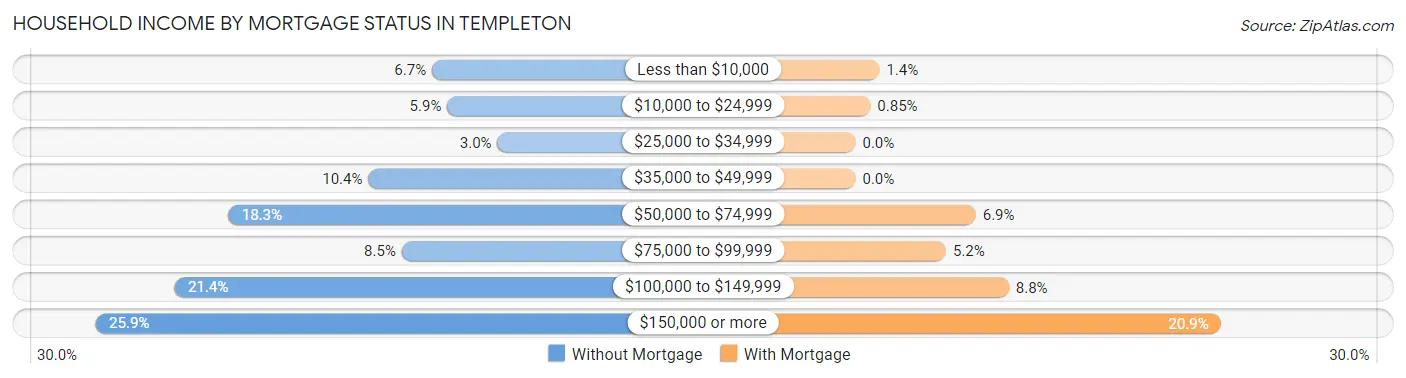
| Household Income | Without Mortgage | With Mortgage |
| Less than $10,000 | 70 (6.7%) | 21 (1.4%) |
| $10,000 to $24,999 | 61 (5.9%) | 13 (0.9%) |
| $25,000 to $34,999 | 31 (3.0%) | 0 (0.0%) |
| $35,000 to $49,999 | 108 (10.4%) | 0 (0.0%) |
| $50,000 to $74,999 | 191 (18.3%) | 105 (6.9%) |
| $75,000 to $99,999 | 88 (8.5%) | 79 (5.2%) |
| $100,000 to $149,999 | 223 (21.4%) | 134 (8.8%) |
| $150,000 or more | 270 (25.9%) | 319 (20.9%) |
| Total | 1,042 (100.0%) | 1,529 (100.0%) |
Property Value to Household Income Ratio in Templeton
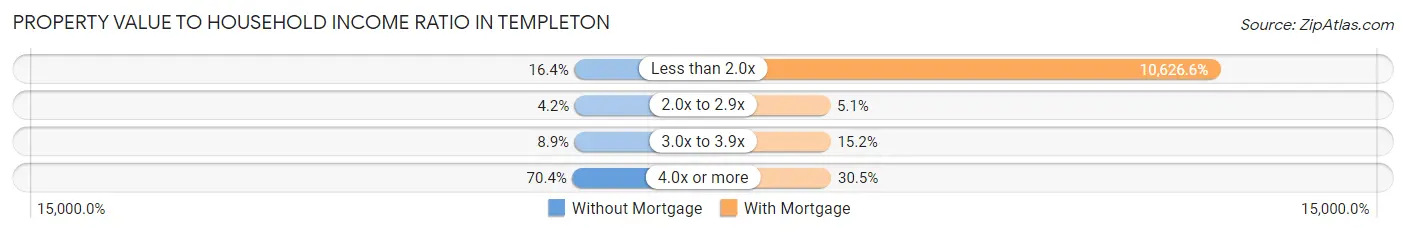
| Value-to-Income Ratio | Without Mortgage | With Mortgage |
| Less than 2.0x | 171 (16.4%) | 162,480 (10,626.6%) |
| 2.0x to 2.9x | 44 (4.2%) | 78 (5.1%) |
| 3.0x to 3.9x | 93 (8.9%) | 232 (15.2%) |
| 4.0x or more | 734 (70.4%) | 467 (30.5%) |
| Total | 1,042 (100.0%) | 1,529 (100.0%) |
Real Estate Taxes by Mortgage Status in Templeton
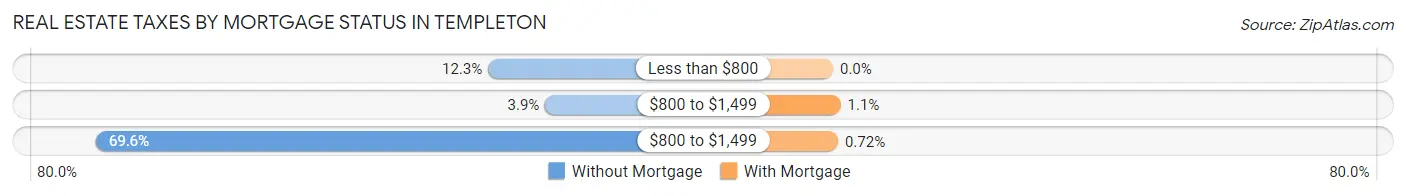
| Property Taxes | Without Mortgage | With Mortgage |
| Less than $800 | 128 (12.3%) | 0 (0.0%) |
| $800 to $1,499 | 41 (3.9%) | 17 (1.1%) |
| $800 to $1,499 | 725 (69.6%) | 11 (0.7%) |
| Total | 1,042 (100.0%) | 1,529 (100.0%) |
Health & Disability in Templeton
Health Insurance Coverage by Age in Templeton
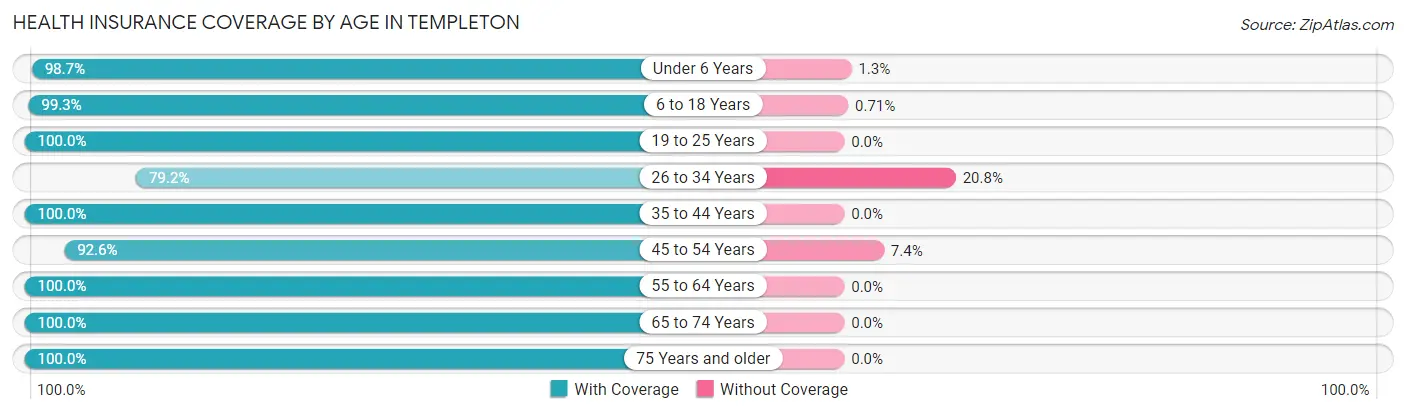
| Age Bracket | With Coverage | Without Coverage |
| Under 6 Years | 443 (98.7%) | 6 (1.3%) |
| 6 to 18 Years | 1,690 (99.3%) | 12 (0.7%) |
| 19 to 25 Years | 258 (100.0%) | 0 (0.0%) |
| 26 to 34 Years | 667 (79.2%) | 175 (20.8%) |
| 35 to 44 Years | 1,111 (100.0%) | 0 (0.0%) |
| 45 to 54 Years | 1,002 (92.6%) | 80 (7.4%) |
| 55 to 64 Years | 1,398 (100.0%) | 0 (0.0%) |
| 65 to 74 Years | 749 (100.0%) | 0 (0.0%) |
| 75 Years and older | 934 (100.0%) | 0 (0.0%) |
| Total | 8,252 (96.8%) | 273 (3.2%) |
Health Insurance Coverage by Citizenship Status in Templeton
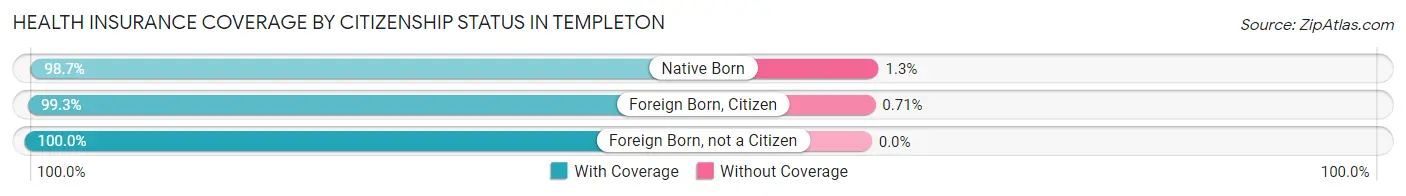
| Citizenship Status | With Coverage | Without Coverage |
| Native Born | 443 (98.7%) | 6 (1.3%) |
| Foreign Born, Citizen | 1,690 (99.3%) | 12 (0.7%) |
| Foreign Born, not a Citizen | 258 (100.0%) | 0 (0.0%) |
Health Insurance Coverage by Household Income in Templeton
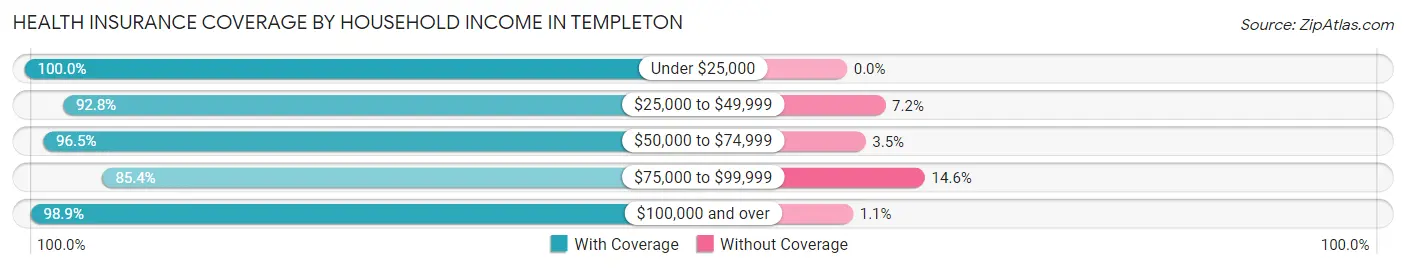
| Household Income | With Coverage | Without Coverage |
| Under $25,000 | 343 (100.0%) | 0 (0.0%) |
| $25,000 to $49,999 | 542 (92.8%) | 42 (7.2%) |
| $50,000 to $74,999 | 832 (96.5%) | 30 (3.5%) |
| $75,000 to $99,999 | 796 (85.4%) | 136 (14.6%) |
| $100,000 and over | 5,731 (98.9%) | 65 (1.1%) |
Public vs Private Health Insurance Coverage by Age in Templeton
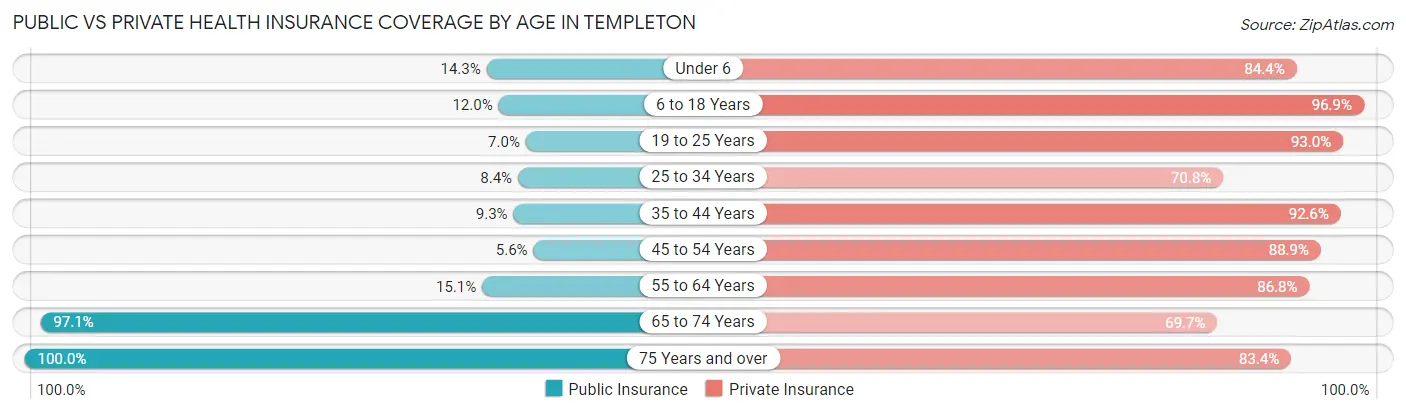
| Age Bracket | Public Insurance | Private Insurance |
| Under 6 | 64 (14.2%) | 379 (84.4%) |
| 6 to 18 Years | 205 (12.0%) | 1,649 (96.9%) |
| 19 to 25 Years | 18 (7.0%) | 240 (93.0%) |
| 25 to 34 Years | 71 (8.4%) | 596 (70.8%) |
| 35 to 44 Years | 103 (9.3%) | 1,029 (92.6%) |
| 45 to 54 Years | 60 (5.6%) | 962 (88.9%) |
| 55 to 64 Years | 211 (15.1%) | 1,213 (86.8%) |
| 65 to 74 Years | 727 (97.1%) | 522 (69.7%) |
| 75 Years and over | 934 (100.0%) | 779 (83.4%) |
| Total | 2,393 (28.1%) | 7,369 (86.4%) |
Disability Status by Sex by Age in Templeton
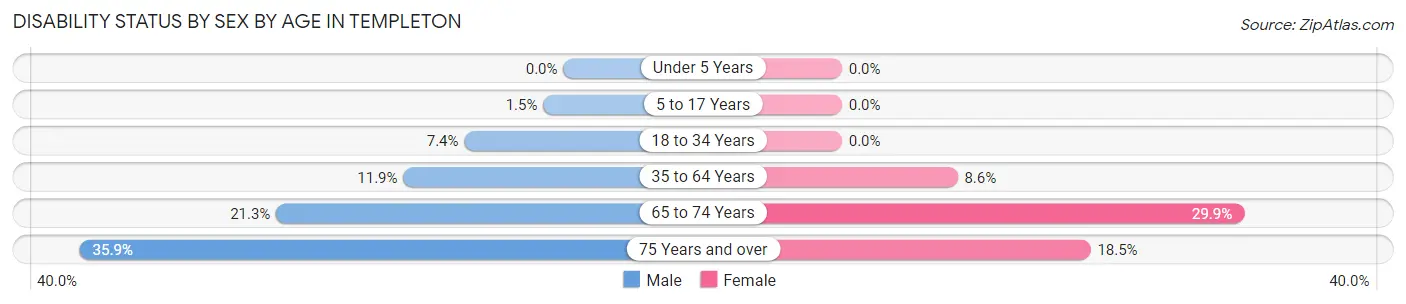
| Age Bracket | Male | Female |
| Under 5 Years | 0 (0.0%) | 0 (0.0%) |
| 5 to 17 Years | 11 (1.5%) | 0 (0.0%) |
| 18 to 34 Years | 41 (7.3%) | 0 (0.0%) |
| 35 to 64 Years | 186 (11.9%) | 174 (8.6%) |
| 65 to 74 Years | 84 (21.3%) | 106 (29.9%) |
| 75 Years and over | 172 (35.9%) | 84 (18.5%) |
Disability Class by Sex by Age in Templeton
Disability Class: Hearing Difficulty
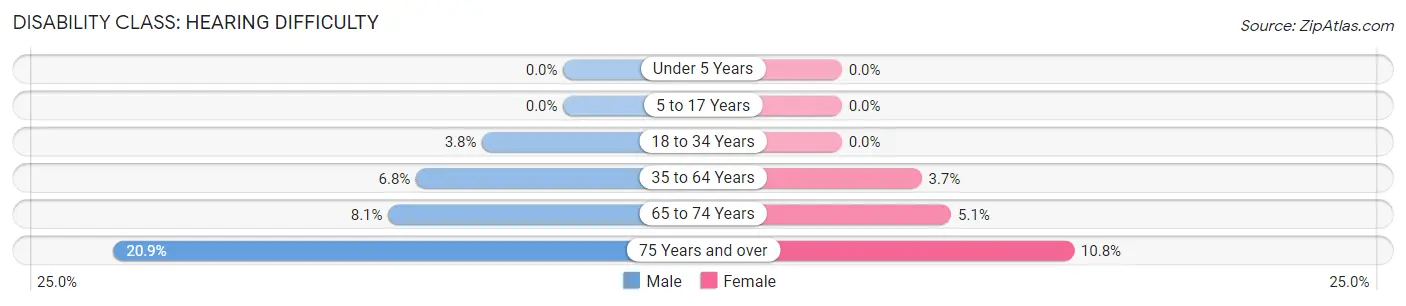
| Age Bracket | Male | Female |
| Under 5 Years | 0 (0.0%) | 0 (0.0%) |
| 5 to 17 Years | 0 (0.0%) | 0 (0.0%) |
| 18 to 34 Years | 21 (3.8%) | 0 (0.0%) |
| 35 to 64 Years | 107 (6.8%) | 75 (3.7%) |
| 65 to 74 Years | 32 (8.1%) | 18 (5.1%) |
| 75 Years and over | 100 (20.9%) | 49 (10.8%) |
Disability Class: Vision Difficulty
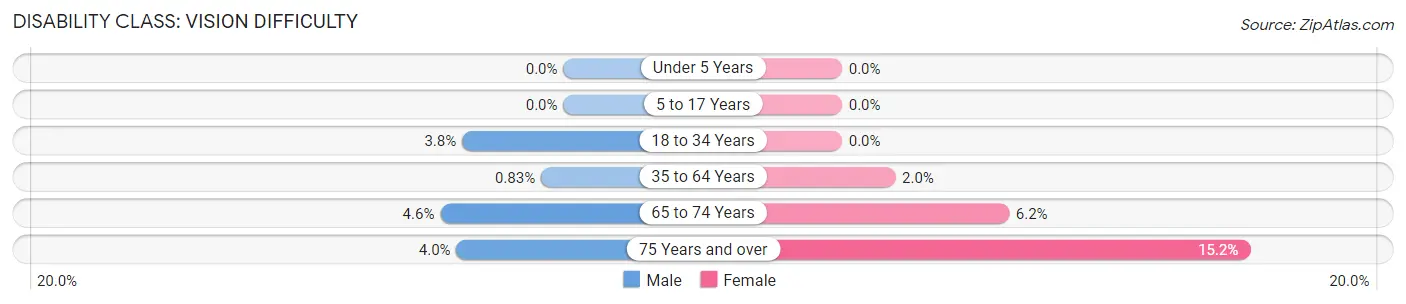
| Age Bracket | Male | Female |
| Under 5 Years | 0 (0.0%) | 0 (0.0%) |
| 5 to 17 Years | 0 (0.0%) | 0 (0.0%) |
| 18 to 34 Years | 21 (3.8%) | 0 (0.0%) |
| 35 to 64 Years | 13 (0.8%) | 40 (2.0%) |
| 65 to 74 Years | 18 (4.6%) | 22 (6.2%) |
| 75 Years and over | 19 (4.0%) | 69 (15.2%) |
Disability Class: Cognitive Difficulty
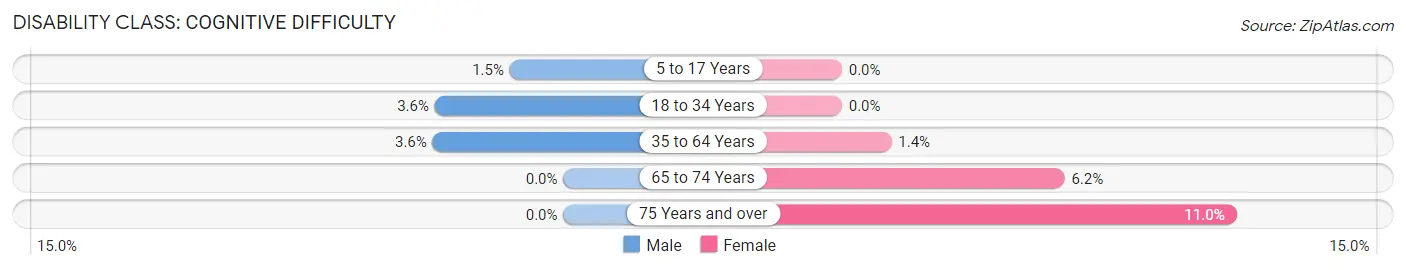
| Age Bracket | Male | Female |
| 5 to 17 Years | 11 (1.5%) | 0 (0.0%) |
| 18 to 34 Years | 20 (3.6%) | 0 (0.0%) |
| 35 to 64 Years | 57 (3.6%) | 28 (1.4%) |
| 65 to 74 Years | 0 (0.0%) | 22 (6.2%) |
| 75 Years and over | 0 (0.0%) | 50 (11.0%) |
Disability Class: Ambulatory Difficulty
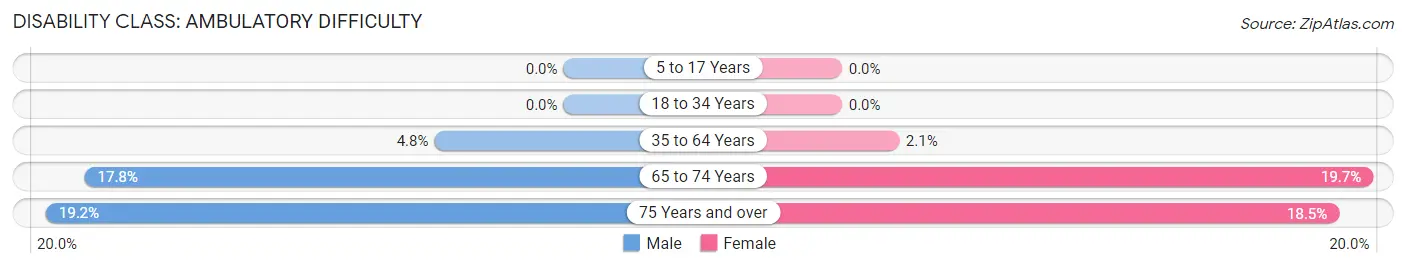
| Age Bracket | Male | Female |
| 5 to 17 Years | 0 (0.0%) | 0 (0.0%) |
| 18 to 34 Years | 0 (0.0%) | 0 (0.0%) |
| 35 to 64 Years | 75 (4.8%) | 43 (2.1%) |
| 65 to 74 Years | 70 (17.8%) | 70 (19.7%) |
| 75 Years and over | 92 (19.2%) | 84 (18.5%) |
Disability Class: Self-Care Difficulty
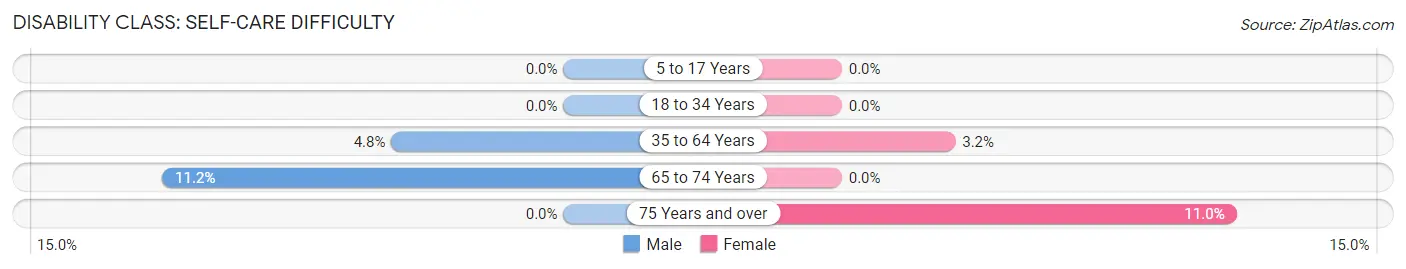
| Age Bracket | Male | Female |
| 5 to 17 Years | 0 (0.0%) | 0 (0.0%) |
| 18 to 34 Years | 0 (0.0%) | 0 (0.0%) |
| 35 to 64 Years | 75 (4.8%) | 64 (3.2%) |
| 65 to 74 Years | 44 (11.2%) | 0 (0.0%) |
| 75 Years and over | 0 (0.0%) | 50 (11.0%) |
Technology Access in Templeton
Computing Device Access in Templeton
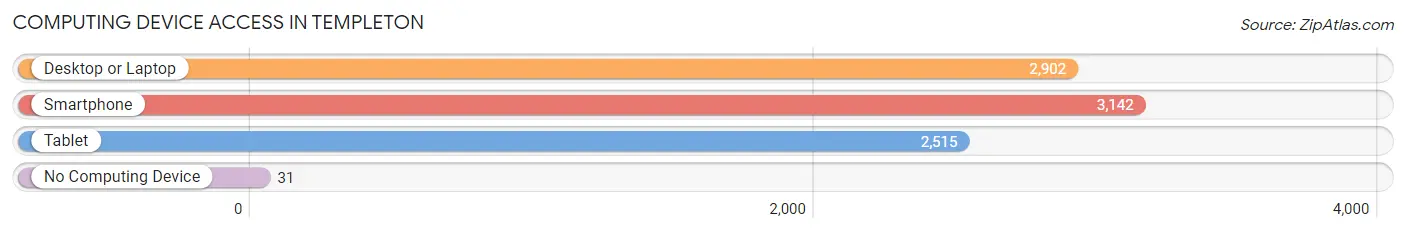
| Device Type | # Households | % Households |
| Desktop or Laptop | 2,902 | 87.0% |
| Smartphone | 3,142 | 94.2% |
| Tablet | 2,515 | 75.4% |
| No Computing Device | 31 | 0.9% |
| Total | 3,334 | 100.0% |
Internet Access in Templeton
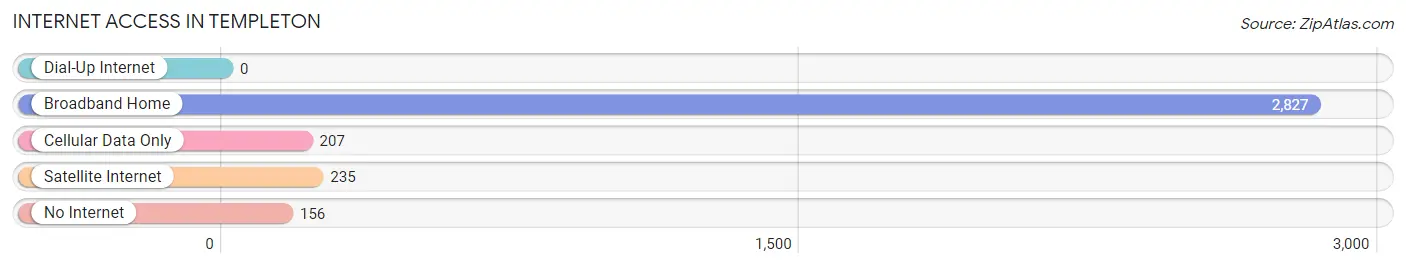
| Internet Type | # Households | % Households |
| Dial-Up Internet | 0 | 0.0% |
| Broadband Home | 2,827 | 84.8% |
| Cellular Data Only | 207 | 6.2% |
| Satellite Internet | 235 | 7.0% |
| No Internet | 156 | 4.7% |
| Total | 3,334 | 100.0% |
Templeton Summary
Templeton is a small town located in San Luis Obispo County, California. It is situated in the northern part of the county, about halfway between San Luis Obispo and Paso Robles. The town has a population of approximately 7,500 people and is known for its rural atmosphere and small-town charm.
History
The area that is now Templeton was originally inhabited by the Salinan Indians, who were hunter-gatherers. The first European settlers arrived in the area in the late 1800s, and the town was officially founded in 1887. The town was named after a local rancher, William Templeton, who had a large ranch in the area.
The town grew slowly over the years, and by the early 1900s, it had become a popular destination for tourists. The town was known for its hot springs, which were believed to have healing properties. The town also had a thriving agricultural industry, with many local farmers growing grapes, olives, and other crops.
In the 1950s, the town began to experience a period of growth and development. The local economy was bolstered by the construction of a new highway, which connected the town to the larger cities of San Luis Obispo and Paso Robles. The town also experienced a population boom, as many people moved to the area to take advantage of the new job opportunities.
Geography
Templeton is located in the northern part of San Luis Obispo County, about halfway between San Luis Obispo and Paso Robles. The town is situated in a valley, surrounded by rolling hills and mountains. The Santa Lucia Mountains are located to the east of the town, while the Santa Margarita Mountains are located to the west.
The town is located at an elevation of about 1,000 feet, and the climate is generally mild and sunny. The average temperature in the summer is around 75 degrees Fahrenheit, while the average temperature in the winter is around 55 degrees Fahrenheit.
Economy
The economy of Templeton is largely based on agriculture and tourism. The town is home to several wineries, which produce a variety of wines. The local farmers also grow a variety of crops, including grapes, olives, and other fruits and vegetables.
The town is also a popular tourist destination, as it is located close to several popular attractions, such as Hearst Castle and the Piedras Blancas Light Station. The town also has several restaurants, shops, and other businesses that cater to tourists.
Demographics
As of the 2010 census, the population of Templeton was 7,527. The racial makeup of the town was 87.3% White, 0.7% African American, 0.7% Native American, 0.9% Asian, 0.1% Pacific Islander, 8.2% from other races, and 2.2% from two or more races. Hispanic or Latino of any race were 18.2% of the population.
The median household income in Templeton was $60,945, and the median family income was $68,958. The per capita income was $27,945. About 8.3% of families and 11.2% of the population were below the poverty line, including 15.2% of those under age 18 and 5.2% of those age 65 or over.
Common Questions
What is Per Capita Income in Templeton?
Per Capita income in Templeton is $50,322.
What is the Median Family Income in Templeton?
Median Family Income in Templeton is $150,423.
What is the Median Household income in Templeton?
Median Household Income in Templeton is $116,316.
What is Income or Wage Gap in Templeton?
Income or Wage Gap in Templeton is 47.7%.
Women in Templeton earn 52.3 cents for every dollar earned by a man.
What is Inequality or Gini Index in Templeton?
Inequality or Gini Index in Templeton is 0.37.
What is the Total Population of Templeton?
Total Population of Templeton is 8,614.
What is the Total Male Population of Templeton?
Total Male Population of Templeton is 3,864.
What is the Total Female Population of Templeton?
Total Female Population of Templeton is 4,750.
What is the Ratio of Males per 100 Females in Templeton?
There are 81.35 Males per 100 Females in Templeton.
What is the Ratio of Females per 100 Males in Templeton?
There are 122.93 Females per 100 Males in Templeton.
What is the Median Population Age in Templeton?
Median Population Age in Templeton is 44.5 Years.
What is the Average Family Size in Templeton
Average Family Size in Templeton is 2.8 People.
What is the Average Household Size in Templeton
Average Household Size in Templeton is 2.5 People.
How Large is the Labor Force in Templeton?
There are 4,558 People in the Labor Forcein in Templeton.
What is the Percentage of People in the Labor Force in Templeton?
66.1% of People are in the Labor Force in Templeton.
What is the Unemployment Rate in Templeton?
Unemployment Rate in Templeton is 5.6%.