Cities with the Lowest Poverty Level Among Families in Massachusetts
RELATED REPORTS & OPTIONS
Lowest Family Poverty
Massachusetts
Compare Cities
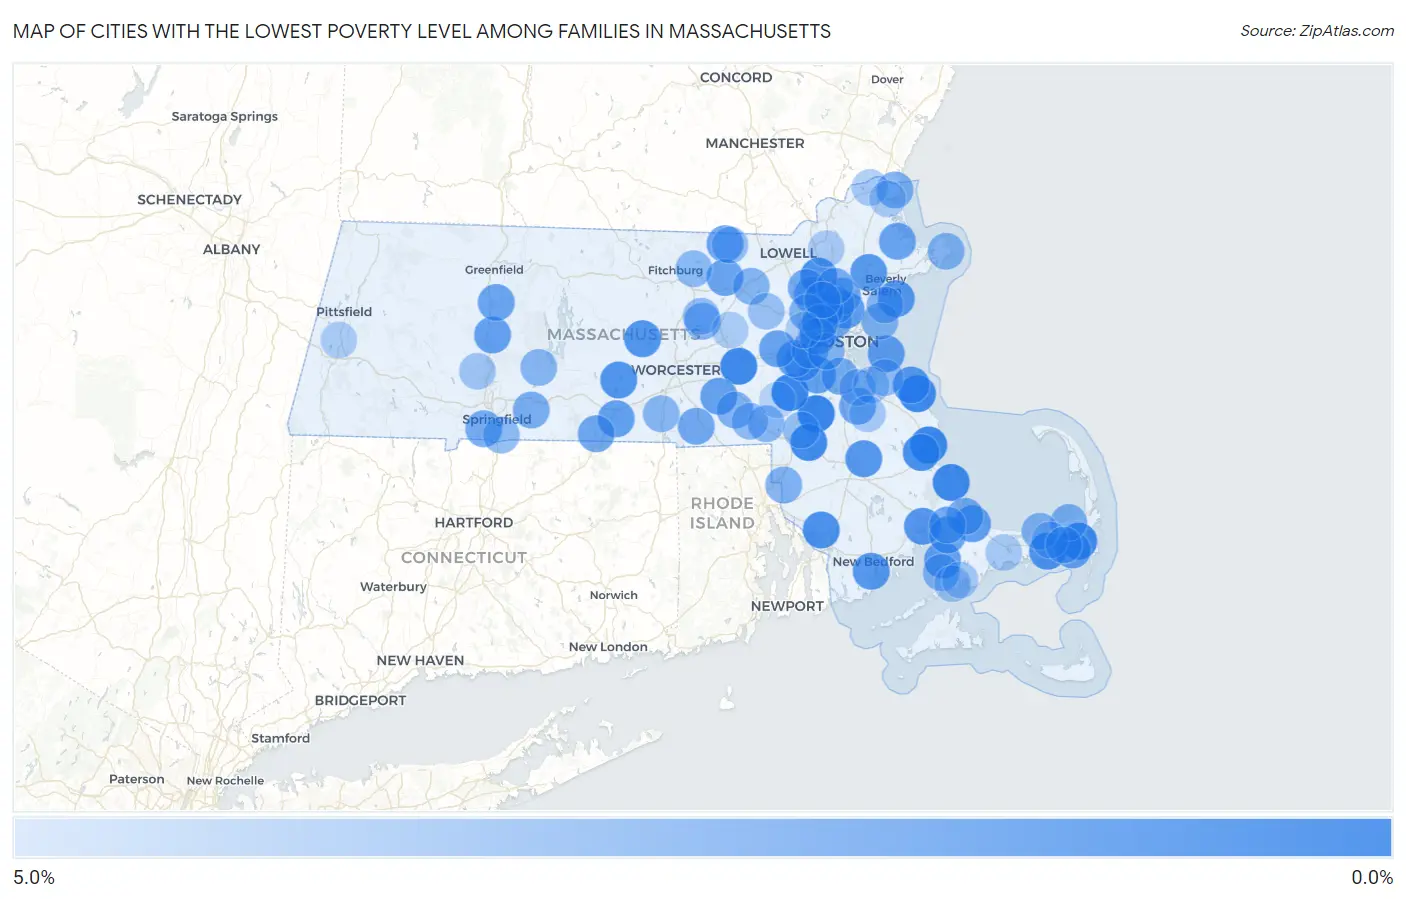
Map of Cities with the Lowest Poverty Level Among Families in Massachusetts
5.0%
0.0%
Cities with the Lowest Poverty Level Among Families in Massachusetts
| City | Family Poverty | vs State | vs National | |
| 1. | Sharon | 0.59% | 6.5%(-5.93)#1 | 8.8%(-8.19)#152 |
| 2. | Medfield | 0.64% | 6.5%(-5.89)#2 | 8.8%(-8.15)#176 |
| 3. | South Duxbury | 0.81% | 6.5%(-5.71)#3 | 8.8%(-7.97)#324 |
| 4. | The Pinehills | 0.82% | 6.5%(-5.70)#4 | 8.8%(-7.96)#336 |
| 5. | Scituate | 0.86% | 6.5%(-5.66)#5 | 8.8%(-7.92)#380 |
| 6. | East Harwich | 0.88% | 6.5%(-5.64)#6 | 8.8%(-7.91)#398 |
| 7. | Cordaville | 0.90% | 6.5%(-5.63)#7 | 8.8%(-7.89)#422 |
| 8. | Mansfield Center | 0.95% | 6.5%(-5.57)#8 | 8.8%(-7.83)#475 |
| 9. | Kingston | 1.2% | 6.5%(-5.36)#9 | 8.8%(-7.62)#706 |
| 10. | Wilmington | 1.3% | 6.5%(-5.22)#10 | 8.8%(-7.48)#881 |
| 11. | Somerset | 1.3% | 6.5%(-5.21)#11 | 8.8%(-7.47)#897 |
| 12. | West Dennis | 1.3% | 6.5%(-5.19)#12 | 8.8%(-7.45)#922 |
| 13. | East Brookfield | 1.4% | 6.5%(-5.09)#13 | 8.8%(-7.35)#1,044 |
| 14. | Rutland | 1.5% | 6.5%(-4.99)#14 | 8.8%(-7.25)#1,197 |
| 15. | Wareham Center | 1.6% | 6.5%(-4.95)#15 | 8.8%(-7.21)#1,255 |
| 16. | Marblehead | 1.6% | 6.5%(-4.94)#16 | 8.8%(-7.20)#1,267 |
| 17. | Bridgewater Town | 1.6% | 6.5%(-4.87)#17 | 8.8%(-7.13)#1,353 |
| 18. | Bliss Corner | 1.7% | 6.5%(-4.87)#18 | 8.8%(-7.13)#1,361 |
| 19. | North Scituate | 1.8% | 6.5%(-4.76)#19 | 8.8%(-7.02)#1,529 |
| 20. | Danvers | 1.8% | 6.5%(-4.73)#20 | 8.8%(-6.99)#1,579 |
| 21. | Melrose | 1.8% | 6.5%(-4.68)#21 | 8.8%(-6.94)#1,651 |
| 22. | Sandwich | 1.9% | 6.5%(-4.58)#22 | 8.8%(-6.84)#1,807 |
| 23. | Hull | 2.0% | 6.5%(-4.52)#23 | 8.8%(-6.78)#1,897 |
| 24. | North Falmouth | 2.0% | 6.5%(-4.50)#24 | 8.8%(-6.76)#1,911 |
| 25. | Dedham | 2.0% | 6.5%(-4.48)#25 | 8.8%(-6.74)#1,955 |
| 26. | Sturbridge | 2.1% | 6.5%(-4.44)#26 | 8.8%(-6.70)#2,000 |
| 27. | Needham | 2.1% | 6.5%(-4.40)#27 | 8.8%(-6.66)#2,063 |
| 28. | Hatfield | 2.1% | 6.5%(-4.39)#28 | 8.8%(-6.65)#2,079 |
| 29. | Upton | 2.2% | 6.5%(-4.31)#29 | 8.8%(-6.57)#2,197 |
| 30. | Harwich Port | 2.2% | 6.5%(-4.31)#30 | 8.8%(-6.57)#2,198 |
| 31. | Wellesley | 2.2% | 6.5%(-4.30)#31 | 8.8%(-6.56)#2,229 |
| 32. | Cochituate | 2.2% | 6.5%(-4.29)#32 | 8.8%(-6.55)#2,236 |
| 33. | Pepperell | 2.3% | 6.5%(-4.22)#33 | 8.8%(-6.48)#2,355 |
| 34. | South Deerfield | 2.3% | 6.5%(-4.21)#34 | 8.8%(-6.47)#2,364 |
| 35. | Ipswich | 2.3% | 6.5%(-4.19)#35 | 8.8%(-6.45)#2,403 |
| 36. | Ayer | 2.3% | 6.5%(-4.17)#36 | 8.8%(-6.43)#2,427 |
| 37. | Belmont | 2.3% | 6.5%(-4.17)#37 | 8.8%(-6.43)#2,429 |
| 38. | Monument Beach | 2.4% | 6.5%(-4.16)#38 | 8.8%(-6.42)#2,442 |
| 39. | Medford | 2.5% | 6.5%(-4.04)#39 | 8.8%(-6.30)#2,640 |
| 40. | Holland | 2.5% | 6.5%(-4.03)#40 | 8.8%(-6.29)#2,668 |
| 41. | Holbrook | 2.5% | 6.5%(-3.99)#41 | 8.8%(-6.25)#2,729 |
| 42. | East Douglas | 2.5% | 6.5%(-3.98)#42 | 8.8%(-6.24)#2,741 |
| 43. | Milton | 2.6% | 6.5%(-3.89)#43 | 8.8%(-6.15)#2,912 |
| 44. | Burlington | 2.7% | 6.5%(-3.86)#44 | 8.8%(-6.12)#2,960 |
| 45. | Pinehurst | 2.7% | 6.5%(-3.84)#45 | 8.8%(-6.10)#2,993 |
| 46. | North Attleborough | 2.7% | 6.5%(-3.84)#46 | 8.8%(-6.10)#2,997 |
| 47. | Wakefield | 2.7% | 6.5%(-3.84)#47 | 8.8%(-6.10)#3,000 |
| 48. | Stoneham | 2.7% | 6.5%(-3.82)#48 | 8.8%(-6.08)#3,023 |
| 49. | Agawam Town | 2.7% | 6.5%(-3.79)#49 | 8.8%(-6.06)#3,070 |
| 50. | Winchester | 2.7% | 6.5%(-3.79)#50 | 8.8%(-6.05)#3,072 |
| 51. | Sagamore | 2.7% | 6.5%(-3.79)#51 | 8.8%(-6.05)#3,080 |
| 52. | Buzzards Bay | 2.7% | 6.5%(-3.79)#52 | 8.8%(-6.05)#3,085 |
| 53. | Reading | 2.7% | 6.5%(-3.78)#53 | 8.8%(-6.04)#3,100 |
| 54. | Wilbraham | 2.9% | 6.5%(-3.67)#54 | 8.8%(-5.93)#3,295 |
| 55. | Brewster | 2.9% | 6.5%(-3.60)#55 | 8.8%(-5.86)#3,417 |
| 56. | Newton | 2.9% | 6.5%(-3.58)#56 | 8.8%(-5.84)#3,443 |
| 57. | Salisbury | 3.0% | 6.5%(-3.56)#57 | 8.8%(-5.82)#3,500 |
| 58. | Lexington | 3.0% | 6.5%(-3.55)#58 | 8.8%(-5.81)#3,509 |
| 59. | North Seekonk | 3.1% | 6.5%(-3.47)#59 | 8.8%(-5.73)#3,638 |
| 60. | Hopedale | 3.1% | 6.5%(-3.42)#60 | 8.8%(-5.69)#3,708 |
| 61. | Watertown Town | 3.1% | 6.5%(-3.40)#61 | 8.8%(-5.66)#3,748 |
| 62. | Clinton | 3.1% | 6.5%(-3.38)#62 | 8.8%(-5.64)#3,792 |
| 63. | West Falmouth | 3.2% | 6.5%(-3.33)#63 | 8.8%(-5.59)#3,871 |
| 64. | Rockport | 3.2% | 6.5%(-3.31)#64 | 8.8%(-5.57)#3,893 |
| 65. | Dennis | 3.2% | 6.5%(-3.29)#65 | 8.8%(-5.55)#3,936 |
| 66. | Brookline | 3.2% | 6.5%(-3.29)#66 | 8.8%(-5.55)#3,938 |
| 67. | Nahant | 3.3% | 6.5%(-3.27)#67 | 8.8%(-5.53)#3,967 |
| 68. | Littleton Common | 3.3% | 6.5%(-3.26)#68 | 8.8%(-5.52)#3,973 |
| 69. | Swampscott | 3.3% | 6.5%(-3.26)#69 | 8.8%(-5.52)#3,975 |
| 70. | Belchertown | 3.3% | 6.5%(-3.18)#70 | 8.8%(-5.44)#4,141 |
| 71. | Oxford | 3.4% | 6.5%(-3.15)#71 | 8.8%(-5.41)#4,169 |
| 72. | Franklin Town | 3.4% | 6.5%(-3.14)#72 | 8.8%(-5.40)#4,190 |
| 73. | Lunenburg | 3.5% | 6.5%(-3.06)#73 | 8.8%(-5.32)#4,327 |
| 74. | Longmeadow | 3.5% | 6.5%(-3.05)#74 | 8.8%(-5.31)#4,328 |
| 75. | Arlington | 3.5% | 6.5%(-2.99)#75 | 8.8%(-5.25)#4,408 |
| 76. | Hingham | 3.6% | 6.5%(-2.95)#76 | 8.8%(-5.22)#4,473 |
| 77. | Bellingham | 3.6% | 6.5%(-2.92)#77 | 8.8%(-5.18)#4,560 |
| 78. | Woburn | 3.6% | 6.5%(-2.88)#78 | 8.8%(-5.14)#4,627 |
| 79. | South Dennis | 3.7% | 6.5%(-2.80)#79 | 8.8%(-5.06)#4,750 |
| 80. | Braintree Town | 3.7% | 6.5%(-2.79)#80 | 8.8%(-5.05)#4,786 |
| 81. | Northwest Harwich | 3.8% | 6.5%(-2.76)#81 | 8.8%(-5.02)#4,827 |
| 82. | South Lancaster | 3.8% | 6.5%(-2.74)#82 | 8.8%(-5.00)#4,856 |
| 83. | East Pepperell | 3.8% | 6.5%(-2.73)#83 | 8.8%(-4.99)#4,871 |
| 84. | Foxborough | 3.8% | 6.5%(-2.67)#84 | 8.8%(-4.93)#4,967 |
| 85. | West Concord | 4.0% | 6.5%(-2.56)#85 | 8.8%(-4.82)#5,129 |
| 86. | Easthampton Town | 4.1% | 6.5%(-2.39)#86 | 8.8%(-4.65)#5,396 |
| 87. | Teaticket | 4.2% | 6.5%(-2.30)#87 | 8.8%(-4.56)#5,532 |
| 88. | Cedar Crest | 4.3% | 6.5%(-2.20)#88 | 8.8%(-4.46)#5,694 |
| 89. | Amherst | 4.3% | 6.5%(-2.17)#89 | 8.8%(-4.43)#5,731 |
| 90. | Weymouth Town | 4.4% | 6.5%(-2.15)#90 | 8.8%(-4.41)#5,794 |
| 91. | East Falmouth | 4.4% | 6.5%(-2.13)#91 | 8.8%(-4.39)#5,815 |
| 92. | Abington | 4.4% | 6.5%(-2.12)#92 | 8.8%(-4.38)#5,824 |
| 93. | Amesbury Town | 4.4% | 6.5%(-2.12)#93 | 8.8%(-4.38)#5,826 |
| 94. | Barnstable Town | 4.5% | 6.5%(-2.07)#94 | 8.8%(-4.33)#5,898 |
| 95. | Andover | 4.5% | 6.5%(-2.04)#95 | 8.8%(-4.30)#5,943 |
| 96. | Newburyport | 4.5% | 6.5%(-1.97)#96 | 8.8%(-4.23)#6,059 |
| 97. | Lenox | 4.6% | 6.5%(-1.95)#97 | 8.8%(-4.21)#6,086 |
| 98. | Hudson | 4.6% | 6.5%(-1.94)#98 | 8.8%(-4.20)#6,103 |
| 99. | Waltham | 4.6% | 6.5%(-1.90)#99 | 8.8%(-4.16)#6,175 |
| 100. | Millis Clicquot | 5.0% | 6.5%(-1.57)#100 | 8.8%(-3.83)#6,668 |
Common Questions
What are the Top 10 Cities with the Lowest Poverty Level Among Families in Massachusetts?
Top 10 Cities with the Lowest Poverty Level Among Families in Massachusetts are:
#1
0.59%
#2
0.64%
#3
0.81%
#4
0.82%
#5
0.86%
#6
0.88%
#7
0.90%
#8
0.95%
#9
1.2%
#10
1.3%
What city has the Lowest Poverty Level Among Families in Massachusetts?
Sharon has the Lowest Poverty Level Among Families in Massachusetts with 0.59%.
What is the Poverty Level Among Families in the State of Massachusetts?
Poverty Level Among Families in Massachusetts is 6.5%.
What is the Poverty Level Among Families in the United States?
Poverty Level Among Families in the United States is 8.8%.