Cities with the Lowest Poverty Level Among Families in Kansas
RELATED REPORTS & OPTIONS
Lowest Family Poverty
Kansas
Compare Cities
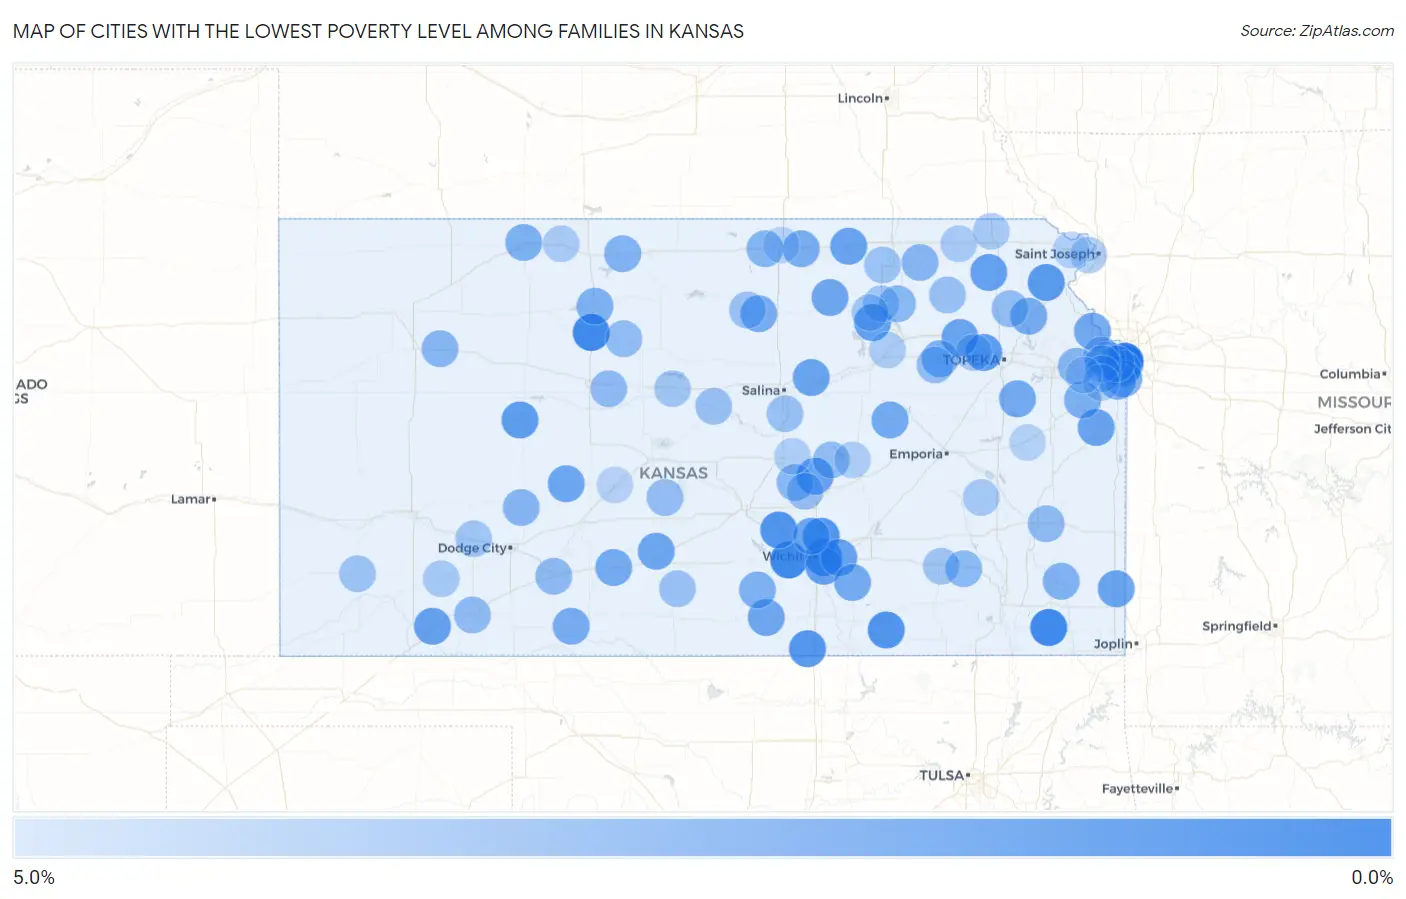
Map of Cities with the Lowest Poverty Level Among Families in Kansas
5.0%
0.0%
Cities with the Lowest Poverty Level Among Families in Kansas
| City | Family Poverty | vs State | vs National | |
| 1. | Mission Hills | 0.093% | 7.6%(-7.55)#1 | 8.8%(-8.69)#3 |
| 2. | Altamont | 0.35% | 7.6%(-7.29)#2 | 8.8%(-8.43)#39 |
| 3. | Plainville | 0.37% | 7.6%(-7.28)#3 | 8.8%(-8.41)#41 |
| 4. | Goddard | 0.41% | 7.6%(-7.24)#4 | 8.8%(-8.37)#47 |
| 5. | Eastborough | 0.88% | 7.6%(-6.77)#5 | 8.8%(-7.90)#403 |
| 6. | Dexter | 0.91% | 7.6%(-6.74)#6 | 8.8%(-7.87)#437 |
| 7. | Mount Hope | 0.98% | 7.6%(-6.67)#7 | 8.8%(-7.81)#506 |
| 8. | Kechi | 0.98% | 7.6%(-6.67)#8 | 8.8%(-7.80)#510 |
| 9. | South Haven | 1.1% | 7.6%(-6.56)#9 | 8.8%(-7.69)#637 |
| 10. | Lancaster | 1.2% | 7.6%(-6.43)#10 | 8.8%(-7.56)#788 |
| 11. | Silver Lake | 1.3% | 7.6%(-6.32)#11 | 8.8%(-7.45)#918 |
| 12. | Ransom | 1.4% | 7.6%(-6.26)#12 | 8.8%(-7.39)#991 |
| 13. | Westwood | 1.6% | 7.6%(-6.09)#13 | 8.8%(-7.23)#1,231 |
| 14. | Wetmore | 1.6% | 7.6%(-6.08)#14 | 8.8%(-7.22)#1,242 |
| 15. | Westwood Hills | 1.6% | 7.6%(-6.06)#15 | 8.8%(-7.19)#1,275 |
| 16. | Riley | 1.6% | 7.6%(-6.05)#16 | 8.8%(-7.18)#1,291 |
| 17. | Mcconnell Afb | 1.6% | 7.6%(-6.02)#17 | 8.8%(-7.16)#1,329 |
| 18. | Goessel | 1.7% | 7.6%(-5.98)#18 | 8.8%(-7.12)#1,381 |
| 19. | Kismet | 1.7% | 7.6%(-5.98)#19 | 8.8%(-7.12)#1,382 |
| 20. | Frontenac | 1.7% | 7.6%(-5.94)#20 | 8.8%(-7.07)#1,436 |
| 21. | Andover | 1.7% | 7.6%(-5.93)#21 | 8.8%(-7.07)#1,448 |
| 22. | St Marys | 1.7% | 7.6%(-5.93)#22 | 8.8%(-7.06)#1,464 |
| 23. | Washington | 1.7% | 7.6%(-5.92)#23 | 8.8%(-7.05)#1,483 |
| 24. | Paola | 1.7% | 7.6%(-5.91)#24 | 8.8%(-7.04)#1,494 |
| 25. | Solomon | 1.8% | 7.6%(-5.86)#25 | 8.8%(-6.99)#1,583 |
| 26. | Prairie Village | 1.9% | 7.6%(-5.79)#26 | 8.8%(-6.92)#1,670 |
| 27. | Valley Center | 1.9% | 7.6%(-5.79)#27 | 8.8%(-6.92)#1,675 |
| 28. | Burdett | 1.9% | 7.6%(-5.76)#28 | 8.8%(-6.89)#1,719 |
| 29. | Iuka | 1.9% | 7.6%(-5.76)#29 | 8.8%(-6.89)#1,724 |
| 30. | Argonia | 1.9% | 7.6%(-5.72)#30 | 8.8%(-6.86)#1,783 |
| 31. | Morganville | 1.9% | 7.6%(-5.72)#31 | 8.8%(-6.86)#1,788 |
| 32. | Lansing | 2.0% | 7.6%(-5.62)#32 | 8.8%(-6.75)#1,935 |
| 33. | Wilsey | 2.0% | 7.6%(-5.61)#33 | 8.8%(-6.74)#1,953 |
| 34. | Overbrook | 2.0% | 7.6%(-5.60)#34 | 8.8%(-6.73)#1,958 |
| 35. | Douglass | 2.1% | 7.6%(-5.53)#35 | 8.8%(-6.67)#2,053 |
| 36. | Haviland | 2.1% | 7.6%(-5.52)#36 | 8.8%(-6.65)#2,071 |
| 37. | Glasco | 2.2% | 7.6%(-5.42)#37 | 8.8%(-6.56)#2,215 |
| 38. | Valley Falls | 2.2% | 7.6%(-5.41)#38 | 8.8%(-6.55)#2,248 |
| 39. | Protection | 2.2% | 7.6%(-5.41)#39 | 8.8%(-6.54)#2,250 |
| 40. | Cuba | 2.3% | 7.6%(-5.35)#40 | 8.8%(-6.48)#2,354 |
| 41. | Leawood | 2.4% | 7.6%(-5.29)#41 | 8.8%(-6.43)#2,430 |
| 42. | Mcfarland | 2.4% | 7.6%(-5.27)#42 | 8.8%(-6.40)#2,474 |
| 43. | Overland Park | 2.4% | 7.6%(-5.26)#43 | 8.8%(-6.40)#2,489 |
| 44. | Norton | 2.4% | 7.6%(-5.20)#44 | 8.8%(-6.34)#2,594 |
| 45. | Edgerton | 2.4% | 7.6%(-5.20)#45 | 8.8%(-6.33)#2,598 |
| 46. | Stockton | 2.5% | 7.6%(-5.17)#46 | 8.8%(-6.30)#2,639 |
| 47. | Norwich | 2.5% | 7.6%(-5.15)#47 | 8.8%(-6.28)#2,684 |
| 48. | St Paul | 2.6% | 7.6%(-5.08)#48 | 8.8%(-6.22)#2,779 |
| 49. | Lake Quivira | 2.6% | 7.6%(-5.05)#49 | 8.8%(-6.18)#2,853 |
| 50. | Merriam | 2.6% | 7.6%(-5.02)#50 | 8.8%(-6.15)#2,892 |
| 51. | Kensington | 2.6% | 7.6%(-5.02)#51 | 8.8%(-6.15)#2,894 |
| 52. | Scandia | 2.7% | 7.6%(-4.94)#52 | 8.8%(-6.08)#3,030 |
| 53. | Linwood | 2.8% | 7.6%(-4.89)#53 | 8.8%(-6.03)#3,117 |
| 54. | Jetmore | 2.8% | 7.6%(-4.88)#54 | 8.8%(-6.02)#3,129 |
| 55. | Grinnell | 2.8% | 7.6%(-4.87)#55 | 8.8%(-6.00)#3,160 |
| 56. | Frankfort | 2.8% | 7.6%(-4.84)#56 | 8.8%(-5.97)#3,216 |
| 57. | Moundridge | 2.8% | 7.6%(-4.83)#57 | 8.8%(-5.96)#3,246 |
| 58. | Olsburg | 2.9% | 7.6%(-4.79)#58 | 8.8%(-5.92)#3,308 |
| 59. | Fall River | 2.9% | 7.6%(-4.71)#59 | 8.8%(-5.84)#3,462 |
| 60. | Victoria | 3.0% | 7.6%(-4.65)#60 | 8.8%(-5.78)#3,560 |
| 61. | La Harpe | 3.0% | 7.6%(-4.65)#61 | 8.8%(-5.78)#3,561 |
| 62. | Bucklin | 3.0% | 7.6%(-4.63)#62 | 8.8%(-5.77)#3,579 |
| 63. | Meade | 3.1% | 7.6%(-4.59)#63 | 8.8%(-5.72)#3,647 |
| 64. | Natoma | 3.1% | 7.6%(-4.55)#64 | 8.8%(-5.68)#3,717 |
| 65. | Denison | 3.1% | 7.6%(-4.52)#65 | 8.8%(-5.66)#3,776 |
| 66. | Hillsboro | 3.1% | 7.6%(-4.52)#66 | 8.8%(-5.65)#3,783 |
| 67. | Alma | 3.2% | 7.6%(-4.46)#67 | 8.8%(-5.60)#3,857 |
| 68. | Hudson | 3.2% | 7.6%(-4.42)#68 | 8.8%(-5.56)#3,929 |
| 69. | Hesston | 3.3% | 7.6%(-4.39)#69 | 8.8%(-5.52)#3,972 |
| 70. | Edwardsville | 3.3% | 7.6%(-4.30)#70 | 8.8%(-5.44)#4,134 |
| 71. | Onaga | 3.4% | 7.6%(-4.29)#71 | 8.8%(-5.42)#4,162 |
| 72. | Ellsworth | 3.4% | 7.6%(-4.28)#72 | 8.8%(-5.42)#4,166 |
| 73. | Assaria | 3.4% | 7.6%(-4.23)#73 | 8.8%(-5.36)#4,253 |
| 74. | Isabel | 3.4% | 7.6%(-4.20)#74 | 8.8%(-5.33)#4,306 |
| 75. | Simpson | 3.4% | 7.6%(-4.20)#75 | 8.8%(-5.33)#4,309 |
| 76. | Waterville | 3.5% | 7.6%(-4.16)#76 | 8.8%(-5.30)#4,347 |
| 77. | Shawnee | 3.5% | 7.6%(-4.16)#77 | 8.8%(-5.29)#4,355 |
| 78. | Ulysses | 3.5% | 7.6%(-4.14)#78 | 8.8%(-5.28)#4,379 |
| 79. | Severy | 3.6% | 7.6%(-4.08)#79 | 8.8%(-5.21)#4,500 |
| 80. | Cimarron | 3.6% | 7.6%(-4.03)#80 | 8.8%(-5.17)#4,573 |
| 81. | Dorrance | 3.7% | 7.6%(-3.94)#81 | 8.8%(-5.08)#4,726 |
| 82. | Randolph | 3.7% | 7.6%(-3.94)#82 | 8.8%(-5.08)#4,728 |
| 83. | Willard | 3.7% | 7.6%(-3.94)#83 | 8.8%(-5.08)#4,735 |
| 84. | Leonardville | 3.7% | 7.6%(-3.92)#84 | 8.8%(-5.05)#4,778 |
| 85. | Wathena | 3.8% | 7.6%(-3.83)#85 | 8.8%(-4.96)#4,907 |
| 86. | Copeland | 3.8% | 7.6%(-3.80)#86 | 8.8%(-4.94)#4,946 |
| 87. | Gridley | 3.8% | 7.6%(-3.80)#87 | 8.8%(-4.94)#4,947 |
| 88. | Seneca | 3.9% | 7.6%(-3.73)#88 | 8.8%(-4.86)#5,047 |
| 89. | Prairie View | 3.9% | 7.6%(-3.73)#89 | 8.8%(-4.86)#5,065 |
| 90. | Lenexa | 3.9% | 7.6%(-3.71)#90 | 8.8%(-4.84)#5,089 |
| 91. | Sabetha | 3.9% | 7.6%(-3.70)#91 | 8.8%(-4.84)#5,093 |
| 92. | Ogden | 4.0% | 7.6%(-3.69)#92 | 8.8%(-4.83)#5,117 |
| 93. | Marion | 4.0% | 7.6%(-3.61)#93 | 8.8%(-4.75)#5,238 |
| 94. | Galva | 4.1% | 7.6%(-3.50)#94 | 8.8%(-4.64)#5,413 |
| 95. | Troy | 4.2% | 7.6%(-3.48)#95 | 8.8%(-4.62)#5,442 |
| 96. | Olathe | 4.2% | 7.6%(-3.47)#96 | 8.8%(-4.60)#5,467 |
| 97. | De Soto | 4.2% | 7.6%(-3.42)#97 | 8.8%(-4.56)#5,540 |
| 98. | Williamsburg | 4.2% | 7.6%(-3.41)#98 | 8.8%(-4.54)#5,555 |
| 99. | Larned | 4.3% | 7.6%(-3.31)#99 | 8.8%(-4.45)#5,714 |
| 100. | Belleville | 4.3% | 7.6%(-3.31)#100 | 8.8%(-4.44)#5,721 |
Common Questions
What are the Top 10 Cities with the Lowest Poverty Level Among Families in Kansas?
Top 10 Cities with the Lowest Poverty Level Among Families in Kansas are:
#1
0.093%
#2
0.35%
#3
0.37%
#4
0.41%
#5
0.88%
#6
0.91%
#7
0.98%
#8
0.98%
#9
1.1%
#10
1.2%
What city has the Lowest Poverty Level Among Families in Kansas?
Mission Hills has the Lowest Poverty Level Among Families in Kansas with 0.093%.
What is the Poverty Level Among Families in the State of Kansas?
Poverty Level Among Families in Kansas is 7.6%.
What is the Poverty Level Among Families in the United States?
Poverty Level Among Families in the United States is 8.8%.