Cities with the Lowest Poverty Level Among Families in Pennsylvania
RELATED REPORTS & OPTIONS
Lowest Family Poverty
Pennsylvania
Compare Cities
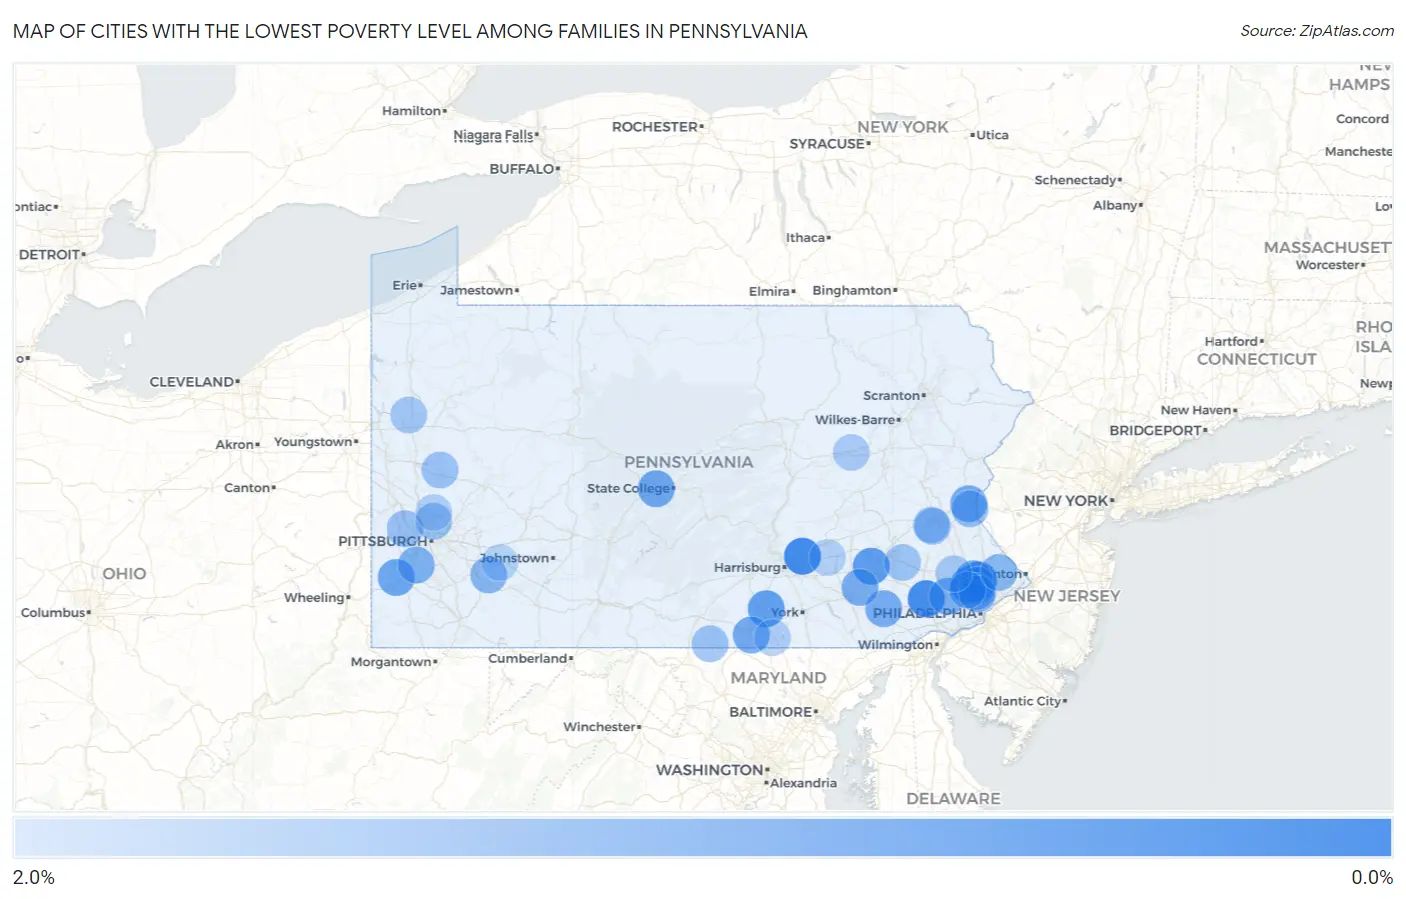
Map of Cities with the Lowest Poverty Level Among Families in Pennsylvania
2.0%
0.0%
Cities with the Lowest Poverty Level Among Families in Pennsylvania
| City | Family Poverty | vs State | vs National | |
| 1. | Media Borough | 0.077% | 8.0%(-7.92)#1 | 8.8%(-8.71)#1 |
| 2. | Skyline View | 0.19% | 8.0%(-7.81)#2 | 8.8%(-8.60)#7 |
| 3. | Lionville | 0.24% | 8.0%(-7.76)#3 | 8.8%(-8.54)#11 |
| 4. | Blue Bell | 0.42% | 8.0%(-7.58)#4 | 8.8%(-8.37)#51 |
| 5. | Freeburg Borough | 0.44% | 8.0%(-7.56)#5 | 8.8%(-8.34)#58 |
| 6. | Laflin Borough | 0.45% | 8.0%(-7.55)#6 | 8.8%(-8.33)#62 |
| 7. | Maple Glen | 0.47% | 8.0%(-7.53)#7 | 8.8%(-8.32)#69 |
| 8. | Forest Hills Borough | 0.47% | 8.0%(-7.52)#8 | 8.8%(-8.31)#73 |
| 9. | Clarks Summit Borough | 0.48% | 8.0%(-7.52)#9 | 8.8%(-8.30)#75 |
| 10. | Reinholds | 0.50% | 8.0%(-7.50)#10 | 8.8%(-8.28)#85 |
| 11. | Churchill Borough | 0.56% | 8.0%(-7.44)#11 | 8.8%(-8.22)#123 |
| 12. | Lake Meade | 0.56% | 8.0%(-7.44)#12 | 8.8%(-8.22)#125 |
| 13. | Callery Borough | 0.57% | 8.0%(-7.43)#13 | 8.8%(-8.21)#133 |
| 14. | Fox Chapel Borough | 0.58% | 8.0%(-7.41)#14 | 8.8%(-8.20)#146 |
| 15. | New Stanton Borough | 0.63% | 8.0%(-7.37)#15 | 8.8%(-8.15)#173 |
| 16. | Edgeworth Borough | 0.66% | 8.0%(-7.34)#16 | 8.8%(-8.12)#193 |
| 17. | Tatamy Borough | 0.67% | 8.0%(-7.33)#17 | 8.8%(-8.11)#202 |
| 18. | Wolfdale | 0.68% | 8.0%(-7.32)#18 | 8.8%(-8.10)#214 |
| 19. | New Salem Borough | 0.68% | 8.0%(-7.31)#19 | 8.8%(-8.10)#216 |
| 20. | Stormstown | 0.70% | 8.0%(-7.30)#20 | 8.8%(-8.09)#225 |
| 21. | Mcsherrystown Borough | 0.70% | 8.0%(-7.30)#21 | 8.8%(-8.08)#232 |
| 22. | Penn Farms | 0.71% | 8.0%(-7.29)#22 | 8.8%(-8.07)#238 |
| 23. | Clarks Green Borough | 0.73% | 8.0%(-7.27)#23 | 8.8%(-8.05)#255 |
| 24. | Lake Heritage | 0.75% | 8.0%(-7.25)#24 | 8.8%(-8.03)#270 |
| 25. | Palmer Heights | 0.77% | 8.0%(-7.23)#25 | 8.8%(-8.01)#290 |
| 26. | Spring House | 0.78% | 8.0%(-7.22)#26 | 8.8%(-8.00)#302 |
| 27. | Lincoln Borough | 0.78% | 8.0%(-7.22)#27 | 8.8%(-8.00)#304 |
| 28. | Gap | 0.80% | 8.0%(-7.20)#28 | 8.8%(-7.98)#313 |
| 29. | Shrewsbury Borough | 0.80% | 8.0%(-7.20)#29 | 8.8%(-7.98)#319 |
| 30. | Trafford Borough | 0.80% | 8.0%(-7.19)#30 | 8.8%(-7.98)#320 |
| 31. | Conyngham Borough | 0.81% | 8.0%(-7.19)#31 | 8.8%(-7.97)#325 |
| 32. | Brownstown | 0.81% | 8.0%(-7.19)#32 | 8.8%(-7.97)#328 |
| 33. | Villanova | 0.82% | 8.0%(-7.18)#33 | 8.8%(-7.97)#334 |
| 34. | West Homestead Borough | 0.82% | 8.0%(-7.18)#34 | 8.8%(-7.96)#337 |
| 35. | Chesterbrook | 0.83% | 8.0%(-7.17)#35 | 8.8%(-7.95)#353 |
| 36. | Thompsonville | 0.85% | 8.0%(-7.15)#36 | 8.8%(-7.93)#370 |
| 37. | Pleasureville | 0.87% | 8.0%(-7.13)#37 | 8.8%(-7.91)#387 |
| 38. | Cheswick Borough | 0.87% | 8.0%(-7.13)#38 | 8.8%(-7.91)#393 |
| 39. | Fort Washington | 0.88% | 8.0%(-7.12)#39 | 8.8%(-7.90)#401 |
| 40. | Flourtown | 0.89% | 8.0%(-7.11)#40 | 8.8%(-7.89)#411 |
| 41. | Cooperstown Borough | 0.90% | 8.0%(-7.10)#41 | 8.8%(-7.88)#428 |
| 42. | Oakmont Borough | 0.90% | 8.0%(-7.09)#42 | 8.8%(-7.88)#431 |
| 43. | South Greensburg Borough | 0.90% | 8.0%(-7.09)#43 | 8.8%(-7.88)#432 |
| 44. | Frazer | 0.91% | 8.0%(-7.08)#44 | 8.8%(-7.87)#443 |
| 45. | Wyndmoor | 0.94% | 8.0%(-7.05)#45 | 8.8%(-7.84)#470 |
| 46. | Matamoras Borough | 0.94% | 8.0%(-7.05)#46 | 8.8%(-7.84)#471 |
| 47. | Calumet | 0.98% | 8.0%(-7.02)#47 | 8.8%(-7.80)#508 |
| 48. | Plymouth Meeting | 0.98% | 8.0%(-7.02)#48 | 8.8%(-7.80)#517 |
| 49. | Harmony Borough | 0.98% | 8.0%(-7.01)#49 | 8.8%(-7.80)#518 |
| 50. | Youngwood Borough | 1.00% | 8.0%(-7.00)#50 | 8.8%(-7.78)#528 |
| 51. | Richboro | 1.0% | 8.0%(-6.99)#51 | 8.8%(-7.78)#534 |
| 52. | Cherry Tree Borough | 1.0% | 8.0%(-6.99)#52 | 8.8%(-7.77)#542 |
| 53. | Orwigsburg Borough | 1.0% | 8.0%(-6.99)#53 | 8.8%(-7.77)#543 |
| 54. | Jacobus Borough | 1.1% | 8.0%(-6.94)#54 | 8.8%(-7.72)#598 |
| 55. | Langhorne Manor Borough | 1.1% | 8.0%(-6.93)#55 | 8.8%(-7.72)#608 |
| 56. | Hellertown Borough | 1.1% | 8.0%(-6.93)#56 | 8.8%(-7.71)#620 |
| 57. | Hunker Borough | 1.1% | 8.0%(-6.92)#57 | 8.8%(-7.71)#627 |
| 58. | Leetsdale Borough | 1.1% | 8.0%(-6.92)#58 | 8.8%(-7.70)#632 |
| 59. | Lititz Borough | 1.1% | 8.0%(-6.90)#59 | 8.8%(-7.68)#647 |
| 60. | Mount Wolf Borough | 1.1% | 8.0%(-6.90)#60 | 8.8%(-7.68)#648 |
| 61. | Old Orchard | 1.1% | 8.0%(-6.89)#61 | 8.8%(-7.67)#655 |
| 62. | Ancient Oaks | 1.1% | 8.0%(-6.87)#62 | 8.8%(-7.66)#668 |
| 63. | Swarthmore Borough | 1.1% | 8.0%(-6.85)#63 | 8.8%(-7.63)#691 |
| 64. | Mountville Borough | 1.2% | 8.0%(-6.84)#64 | 8.8%(-7.63)#699 |
| 65. | Carroll Valley Borough | 1.2% | 8.0%(-6.84)#65 | 8.8%(-7.62)#710 |
| 66. | Ashland Borough | 1.2% | 8.0%(-6.82)#66 | 8.8%(-7.61)#726 |
| 67. | Carnot Moon | 1.2% | 8.0%(-6.82)#67 | 8.8%(-7.61)#727 |
| 68. | Wayne Heights | 1.2% | 8.0%(-6.81)#68 | 8.8%(-7.59)#752 |
| 69. | Allison Park | 1.2% | 8.0%(-6.81)#69 | 8.8%(-7.59)#753 |
| 70. | Shanor Northvue | 1.2% | 8.0%(-6.79)#70 | 8.8%(-7.58)#764 |
| 71. | Berrysburg Borough | 1.2% | 8.0%(-6.78)#71 | 8.8%(-7.56)#789 |
| 72. | Lorane | 1.2% | 8.0%(-6.77)#72 | 8.8%(-7.55)#798 |
| 73. | Doylestown Borough | 1.2% | 8.0%(-6.77)#73 | 8.8%(-7.55)#799 |
| 74. | Collegeville Borough | 1.2% | 8.0%(-6.77)#74 | 8.8%(-7.55)#800 |
| 75. | Shamokin Dam Borough | 1.2% | 8.0%(-6.77)#75 | 8.8%(-7.55)#804 |
| 76. | Wyomissing Borough | 1.2% | 8.0%(-6.77)#76 | 8.8%(-7.55)#805 |
| 77. | Jersey Shore Borough | 1.2% | 8.0%(-6.75)#77 | 8.8%(-7.53)#827 |
| 78. | Auburn Borough | 1.3% | 8.0%(-6.75)#78 | 8.8%(-7.53)#831 |
| 79. | Lake Latonka | 1.3% | 8.0%(-6.73)#79 | 8.8%(-7.51)#856 |
| 80. | Kennett Square Borough | 1.3% | 8.0%(-6.72)#80 | 8.8%(-7.50)#866 |
| 81. | Barkeyville Borough | 1.3% | 8.0%(-6.70)#81 | 8.8%(-7.48)#879 |
| 82. | Skippack | 1.3% | 8.0%(-6.69)#82 | 8.8%(-7.47)#893 |
| 83. | Delmont Borough | 1.3% | 8.0%(-6.67)#83 | 8.8%(-7.45)#916 |
| 84. | Wormleysburg Borough | 1.3% | 8.0%(-6.67)#84 | 8.8%(-7.45)#920 |
| 85. | Mifflinville | 1.4% | 8.0%(-6.63)#85 | 8.8%(-7.41)#968 |
| 86. | Stillwater Borough | 1.4% | 8.0%(-6.63)#86 | 8.8%(-7.41)#972 |
| 87. | Swedeland | 1.4% | 8.0%(-6.60)#87 | 8.8%(-7.38)#1,005 |
| 88. | Sewickley Heights Borough | 1.4% | 8.0%(-6.60)#88 | 8.8%(-7.38)#1,008 |
| 89. | Trexlertown | 1.4% | 8.0%(-6.59)#89 | 8.8%(-7.37)#1,014 |
| 90. | Pennville | 1.4% | 8.0%(-6.59)#90 | 8.8%(-7.37)#1,022 |
| 91. | Gibsonia | 1.4% | 8.0%(-6.56)#91 | 8.8%(-7.35)#1,058 |
| 92. | Annville | 1.5% | 8.0%(-6.55)#92 | 8.8%(-7.33)#1,078 |
| 93. | Koppel Borough | 1.5% | 8.0%(-6.54)#93 | 8.8%(-7.32)#1,093 |
| 94. | Sewickley Hills Borough | 1.5% | 8.0%(-6.53)#94 | 8.8%(-7.31)#1,103 |
| 95. | Roscoe Borough | 1.5% | 8.0%(-6.53)#95 | 8.8%(-7.31)#1,104 |
| 96. | Fleetwood Borough | 1.5% | 8.0%(-6.52)#96 | 8.8%(-7.31)#1,116 |
| 97. | Lawson Heights | 1.5% | 8.0%(-6.52)#97 | 8.8%(-7.30)#1,123 |
| 98. | Carmichaels Borough | 1.5% | 8.0%(-6.49)#98 | 8.8%(-7.28)#1,150 |
| 99. | Indiana Borough | 1.5% | 8.0%(-6.49)#99 | 8.8%(-7.28)#1,151 |
| 100. | Avonmore Borough | 1.5% | 8.0%(-6.49)#100 | 8.8%(-7.27)#1,154 |
Common Questions
What are the Top 10 Cities with the Lowest Poverty Level Among Families in Pennsylvania?
Top 10 Cities with the Lowest Poverty Level Among Families in Pennsylvania are:
#1
0.19%
#2
0.24%
#3
0.42%
#4
0.47%
#5
0.50%
#6
0.56%
#7
0.68%
#8
0.70%
#9
0.75%
#10
0.77%
What city has the Lowest Poverty Level Among Families in Pennsylvania?
Skyline View has the Lowest Poverty Level Among Families in Pennsylvania with 0.19%.
What is the Poverty Level Among Families in the State of Pennsylvania?
Poverty Level Among Families in Pennsylvania is 8.0%.
What is the Poverty Level Among Families in the United States?
Poverty Level Among Families in the United States is 8.8%.