Cities with the Lowest Poverty Level Among Families in Indiana
RELATED REPORTS & OPTIONS
Lowest Family Poverty
Indiana
Compare Cities
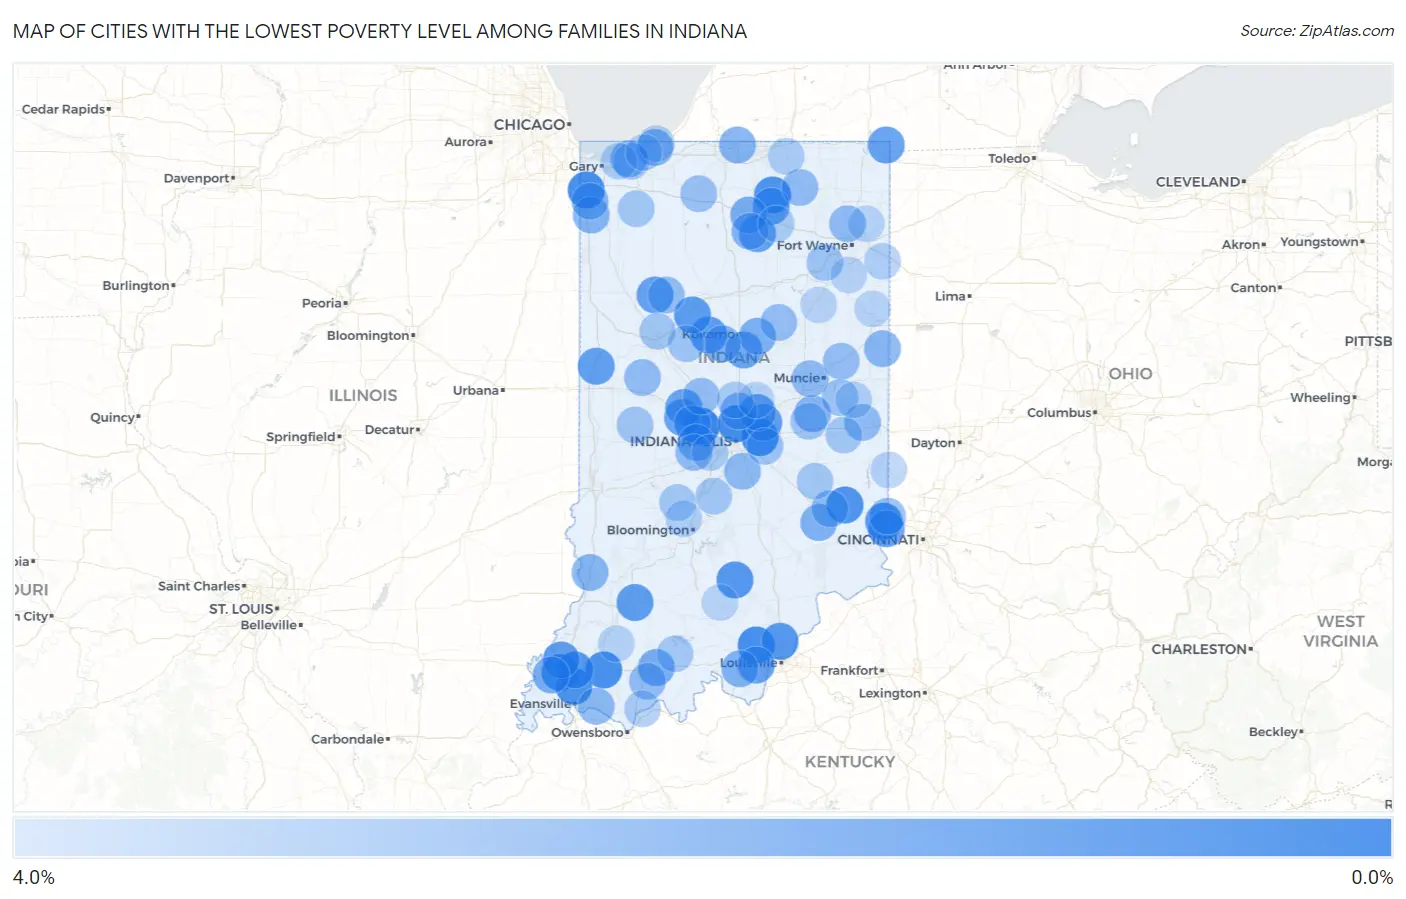
Map of Cities with the Lowest Poverty Level Among Families in Indiana
4.0%
0.0%
Cities with the Lowest Poverty Level Among Families in Indiana
| City | Family Poverty | vs State | vs National | |
| 1. | Pittsboro | 0.082% | 8.5%(-8.40)#1 | 8.8%(-8.70)#2 |
| 2. | Cumberland | 0.46% | 8.5%(-8.02)#2 | 8.8%(-8.32)#66 |
| 3. | St John | 0.47% | 8.5%(-8.01)#3 | 8.8%(-8.31)#72 |
| 4. | Greenville | 0.49% | 8.5%(-7.99)#4 | 8.8%(-8.29)#80 |
| 5. | Meridian Hills | 0.56% | 8.5%(-7.92)#5 | 8.8%(-8.22)#124 |
| 6. | Cynthiana | 0.58% | 8.5%(-7.90)#6 | 8.8%(-8.20)#142 |
| 7. | Lynnville | 0.62% | 8.5%(-7.86)#7 | 8.8%(-8.16)#169 |
| 8. | Bright | 0.70% | 8.5%(-7.78)#8 | 8.8%(-8.08)#227 |
| 9. | Milford | 0.71% | 8.5%(-7.77)#9 | 8.8%(-8.07)#240 |
| 10. | Darmstadt | 0.72% | 8.5%(-7.76)#10 | 8.8%(-8.06)#245 |
| 11. | Oldenburg | 0.80% | 8.5%(-7.68)#11 | 8.8%(-7.98)#316 |
| 12. | Haubstadt | 0.89% | 8.5%(-7.58)#12 | 8.8%(-7.89)#421 |
| 13. | Medora | 0.98% | 8.5%(-7.50)#13 | 8.8%(-7.81)#505 |
| 14. | Sellersburg | 1.1% | 8.5%(-7.41)#14 | 8.8%(-7.72)#607 |
| 15. | Burlington | 1.2% | 8.5%(-7.32)#15 | 8.8%(-7.62)#714 |
| 16. | Camden | 1.2% | 8.5%(-7.27)#16 | 8.8%(-7.58)#765 |
| 17. | Montgomery | 1.2% | 8.5%(-7.26)#17 | 8.8%(-7.56)#787 |
| 18. | Mccordsville | 1.2% | 8.5%(-7.26)#18 | 8.8%(-7.56)#793 |
| 19. | Owensville | 1.3% | 8.5%(-7.17)#19 | 8.8%(-7.47)#890 |
| 20. | West Lebanon | 1.4% | 8.5%(-7.09)#20 | 8.8%(-7.39)#986 |
| 21. | Clear Lake | 1.4% | 8.5%(-7.06)#21 | 8.8%(-7.36)#1,033 |
| 22. | Lanesville | 1.4% | 8.5%(-7.05)#22 | 8.8%(-7.35)#1,045 |
| 23. | Leesburg | 1.4% | 8.5%(-7.03)#23 | 8.8%(-7.33)#1,071 |
| 24. | Reynolds | 1.4% | 8.5%(-7.03)#24 | 8.8%(-7.33)#1,074 |
| 25. | Jamestown | 1.5% | 8.5%(-7.01)#25 | 8.8%(-7.32)#1,095 |
| 26. | Hidden Valley | 1.5% | 8.5%(-6.99)#26 | 8.8%(-7.29)#1,139 |
| 27. | Burket | 1.5% | 8.5%(-6.96)#27 | 8.8%(-7.27)#1,175 |
| 28. | Fishers | 1.5% | 8.5%(-6.95)#28 | 8.8%(-7.25)#1,191 |
| 29. | Advance | 1.6% | 8.5%(-6.88)#29 | 8.8%(-7.18)#1,292 |
| 30. | Lizton | 1.6% | 8.5%(-6.85)#30 | 8.8%(-7.15)#1,336 |
| 31. | Sharpsville | 1.7% | 8.5%(-6.82)#31 | 8.8%(-7.12)#1,366 |
| 32. | Ferdinand | 2.0% | 8.5%(-6.44)#32 | 8.8%(-6.74)#1,942 |
| 33. | Etna Green | 2.0% | 8.5%(-6.44)#33 | 8.8%(-6.74)#1,948 |
| 34. | Poseyville | 2.1% | 8.5%(-6.36)#34 | 8.8%(-6.66)#2,061 |
| 35. | Greentown | 2.1% | 8.5%(-6.33)#35 | 8.8%(-6.63)#2,101 |
| 36. | Paxton | 2.2% | 8.5%(-6.26)#36 | 8.8%(-6.56)#2,217 |
| 37. | Millhousen | 2.3% | 8.5%(-6.21)#37 | 8.8%(-6.51)#2,310 |
| 38. | Corydon | 2.3% | 8.5%(-6.16)#38 | 8.8%(-6.46)#2,376 |
| 39. | Cadiz | 2.3% | 8.5%(-6.15)#39 | 8.8%(-6.46)#2,398 |
| 40. | Carmel | 2.3% | 8.5%(-6.14)#40 | 8.8%(-6.44)#2,410 |
| 41. | Russiaville | 2.4% | 8.5%(-6.12)#41 | 8.8%(-6.42)#2,445 |
| 42. | Pottawattamie Park | 2.4% | 8.5%(-6.10)#42 | 8.8%(-6.40)#2,476 |
| 43. | Danville | 2.4% | 8.5%(-6.08)#43 | 8.8%(-6.38)#2,503 |
| 44. | Mentone | 2.4% | 8.5%(-6.08)#44 | 8.8%(-6.38)#2,513 |
| 45. | Granger | 2.4% | 8.5%(-6.07)#45 | 8.8%(-6.37)#2,524 |
| 46. | Lowell | 2.4% | 8.5%(-6.04)#46 | 8.8%(-6.34)#2,588 |
| 47. | Oaktown | 2.5% | 8.5%(-6.00)#47 | 8.8%(-6.31)#2,636 |
| 48. | Cedar Lake | 2.5% | 8.5%(-6.00)#48 | 8.8%(-6.30)#2,643 |
| 49. | Dune Acres | 2.6% | 8.5%(-5.91)#49 | 8.8%(-6.22)#2,787 |
| 50. | Salamonia | 2.6% | 8.5%(-5.91)#50 | 8.8%(-6.22)#2,793 |
| 51. | Newburgh | 2.6% | 8.5%(-5.85)#51 | 8.8%(-6.16)#2,884 |
| 52. | New Point | 2.6% | 8.5%(-5.85)#52 | 8.8%(-6.15)#2,898 |
| 53. | New Whiteland | 2.7% | 8.5%(-5.78)#53 | 8.8%(-6.08)#3,020 |
| 54. | Yorktown | 2.8% | 8.5%(-5.72)#54 | 8.8%(-6.03)#3,122 |
| 55. | Huntertown | 2.8% | 8.5%(-5.71)#55 | 8.8%(-6.02)#3,134 |
| 56. | Santa Claus | 2.8% | 8.5%(-5.67)#56 | 8.8%(-5.97)#3,217 |
| 57. | Clayton | 2.8% | 8.5%(-5.67)#57 | 8.8%(-5.97)#3,220 |
| 58. | Greens Fork | 2.8% | 8.5%(-5.66)#58 | 8.8%(-5.96)#3,235 |
| 59. | New Richmond | 2.8% | 8.5%(-5.65)#59 | 8.8%(-5.95)#3,264 |
| 60. | Ligonier | 2.8% | 8.5%(-5.64)#60 | 8.8%(-5.94)#3,271 |
| 61. | Monticello | 2.9% | 8.5%(-5.57)#61 | 8.8%(-5.88)#3,390 |
| 62. | Albany | 2.9% | 8.5%(-5.55)#62 | 8.8%(-5.85)#3,432 |
| 63. | West Harrison | 2.9% | 8.5%(-5.54)#63 | 8.8%(-5.84)#3,456 |
| 64. | Ulen | 2.9% | 8.5%(-5.54)#64 | 8.8%(-5.84)#3,465 |
| 65. | Sweetser | 3.0% | 8.5%(-5.52)#65 | 8.8%(-5.82)#3,488 |
| 66. | Koontz Lake | 3.1% | 8.5%(-5.40)#66 | 8.8%(-5.70)#3,671 |
| 67. | Rossville | 3.2% | 8.5%(-5.30)#67 | 8.8%(-5.60)#3,852 |
| 68. | Roanoke | 3.2% | 8.5%(-5.29)#68 | 8.8%(-5.59)#3,866 |
| 69. | Blountsville | 3.2% | 8.5%(-5.25)#69 | 8.8%(-5.56)#3,928 |
| 70. | Kennard | 3.3% | 8.5%(-5.23)#70 | 8.8%(-5.53)#3,964 |
| 71. | Waveland | 3.3% | 8.5%(-5.22)#71 | 8.8%(-5.52)#3,983 |
| 72. | New Palestine | 3.3% | 8.5%(-5.21)#72 | 8.8%(-5.51)#3,995 |
| 73. | Palestine | 3.3% | 8.5%(-5.16)#73 | 8.8%(-5.46)#4,074 |
| 74. | Painted Hills | 3.3% | 8.5%(-5.15)#74 | 8.8%(-5.46)#4,088 |
| 75. | Battle Ground | 3.4% | 8.5%(-5.10)#75 | 8.8%(-5.41)#4,180 |
| 76. | Dublin | 3.4% | 8.5%(-5.10)#76 | 8.8%(-5.40)#4,191 |
| 77. | Gosport | 3.4% | 8.5%(-5.08)#77 | 8.8%(-5.38)#4,218 |
| 78. | Porter | 3.4% | 8.5%(-5.07)#78 | 8.8%(-5.37)#4,231 |
| 79. | Kouts | 3.4% | 8.5%(-5.06)#79 | 8.8%(-5.37)#4,244 |
| 80. | Milroy | 3.4% | 8.5%(-5.06)#80 | 8.8%(-5.36)#4,250 |
| 81. | Birdseye | 3.5% | 8.5%(-4.99)#81 | 8.8%(-5.29)#4,361 |
| 82. | Grandview | 3.6% | 8.5%(-4.91)#82 | 8.8%(-5.21)#4,484 |
| 83. | Plainfield | 3.6% | 8.5%(-4.90)#83 | 8.8%(-5.20)#4,514 |
| 84. | Westfield | 3.6% | 8.5%(-4.88)#84 | 8.8%(-5.18)#4,547 |
| 85. | Middlebury | 3.6% | 8.5%(-4.84)#85 | 8.8%(-5.14)#4,626 |
| 86. | Winona Lake | 3.7% | 8.5%(-4.81)#86 | 8.8%(-5.11)#4,663 |
| 87. | Long Beach | 3.7% | 8.5%(-4.79)#87 | 8.8%(-5.10)#4,682 |
| 88. | Ogden Dunes | 3.7% | 8.5%(-4.77)#88 | 8.8%(-5.08)#4,705 |
| 89. | Modoc | 3.7% | 8.5%(-4.77)#89 | 8.8%(-5.08)#4,724 |
| 90. | Monroeville | 3.7% | 8.5%(-4.75)#90 | 8.8%(-5.05)#4,773 |
| 91. | Ellettsville | 3.8% | 8.5%(-4.72)#91 | 8.8%(-5.03)#4,810 |
| 92. | Beverly Shores | 3.8% | 8.5%(-4.72)#92 | 8.8%(-5.03)#4,812 |
| 93. | West College Corner | 3.8% | 8.5%(-4.63)#93 | 8.8%(-4.94)#4,945 |
| 94. | Leo Cedarville | 3.9% | 8.5%(-4.60)#94 | 8.8%(-4.90)#4,999 |
| 95. | Winslow | 3.9% | 8.5%(-4.57)#95 | 8.8%(-4.87)#5,037 |
| 96. | Ossian | 3.9% | 8.5%(-4.53)#96 | 8.8%(-4.84)#5,094 |
| 97. | Saltillo | 3.9% | 8.5%(-4.53)#97 | 8.8%(-4.83)#5,103 |
| 98. | Berne | 4.0% | 8.5%(-4.52)#98 | 8.8%(-4.83)#5,110 |
| 99. | Noblesville | 4.0% | 8.5%(-4.52)#99 | 8.8%(-4.82)#5,130 |
| 100. | Warren | 4.0% | 8.5%(-4.50)#100 | 8.8%(-4.80)#5,148 |
Common Questions
What are the Top 10 Cities with the Lowest Poverty Level Among Families in Indiana?
Top 10 Cities with the Lowest Poverty Level Among Families in Indiana are:
#1
0.082%
#2
0.46%
#3
0.47%
#4
0.49%
#5
0.56%
#6
0.58%
#7
0.62%
#8
0.70%
#9
0.71%
#10
0.72%
What city has the Lowest Poverty Level Among Families in Indiana?
Pittsboro has the Lowest Poverty Level Among Families in Indiana with 0.082%.
What is the Poverty Level Among Families in the State of Indiana?
Poverty Level Among Families in Indiana is 8.5%.
What is the Poverty Level Among Families in the United States?
Poverty Level Among Families in the United States is 8.8%.