Cities with the Lowest Poverty Level Among Families in Oregon
RELATED REPORTS & OPTIONS
Lowest Family Poverty
Oregon
Compare Cities
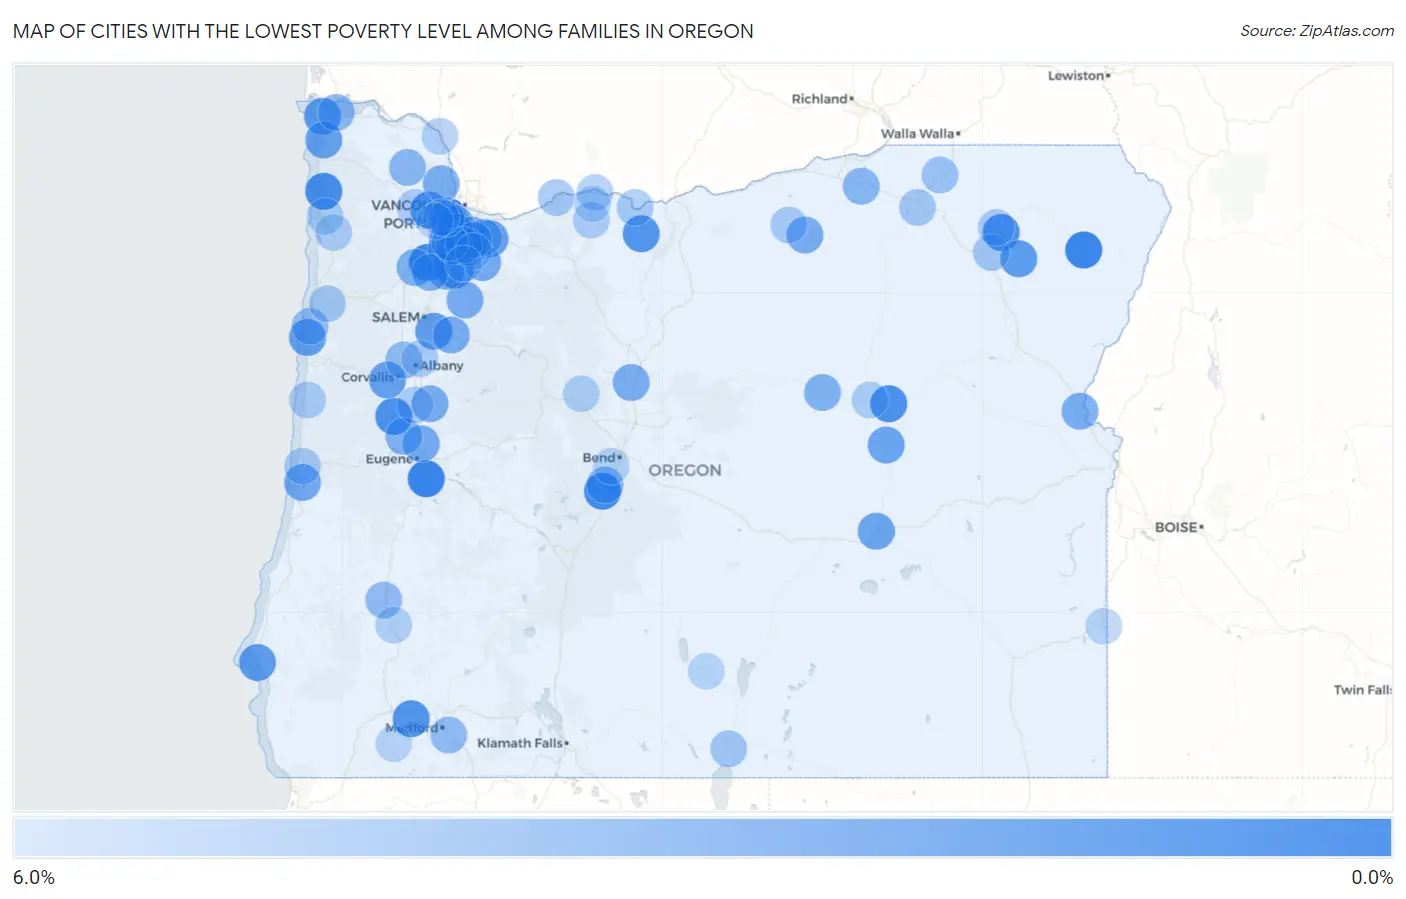
Map of Cities with the Lowest Poverty Level Among Families in Oregon
6.0%
0.0%
Cities with the Lowest Poverty Level Among Families in Oregon
| City | Family Poverty | vs State | vs National | |
| 1. | Creswell | 0.25% | 7.3%(-7.01)#1 | 8.8%(-8.53)#14 |
| 2. | Joseph | 0.33% | 7.3%(-6.93)#2 | 8.8%(-8.45)#32 |
| 3. | Dundee | 0.52% | 7.3%(-6.74)#3 | 8.8%(-8.26)#102 |
| 4. | Dunthorpe | 0.57% | 7.3%(-6.69)#4 | 8.8%(-8.21)#137 |
| 5. | Three Rivers | 0.65% | 7.3%(-6.61)#5 | 8.8%(-8.13)#187 |
| 6. | Bayside Gardens | 0.82% | 7.3%(-6.44)#6 | 8.8%(-7.96)#346 |
| 7. | Canyon City | 0.91% | 7.3%(-6.35)#7 | 8.8%(-7.87)#441 |
| 8. | Monroe | 0.99% | 7.3%(-6.27)#8 | 8.8%(-7.79)#523 |
| 9. | Imbler | 1.0% | 7.3%(-6.22)#9 | 8.8%(-7.74)#578 |
| 10. | Aurora | 1.1% | 7.3%(-6.20)#10 | 8.8%(-7.72)#603 |
| 11. | Foots Creek | 1.1% | 7.3%(-6.14)#11 | 8.8%(-7.66)#663 |
| 12. | Dufur | 1.3% | 7.3%(-5.93)#12 | 8.8%(-7.45)#923 |
| 13. | North Plains | 1.5% | 7.3%(-5.81)#13 | 8.8%(-7.33)#1,079 |
| 14. | Warrenton | 1.6% | 7.3%(-5.66)#14 | 8.8%(-7.18)#1,289 |
| 15. | Port Orford | 1.7% | 7.3%(-5.54)#15 | 8.8%(-7.06)#1,460 |
| 16. | Cove | 1.7% | 7.3%(-5.54)#16 | 8.8%(-7.06)#1,477 |
| 17. | Turner | 1.8% | 7.3%(-5.46)#17 | 8.8%(-6.98)#1,589 |
| 18. | Depoe Bay | 1.8% | 7.3%(-5.43)#18 | 8.8%(-6.95)#1,631 |
| 19. | Damascus | 1.8% | 7.3%(-5.42)#19 | 8.8%(-6.94)#1,647 |
| 20. | Cedar Hills | 1.9% | 7.3%(-5.33)#20 | 8.8%(-6.85)#1,795 |
| 21. | Gearhart | 2.0% | 7.3%(-5.24)#21 | 8.8%(-6.76)#1,920 |
| 22. | Philomath | 2.1% | 7.3%(-5.21)#22 | 8.8%(-6.73)#1,961 |
| 23. | Raleigh Hills | 2.1% | 7.3%(-5.13)#23 | 8.8%(-6.65)#2,080 |
| 24. | Burns | 2.2% | 7.3%(-5.10)#24 | 8.8%(-6.62)#2,127 |
| 25. | Seneca | 2.2% | 7.3%(-5.04)#25 | 8.8%(-6.56)#2,225 |
| 26. | Bull Mountain | 2.3% | 7.3%(-4.94)#26 | 8.8%(-6.47)#2,370 |
| 27. | Rivergrove | 2.3% | 7.3%(-4.94)#27 | 8.8%(-6.46)#2,391 |
| 28. | Dunes City | 2.4% | 7.3%(-4.86)#28 | 8.8%(-6.38)#2,512 |
| 29. | Bethany | 2.5% | 7.3%(-4.77)#29 | 8.8%(-6.29)#2,669 |
| 30. | Lake Oswego | 2.5% | 7.3%(-4.74)#30 | 8.8%(-6.26)#2,722 |
| 31. | West Haven Sylvan | 2.6% | 7.3%(-4.71)#31 | 8.8%(-6.23)#2,760 |
| 32. | Coburg | 2.6% | 7.3%(-4.70)#32 | 8.8%(-6.22)#2,776 |
| 33. | Beavercreek | 2.6% | 7.3%(-4.64)#33 | 8.8%(-6.16)#2,875 |
| 34. | Scotts Mills | 2.7% | 7.3%(-4.61)#34 | 8.8%(-6.13)#2,949 |
| 35. | Sublimity | 2.7% | 7.3%(-4.61)#35 | 8.8%(-6.13)#2,951 |
| 36. | Sherwood | 2.7% | 7.3%(-4.60)#36 | 8.8%(-6.12)#2,961 |
| 37. | Donald | 2.7% | 7.3%(-4.57)#37 | 8.8%(-6.09)#3,014 |
| 38. | Huntington | 2.7% | 7.3%(-4.56)#38 | 8.8%(-6.08)#3,027 |
| 39. | Lexington | 2.7% | 7.3%(-4.56)#39 | 8.8%(-6.08)#3,034 |
| 40. | Brownsville | 2.7% | 7.3%(-4.53)#40 | 8.8%(-6.05)#3,078 |
| 41. | Culver | 2.8% | 7.3%(-4.51)#41 | 8.8%(-6.03)#3,119 |
| 42. | Scappoose | 2.8% | 7.3%(-4.48)#42 | 8.8%(-6.00)#3,152 |
| 43. | Mckay | 2.8% | 7.3%(-4.48)#43 | 8.8%(-6.00)#3,169 |
| 44. | Milwaukie | 2.8% | 7.3%(-4.47)#44 | 8.8%(-5.99)#3,184 |
| 45. | Running Y Ranch | 2.9% | 7.3%(-4.39)#45 | 8.8%(-5.91)#3,338 |
| 46. | Lafayette | 2.9% | 7.3%(-4.33)#46 | 8.8%(-5.85)#3,427 |
| 47. | St Paul | 2.9% | 7.3%(-4.32)#47 | 8.8%(-5.84)#3,454 |
| 48. | Dayville | 3.0% | 7.3%(-4.28)#48 | 8.8%(-5.80)#3,535 |
| 49. | Junction City | 3.0% | 7.3%(-4.27)#49 | 8.8%(-5.79)#3,549 |
| 50. | Sunriver | 3.2% | 7.3%(-4.09)#50 | 8.8%(-5.61)#3,832 |
| 51. | West Linn | 3.3% | 7.3%(-4.00)#51 | 8.8%(-5.52)#3,977 |
| 52. | Vernonia | 3.3% | 7.3%(-3.98)#52 | 8.8%(-5.50)#4,021 |
| 53. | Prineville Lake Acres | 3.3% | 7.3%(-3.94)#53 | 8.8%(-5.46)#4,081 |
| 54. | Astoria | 3.3% | 7.3%(-3.94)#54 | 8.8%(-5.46)#4,083 |
| 55. | Happy Valley | 3.3% | 7.3%(-3.93)#55 | 8.8%(-5.45)#4,096 |
| 56. | Echo | 3.4% | 7.3%(-3.91)#56 | 8.8%(-5.43)#4,155 |
| 57. | Juniper Canyon | 3.4% | 7.3%(-3.84)#57 | 8.8%(-5.36)#4,259 |
| 58. | Adair Village | 3.6% | 7.3%(-3.68)#58 | 8.8%(-5.20)#4,526 |
| 59. | Garden Home Whitford | 3.6% | 7.3%(-3.65)#59 | 8.8%(-5.17)#4,561 |
| 60. | Tualatin | 3.6% | 7.3%(-3.63)#60 | 8.8%(-5.15)#4,601 |
| 61. | Phoenix | 3.6% | 7.3%(-3.62)#61 | 8.8%(-5.14)#4,630 |
| 62. | Green | 3.7% | 7.3%(-3.61)#62 | 8.8%(-5.13)#4,641 |
| 63. | Lincoln Beach | 3.7% | 7.3%(-3.54)#63 | 8.8%(-5.06)#4,759 |
| 64. | Athena | 4.0% | 7.3%(-3.25)#64 | 8.8%(-4.77)#5,209 |
| 65. | Oatfield | 4.0% | 7.3%(-3.23)#65 | 8.8%(-4.75)#5,236 |
| 66. | Lakeview | 4.2% | 7.3%(-3.08)#66 | 8.8%(-4.60)#5,473 |
| 67. | Island City | 4.3% | 7.3%(-2.98)#67 | 8.8%(-4.50)#5,637 |
| 68. | Stafford | 4.3% | 7.3%(-2.96)#68 | 8.8%(-4.48)#5,657 |
| 69. | Cascade Locks | 4.3% | 7.3%(-2.96)#69 | 8.8%(-4.48)#5,674 |
| 70. | Tutuilla | 4.3% | 7.3%(-2.91)#70 | 8.8%(-4.43)#5,746 |
| 71. | Rose Lodge | 4.4% | 7.3%(-2.87)#71 | 8.8%(-4.39)#5,813 |
| 72. | Ione | 4.5% | 7.3%(-2.80)#72 | 8.8%(-4.32)#5,916 |
| 73. | The Dalles | 4.5% | 7.3%(-2.79)#73 | 8.8%(-4.31)#5,930 |
| 74. | Florence | 4.5% | 7.3%(-2.77)#74 | 8.8%(-4.29)#5,963 |
| 75. | King City | 4.5% | 7.3%(-2.76)#75 | 8.8%(-4.28)#5,979 |
| 76. | Summerville | 4.5% | 7.3%(-2.72)#76 | 8.8%(-4.24)#6,051 |
| 77. | Millersburg | 4.6% | 7.3%(-2.68)#77 | 8.8%(-4.20)#6,112 |
| 78. | Waldport | 4.6% | 7.3%(-2.67)#78 | 8.8%(-4.19)#6,125 |
| 79. | Banks | 4.6% | 7.3%(-2.65)#79 | 8.8%(-4.17)#6,152 |
| 80. | Halsey | 4.6% | 7.3%(-2.65)#80 | 8.8%(-4.17)#6,154 |
| 81. | Oak Hills | 4.6% | 7.3%(-2.63)#81 | 8.8%(-4.15)#6,178 |
| 82. | Mount Hood | 4.6% | 7.3%(-2.63)#82 | 8.8%(-4.15)#6,189 |
| 83. | Garibaldi | 4.7% | 7.3%(-2.60)#83 | 8.8%(-4.12)#6,248 |
| 84. | Tillamook | 4.7% | 7.3%(-2.58)#84 | 8.8%(-4.10)#6,270 |
| 85. | Rockcreek | 4.7% | 7.3%(-2.58)#85 | 8.8%(-4.10)#6,274 |
| 86. | Mount Vernon | 4.7% | 7.3%(-2.57)#86 | 8.8%(-4.09)#6,279 |
| 87. | Hood River | 4.7% | 7.3%(-2.56)#87 | 8.8%(-4.08)#6,301 |
| 88. | Knappa | 4.7% | 7.3%(-2.56)#88 | 8.8%(-4.08)#6,308 |
| 89. | Falcon Heights | 4.7% | 7.3%(-2.56)#89 | 8.8%(-4.08)#6,309 |
| 90. | Tri City | 4.8% | 7.3%(-2.51)#90 | 8.8%(-4.03)#6,351 |
| 91. | Camp Sherman | 4.8% | 7.3%(-2.50)#91 | 8.8%(-4.02)#6,376 |
| 92. | Prescott | 4.8% | 7.3%(-2.50)#92 | 8.8%(-4.02)#6,400 |
| 93. | Paisley | 5.0% | 7.3%(-2.26)#93 | 8.8%(-3.78)#6,758 |
| 94. | Jordan Valley | 5.0% | 7.3%(-2.26)#94 | 8.8%(-3.78)#6,766 |
| 95. | Hillsboro | 5.0% | 7.3%(-2.26)#95 | 8.8%(-3.78)#6,783 |
| 96. | Odell | 5.0% | 7.3%(-2.23)#96 | 8.8%(-3.75)#6,827 |
| 97. | Seventh Mountain | 5.1% | 7.3%(-2.21)#97 | 8.8%(-3.73)#6,855 |
| 98. | Oregon City | 5.1% | 7.3%(-2.17)#98 | 8.8%(-3.69)#6,910 |
| 99. | Williams | 5.1% | 7.3%(-2.17)#99 | 8.8%(-3.69)#6,911 |
| 100. | Canby | 5.1% | 7.3%(-2.16)#100 | 8.8%(-3.68)#6,923 |
Common Questions
What are the Top 10 Cities with the Lowest Poverty Level Among Families in Oregon?
Top 10 Cities with the Lowest Poverty Level Among Families in Oregon are:
#1
0.25%
#2
0.33%
#3
0.52%
#4
0.65%
#5
0.82%
#6
0.91%
#7
0.99%
#8
1.0%
#9
1.1%
#10
1.1%
What city has the Lowest Poverty Level Among Families in Oregon?
Creswell has the Lowest Poverty Level Among Families in Oregon with 0.25%.
What is the Poverty Level Among Families in the State of Oregon?
Poverty Level Among Families in Oregon is 7.3%.
What is the Poverty Level Among Families in the United States?
Poverty Level Among Families in the United States is 8.8%.