Rio del Mar, CA Map & Demographics
Rio del Mar Map
Rio del Mar Overview
$83,444
PER CAPITA INCOME
$183,574
AVG FAMILY INCOME
$145,938
AVG HOUSEHOLD INCOME
50.9%
WAGE / INCOME GAP [ % ]
49.1¢/ $1
WAGE / INCOME GAP [ $ ]
0.47
INEQUALITY / GINI INDEX
9,007
TOTAL POPULATION
4,423
MALE POPULATION
4,584
FEMALE POPULATION
96.49
MALES / 100 FEMALES
103.64
FEMALES / 100 MALES
50.2
MEDIAN AGE
2.9
AVG FAMILY SIZE
2.4
AVG HOUSEHOLD SIZE
4,868
LABOR FORCE [ PEOPLE ]
64.6%
PERCENT IN LABOR FORCE
4.6%
UNEMPLOYMENT RATE
Income in Rio del Mar
Income Overview in Rio del Mar
Per Capita Income in Rio del Mar is $83,444, while median incomes of families and households are $183,574 and $145,938 respectively.
| Characteristic | Number | Measure |
| Per Capita Income | 9,007 | $83,444 |
| Median Family Income | 2,528 | $183,574 |
| Mean Family Income | 2,528 | $224,679 |
| Median Household Income | 3,804 | $145,938 |
| Mean Household Income | 3,804 | $192,057 |
| Income Deficit | 2,528 | $0 |
| Wage / Income Gap (%) | 9,007 | 50.93% |
| Wage / Income Gap ($) | 9,007 | 49.07¢ per $1 |
| Gini / Inequality Index | 9,007 | 0.47 |
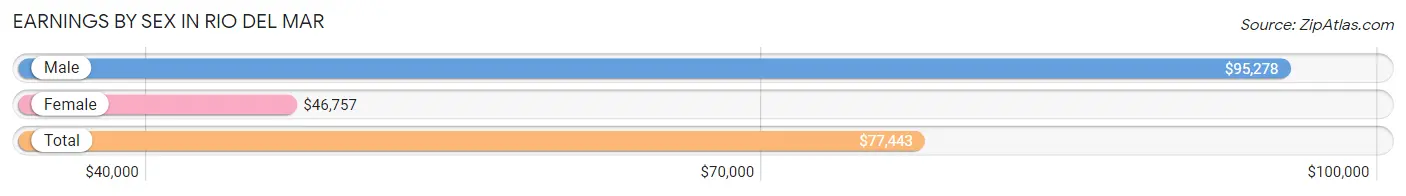
Earnings by Sex in Rio del Mar
Average Earnings in Rio del Mar are $77,443, $95,278 for men and $46,757 for women, a difference of 50.9%.
| Sex | Number | Average Earnings |
| Male | 2,794 (54.0%) | $95,278 |
| Female | 2,380 (46.0%) | $46,757 |
| Total | 5,174 (100.0%) | $77,443 |
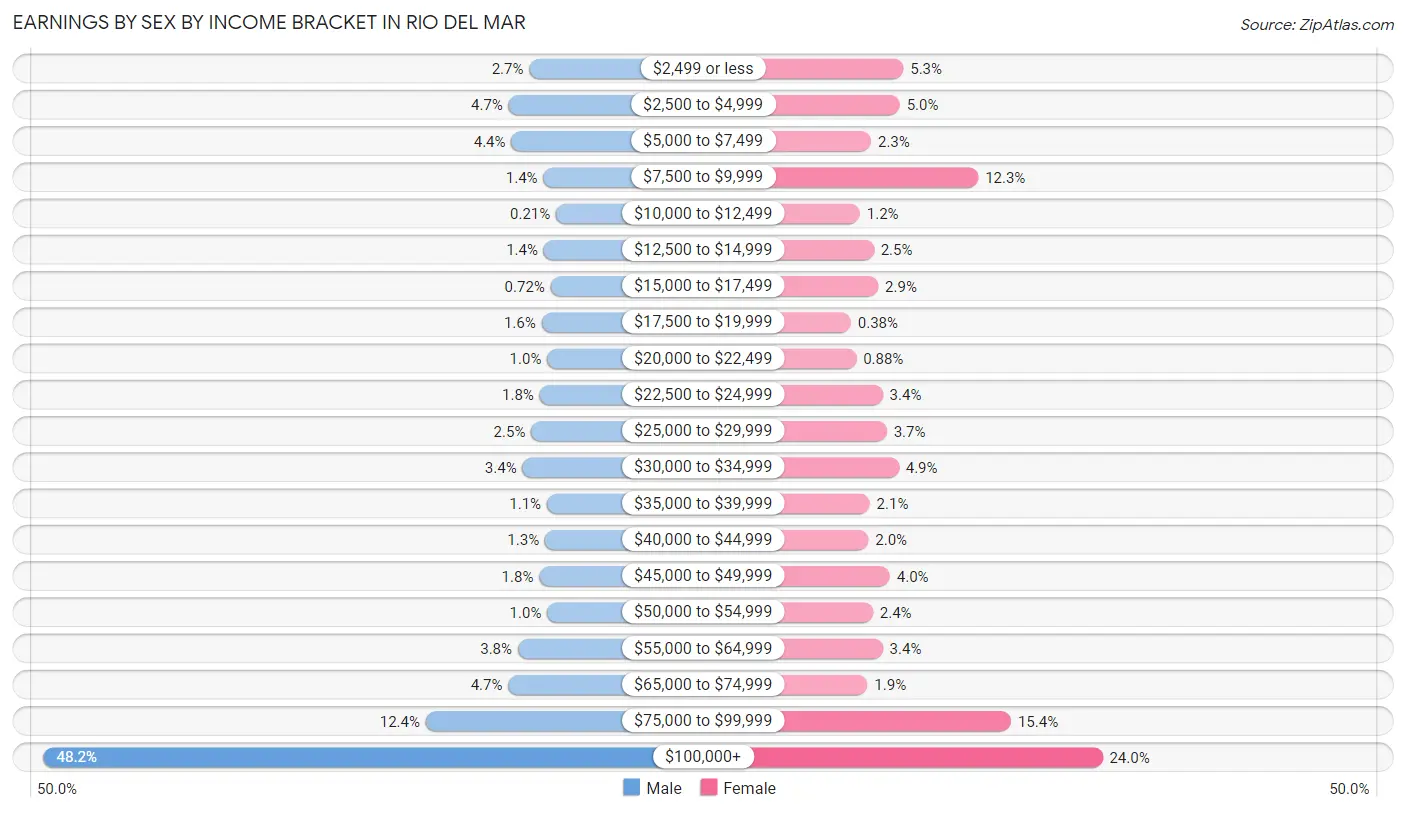
Earnings by Sex by Income Bracket in Rio del Mar
The most common earnings brackets in Rio del Mar are $100,000+ for men (1,347 | 48.2%) and $100,000+ for women (570 | 23.9%).
| Income | Male | Female |
| $2,499 or less | 76 (2.7%) | 126 (5.3%) |
| $2,500 to $4,999 | 130 (4.6%) | 118 (5.0%) |
| $5,000 to $7,499 | 123 (4.4%) | 54 (2.3%) |
| $7,500 to $9,999 | 39 (1.4%) | 293 (12.3%) |
| $10,000 to $12,499 | 6 (0.2%) | 29 (1.2%) |
| $12,500 to $14,999 | 38 (1.4%) | 60 (2.5%) |
| $15,000 to $17,499 | 20 (0.7%) | 70 (2.9%) |
| $17,500 to $19,999 | 44 (1.6%) | 9 (0.4%) |
| $20,000 to $22,499 | 29 (1.0%) | 21 (0.9%) |
| $22,500 to $24,999 | 49 (1.8%) | 80 (3.4%) |
| $25,000 to $29,999 | 71 (2.5%) | 89 (3.7%) |
| $30,000 to $34,999 | 94 (3.4%) | 116 (4.9%) |
| $35,000 to $39,999 | 30 (1.1%) | 51 (2.1%) |
| $40,000 to $44,999 | 35 (1.3%) | 48 (2.0%) |
| $45,000 to $49,999 | 50 (1.8%) | 96 (4.0%) |
| $50,000 to $54,999 | 29 (1.0%) | 58 (2.4%) |
| $55,000 to $64,999 | 106 (3.8%) | 80 (3.4%) |
| $65,000 to $74,999 | 131 (4.7%) | 46 (1.9%) |
| $75,000 to $99,999 | 347 (12.4%) | 366 (15.4%) |
| $100,000+ | 1,347 (48.2%) | 570 (23.9%) |
| Total | 2,794 (100.0%) | 2,380 (100.0%) |
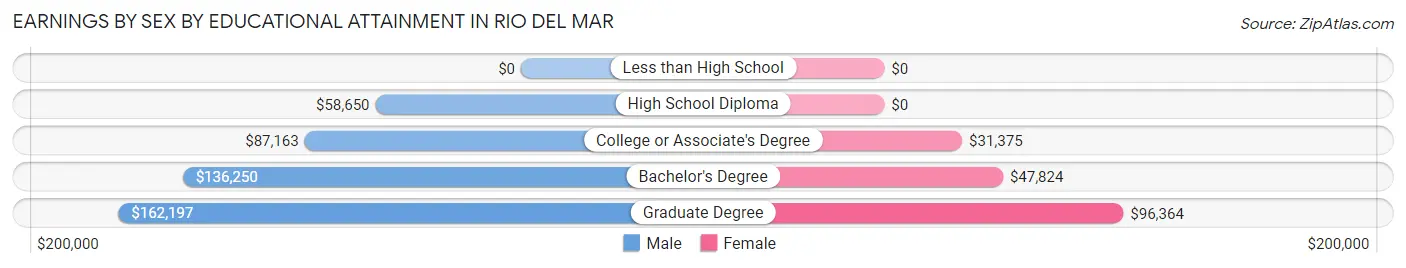
Earnings by Sex by Educational Attainment in Rio del Mar
Average earnings in Rio del Mar are $108,958 for men and $58,750 for women, a difference of 46.1%. Men with an educational attainment of graduate degree enjoy the highest average annual earnings of $162,197, while those with high school diploma education earn the least with $58,650. Women with an educational attainment of graduate degree earn the most with the average annual earnings of $96,364, while those with college or associate's degree education have the smallest earnings of $31,375.
| Educational Attainment | Male Income | Female Income |
| Less than High School | - | - |
| High School Diploma | $58,650 | $0 |
| College or Associate's Degree | $87,163 | $31,375 |
| Bachelor's Degree | $136,250 | $47,824 |
| Graduate Degree | $162,197 | $96,364 |
| Total | $108,958 | $58,750 |
Family Income in Rio del Mar
Family Income Brackets in Rio del Mar
According to the Rio del Mar family income data, there are 1,072 families falling into the $200,000+ income range, which is the most common income bracket and makes up 42.4% of all families. Conversely, the $10,000 to $14,999 income bracket is the least frequent group with only 8 families (0.3%) belonging to this category.
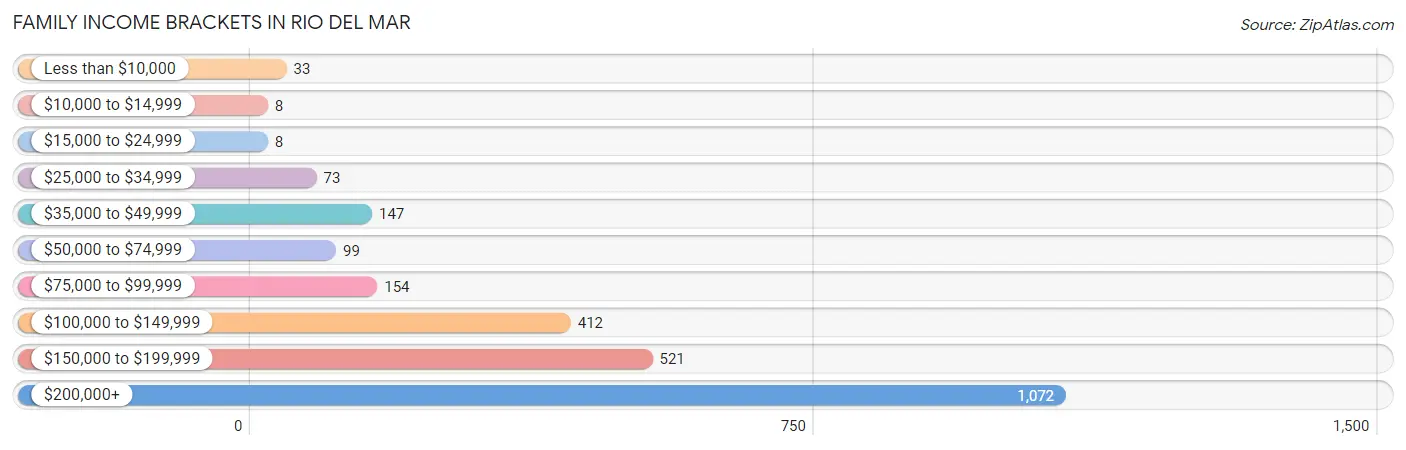
| Income Bracket | # Families | % Families |
| Less than $10,000 | 33 | 1.3% |
| $10,000 to $14,999 | 8 | 0.3% |
| $15,000 to $24,999 | 8 | 0.3% |
| $25,000 to $34,999 | 73 | 2.9% |
| $35,000 to $49,999 | 147 | 5.8% |
| $50,000 to $74,999 | 99 | 3.9% |
| $75,000 to $99,999 | 154 | 6.1% |
| $100,000 to $149,999 | 412 | 16.3% |
| $150,000 to $199,999 | 521 | 20.6% |
| $200,000+ | 1,072 | 42.4% |
Family Income by Famaliy Size in Rio del Mar
4-person families (384 | 15.2%) account for the highest median family income in Rio del Mar with $241,786 per family, while 2-person families (1,437 | 56.8%) have the highest median income of $83,052 per family member.
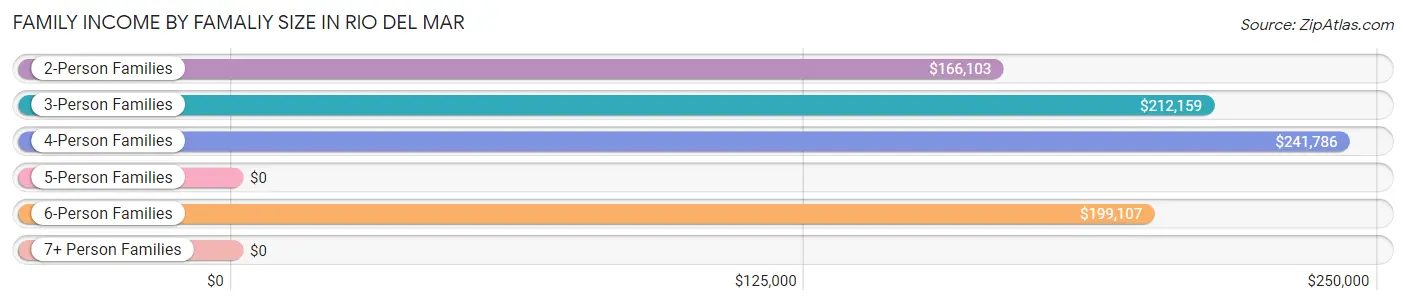
| Income Bracket | # Families | Median Income |
| 2-Person Families | 1,437 (56.8%) | $166,103 |
| 3-Person Families | 601 (23.8%) | $212,159 |
| 4-Person Families | 384 (15.2%) | $241,786 |
| 5-Person Families | 51 (2.0%) | $0 |
| 6-Person Families | 46 (1.8%) | $199,107 |
| 7+ Person Families | 9 (0.4%) | $0 |
| Total | 2,528 (100.0%) | $183,574 |
Family Income by Number of Earners in Rio del Mar
The median family income in Rio del Mar is $183,574, with families comprising 3+ earners (310) having the highest median family income of $223,125, while families with no earners (319) have the lowest median family income of $95,938, accounting for 12.3% and 12.6% of families, respectively.
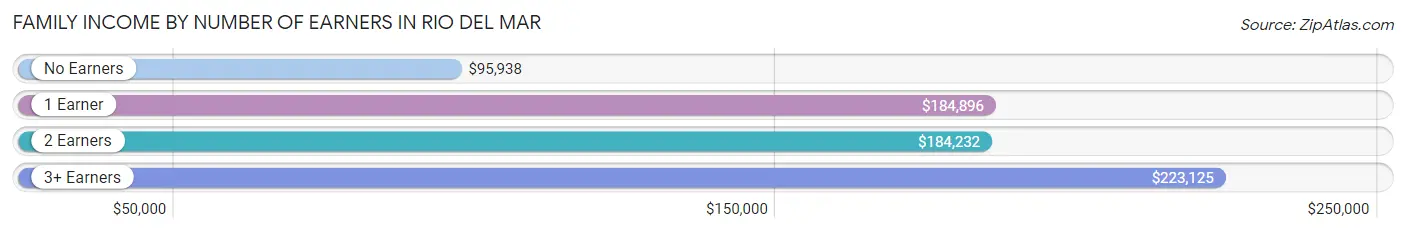
| Number of Earners | # Families | Median Income |
| No Earners | 319 (12.6%) | $95,938 |
| 1 Earner | 797 (31.5%) | $184,896 |
| 2 Earners | 1,102 (43.6%) | $184,232 |
| 3+ Earners | 310 (12.3%) | $223,125 |
| Total | 2,528 (100.0%) | $183,574 |
Household Income in Rio del Mar
Household Income Brackets in Rio del Mar
With 1,210 households falling in the category, the $200,000+ income range is the most frequent in Rio del Mar, accounting for 31.8% of all households. In contrast, only 65 households (1.7%) fall into the less than $10,000 income bracket, making it the least populous group.
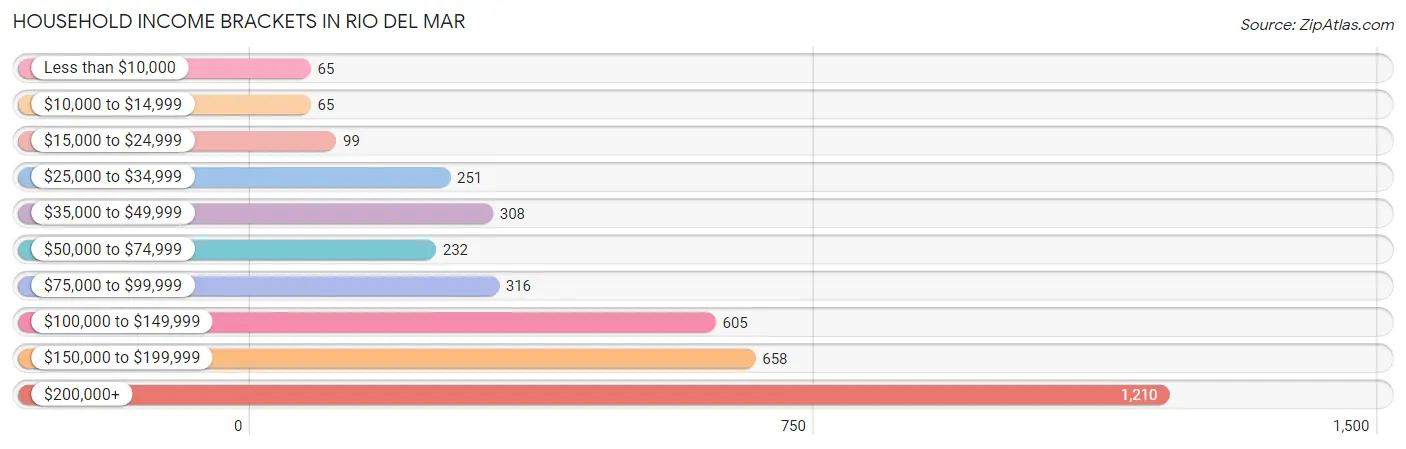
| Income Bracket | # Households | % Households |
| Less than $10,000 | 65 | 1.7% |
| $10,000 to $14,999 | 65 | 1.7% |
| $15,000 to $24,999 | 99 | 2.6% |
| $25,000 to $34,999 | 251 | 6.6% |
| $35,000 to $49,999 | 308 | 8.1% |
| $50,000 to $74,999 | 232 | 6.1% |
| $75,000 to $99,999 | 316 | 8.3% |
| $100,000 to $149,999 | 605 | 15.9% |
| $150,000 to $199,999 | 658 | 17.3% |
| $200,000+ | 1,210 | 31.8% |
Household Income by Householder Age in Rio del Mar
The median household income in Rio del Mar is $145,938, with the highest median household income of $183,485 found in the 45 to 64 years age bracket for the primary householder. A total of 1,758 households (46.2%) fall into this category. Meanwhile, the 15 to 24 years age bracket for the primary householder has the lowest median household income of $0, with 38 households (1.0%) in this group.
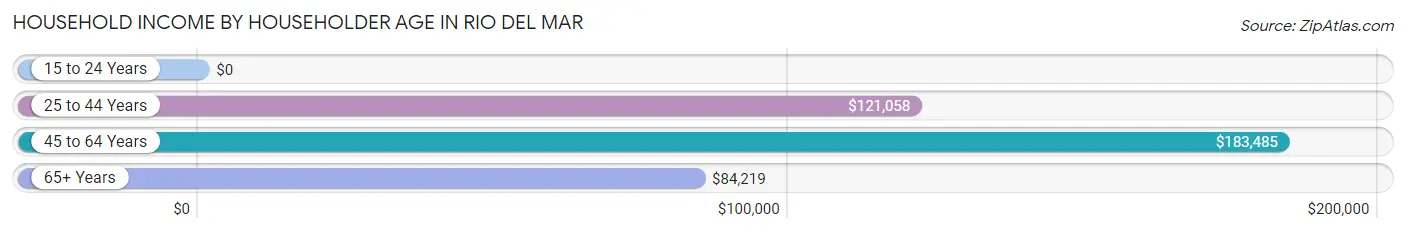
| Income Bracket | # Households | Median Income |
| 15 to 24 Years | 38 (1.0%) | $0 |
| 25 to 44 Years | 555 (14.6%) | $121,058 |
| 45 to 64 Years | 1,758 (46.2%) | $183,485 |
| 65+ Years | 1,453 (38.2%) | $84,219 |
| Total | 3,804 (100.0%) | $145,938 |
Poverty in Rio del Mar
Income Below Poverty by Sex and Age in Rio del Mar
With 2.5% poverty level for males and 4.1% for females among the residents of Rio del Mar, 18 to 24 year old males and 15 year old females are the most vulnerable to poverty, with 37 males (8.7%) and 18 females (40.0%) in their respective age groups living below the poverty level.
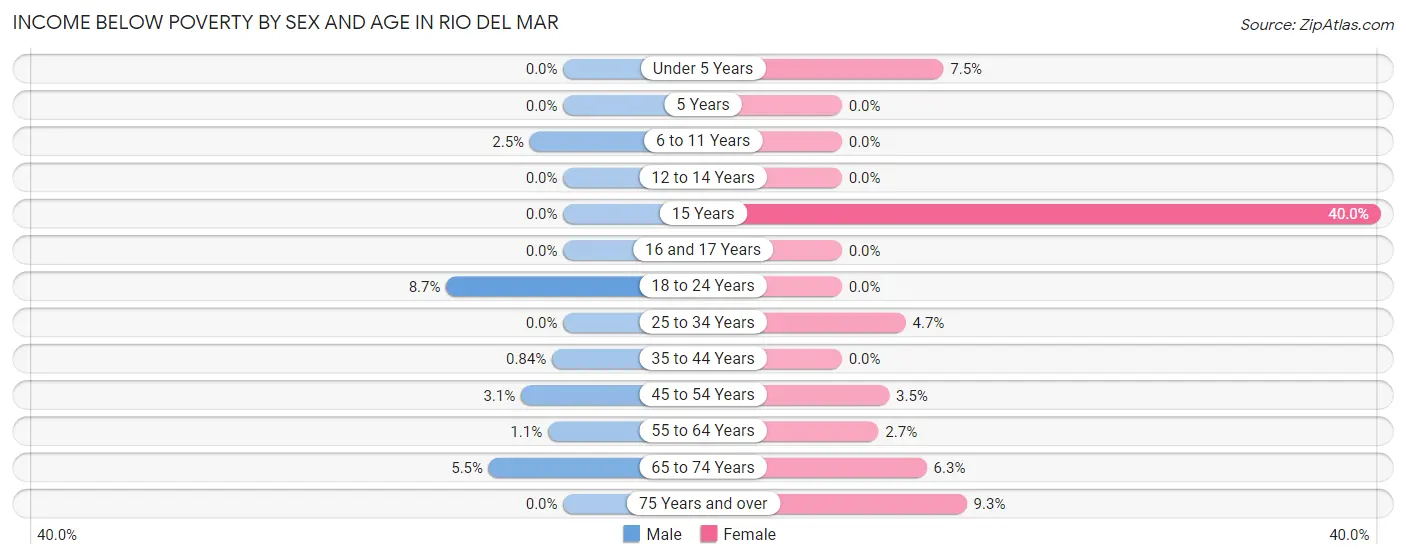
| Age Bracket | Male | Female |
| Under 5 Years | 0 (0.0%) | 15 (7.5%) |
| 5 Years | 0 (0.0%) | 0 (0.0%) |
| 6 to 11 Years | 9 (2.5%) | 0 (0.0%) |
| 12 to 14 Years | 0 (0.0%) | 0 (0.0%) |
| 15 Years | 0 (0.0%) | 18 (40.0%) |
| 16 and 17 Years | 0 (0.0%) | 0 (0.0%) |
| 18 to 24 Years | 37 (8.7%) | 0 (0.0%) |
| 25 to 34 Years | 0 (0.0%) | 10 (4.7%) |
| 35 to 44 Years | 4 (0.8%) | 0 (0.0%) |
| 45 to 54 Years | 22 (3.1%) | 27 (3.5%) |
| 55 to 64 Years | 11 (1.1%) | 20 (2.7%) |
| 65 to 74 Years | 26 (5.5%) | 43 (6.3%) |
| 75 Years and over | 0 (0.0%) | 52 (9.3%) |
| Total | 109 (2.5%) | 185 (4.1%) |
Income Above Poverty by Sex and Age in Rio del Mar
According to the poverty statistics in Rio del Mar, males aged under 5 years and females aged 5 years are the age groups that are most secure financially, with 100.0% of males and 100.0% of females in these age groups living above the poverty line.
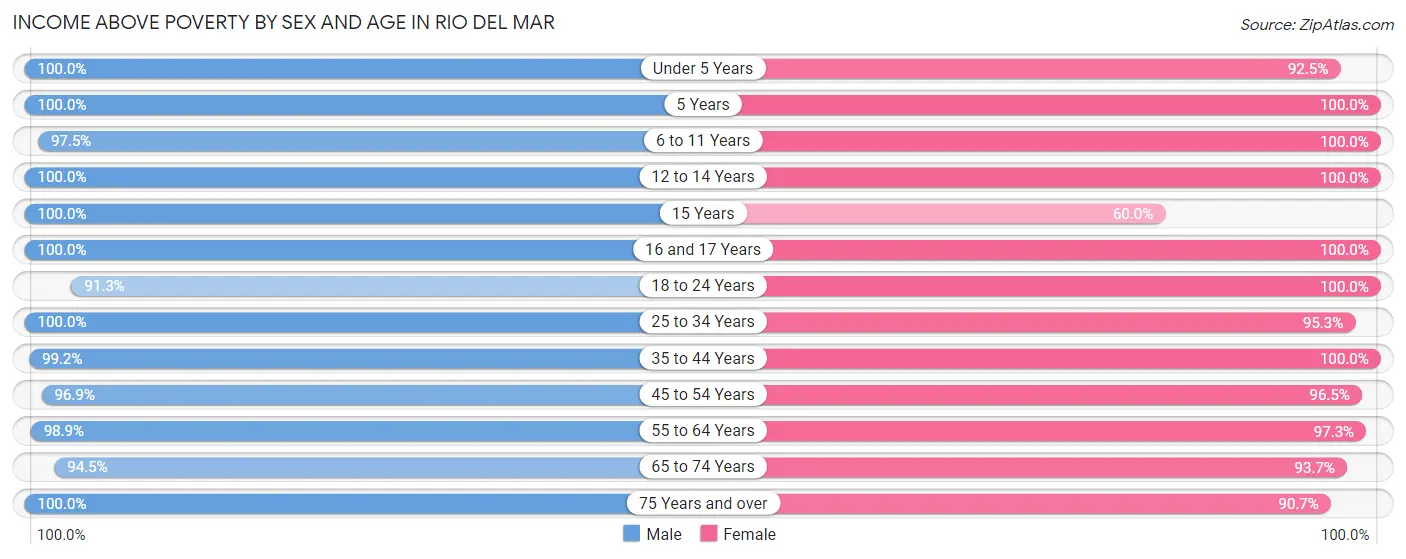
| Age Bracket | Male | Female |
| Under 5 Years | 71 (100.0%) | 184 (92.5%) |
| 5 Years | 18 (100.0%) | 43 (100.0%) |
| 6 to 11 Years | 354 (97.5%) | 253 (100.0%) |
| 12 to 14 Years | 224 (100.0%) | 115 (100.0%) |
| 15 Years | 41 (100.0%) | 27 (60.0%) |
| 16 and 17 Years | 66 (100.0%) | 99 (100.0%) |
| 18 to 24 Years | 389 (91.3%) | 321 (100.0%) |
| 25 to 34 Years | 199 (100.0%) | 201 (95.3%) |
| 35 to 44 Years | 470 (99.2%) | 487 (100.0%) |
| 45 to 54 Years | 678 (96.9%) | 742 (96.5%) |
| 55 to 64 Years | 954 (98.9%) | 715 (97.3%) |
| 65 to 74 Years | 444 (94.5%) | 639 (93.7%) |
| 75 Years and over | 370 (100.0%) | 509 (90.7%) |
| Total | 4,278 (97.5%) | 4,335 (95.9%) |
Income Below Poverty Among Married-Couple Families in Rio del Mar
The poverty statistics for married-couple families in Rio del Mar show that 0.8% or 18 of the total 2,136 families live below the poverty line. Families with no children have the highest poverty rate of 1.2%, comprising of 18 families. On the other hand, families with 1 or 2 children have the lowest poverty rate of 0.0%, which includes 0 families.
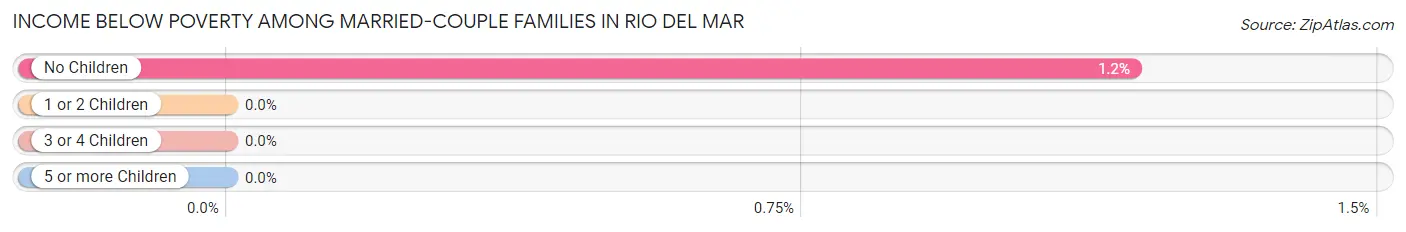
| Children | Above Poverty | Below Poverty |
| No Children | 1,502 (98.8%) | 18 (1.2%) |
| 1 or 2 Children | 535 (100.0%) | 0 (0.0%) |
| 3 or 4 Children | 72 (100.0%) | 0 (0.0%) |
| 5 or more Children | 9 (100.0%) | 0 (0.0%) |
| Total | 2,118 (99.2%) | 18 (0.8%) |
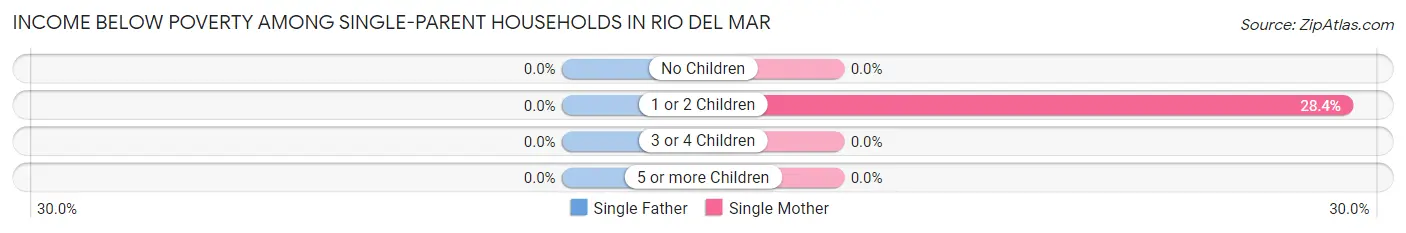
Income Below Poverty Among Single-Parent Households in Rio del Mar
| Children | Single Father | Single Mother |
| No Children | 0 (0.0%) | 0 (0.0%) |
| 1 or 2 Children | 0 (0.0%) | 31 (28.4%) |
| 3 or 4 Children | 0 (0.0%) | 0 (0.0%) |
| 5 or more Children | 0 (0.0%) | 0 (0.0%) |
| Total | 0 (0.0%) | 31 (10.5%) |
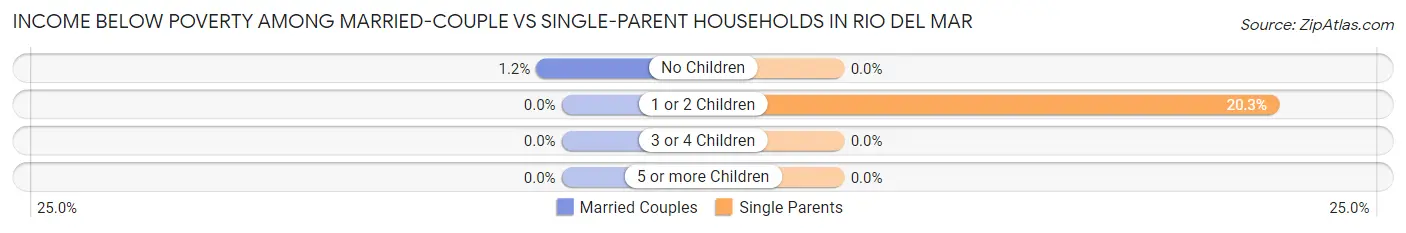
Income Below Poverty Among Married-Couple vs Single-Parent Households in Rio del Mar
The poverty data for Rio del Mar shows that 18 of the married-couple family households (0.8%) and 31 of the single-parent households (7.9%) are living below the poverty level. Within the married-couple family households, those with no children have the highest poverty rate, with 18 households (1.2%) falling below the poverty line. Among the single-parent households, those with 1 or 2 children have the highest poverty rate, with 31 household (20.3%) living below poverty.
| Children | Married-Couple Families | Single-Parent Households |
| No Children | 18 (1.2%) | 0 (0.0%) |
| 1 or 2 Children | 0 (0.0%) | 31 (20.3%) |
| 3 or 4 Children | 0 (0.0%) | 0 (0.0%) |
| 5 or more Children | 0 (0.0%) | 0 (0.0%) |
| Total | 18 (0.8%) | 31 (7.9%) |
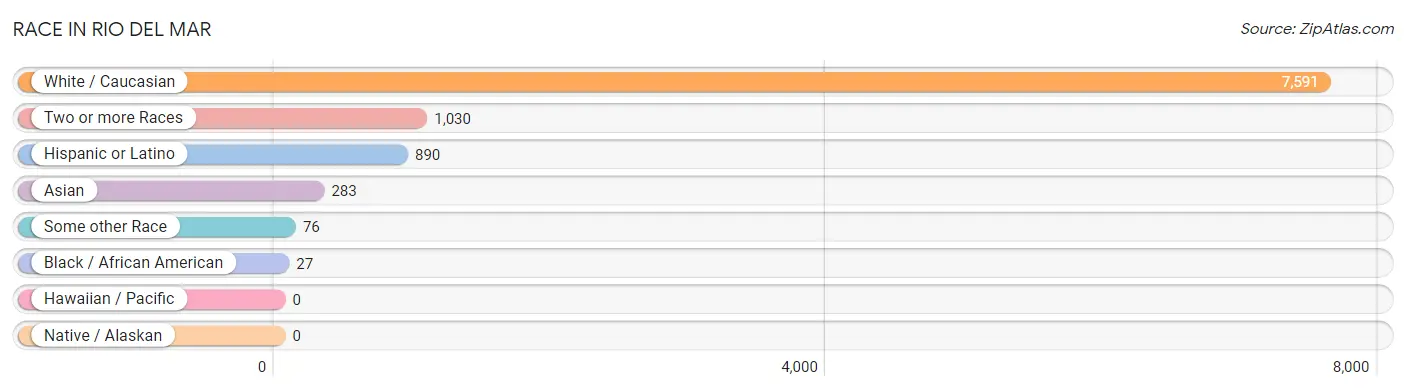
Race in Rio del Mar
The most populous races in Rio del Mar are White / Caucasian (7,591 | 84.3%), Two or more Races (1,030 | 11.4%), and Hispanic or Latino (890 | 9.9%).
| Race | # Population | % Population |
| Asian | 283 | 3.1% |
| Black / African American | 27 | 0.3% |
| Hawaiian / Pacific | 0 | 0.0% |
| Hispanic or Latino | 890 | 9.9% |
| Native / Alaskan | 0 | 0.0% |
| White / Caucasian | 7,591 | 84.3% |
| Two or more Races | 1,030 | 11.4% |
| Some other Race | 76 | 0.8% |
| Total | 9,007 | 100.0% |
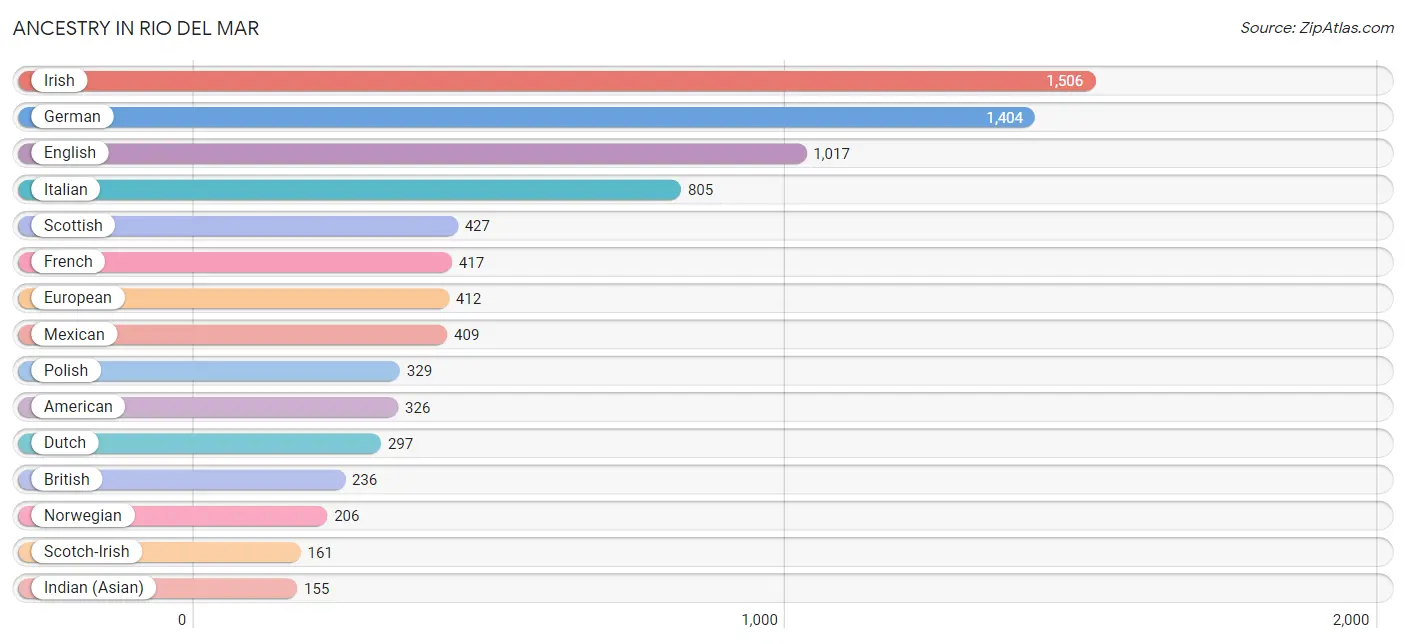
Ancestry in Rio del Mar
The most populous ancestries reported in Rio del Mar are Irish (1,506 | 16.7%), German (1,404 | 15.6%), English (1,017 | 11.3%), Italian (805 | 8.9%), and Scottish (427 | 4.7%), together accounting for 57.3% of all Rio del Mar residents.
| Ancestry | # Population | % Population |
| African | 7 | 0.1% |
| American | 326 | 3.6% |
| Apache | 6 | 0.1% |
| Arab | 6 | 0.1% |
| Armenian | 5 | 0.1% |
| Australian | 18 | 0.2% |
| Austrian | 28 | 0.3% |
| Basque | 11 | 0.1% |
| Belgian | 4 | 0.0% |
| Belizean | 8 | 0.1% |
| Bhutanese | 51 | 0.6% |
| Blackfeet | 7 | 0.1% |
| Brazilian | 25 | 0.3% |
| British | 236 | 2.6% |
| British West Indian | 15 | 0.2% |
| Burmese | 56 | 0.6% |
| Canadian | 86 | 0.9% |
| Central American | 60 | 0.7% |
| Central American Indian | 19 | 0.2% |
| Cherokee | 116 | 1.3% |
| Chilean | 7 | 0.1% |
| Chippewa | 36 | 0.4% |
| Colombian | 13 | 0.1% |
| Croatian | 31 | 0.3% |
| Cuban | 8 | 0.1% |
| Czech | 42 | 0.5% |
| Danish | 147 | 1.6% |
| Dutch | 297 | 3.3% |
| Eastern European | 27 | 0.3% |
| Ecuadorian | 7 | 0.1% |
| English | 1,017 | 11.3% |
| European | 412 | 4.6% |
| Finnish | 60 | 0.7% |
| French | 417 | 4.6% |
| French American Indian | 98 | 1.1% |
| French Canadian | 68 | 0.7% |
| German | 1,404 | 15.6% |
| Greek | 19 | 0.2% |
| Hungarian | 24 | 0.3% |
| Indian (Asian) | 155 | 1.7% |
| Iranian | 23 | 0.3% |
| Irish | 1,506 | 16.7% |
| Italian | 805 | 8.9% |
| Jamaican | 22 | 0.2% |
| Korean | 64 | 0.7% |
| Lebanese | 6 | 0.1% |
| Lithuanian | 22 | 0.2% |
| Luxembourger | 79 | 0.9% |
| Macedonian | 32 | 0.4% |
| Mexican | 409 | 4.5% |
| Nicaraguan | 10 | 0.1% |
| Northern European | 57 | 0.6% |
| Norwegian | 206 | 2.3% |
| Panamanian | 22 | 0.2% |
| Peruvian | 47 | 0.5% |
| Polish | 329 | 3.6% |
| Portuguese | 120 | 1.3% |
| Pueblo | 40 | 0.4% |
| Romanian | 4 | 0.0% |
| Russian | 146 | 1.6% |
| Salvadoran | 28 | 0.3% |
| Scandinavian | 32 | 0.4% |
| Scotch-Irish | 161 | 1.8% |
| Scottish | 427 | 4.7% |
| Serbian | 46 | 0.5% |
| South African | 9 | 0.1% |
| South American | 96 | 1.1% |
| Spaniard | 94 | 1.0% |
| Spanish | 30 | 0.3% |
| Sri Lankan | 37 | 0.4% |
| Subsaharan African | 16 | 0.2% |
| Swedish | 135 | 1.5% |
| Swiss | 110 | 1.2% |
| Thai | 88 | 1.0% |
| Trinidadian and Tobagonian | 22 | 0.2% |
| Turkish | 11 | 0.1% |
| Ukrainian | 45 | 0.5% |
| Venezuelan | 22 | 0.2% |
| Welsh | 78 | 0.9% |
| Yaqui | 26 | 0.3% | View All 80 Rows |
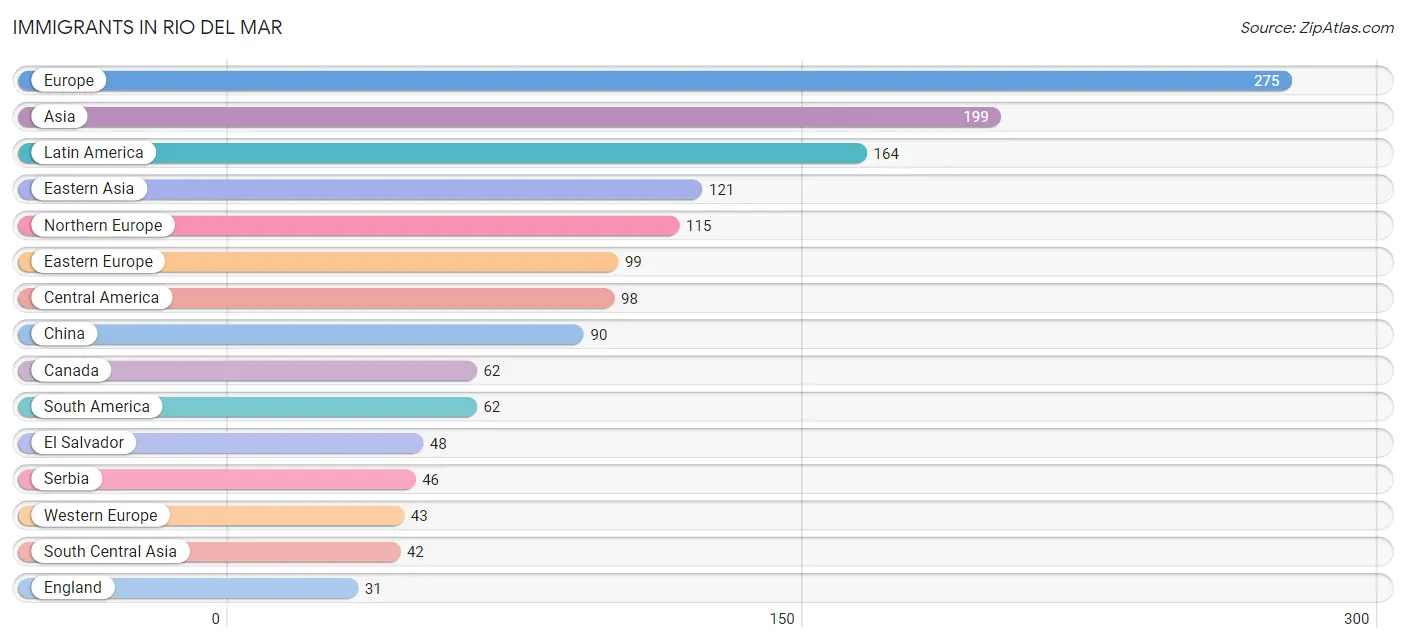
Immigrants in Rio del Mar
The most numerous immigrant groups reported in Rio del Mar came from Europe (275 | 3.0%), Asia (199 | 2.2%), Latin America (164 | 1.8%), Eastern Asia (121 | 1.3%), and Northern Europe (115 | 1.3%), together accounting for 9.7% of all Rio del Mar residents.
| Immigration Origin | # Population | % Population |
| Africa | 9 | 0.1% |
| Argentina | 5 | 0.1% |
| Asia | 199 | 2.2% |
| Australia | 29 | 0.3% |
| Canada | 62 | 0.7% |
| Caribbean | 4 | 0.0% |
| Central America | 98 | 1.1% |
| China | 90 | 1.0% |
| Colombia | 13 | 0.1% |
| Cuba | 4 | 0.0% |
| Denmark | 21 | 0.2% |
| Eastern Asia | 121 | 1.3% |
| Eastern Europe | 99 | 1.1% |
| El Salvador | 48 | 0.5% |
| England | 31 | 0.3% |
| Europe | 275 | 3.0% |
| France | 16 | 0.2% |
| Germany | 27 | 0.3% |
| Hong Kong | 6 | 0.1% |
| India | 12 | 0.1% |
| Iran | 30 | 0.3% |
| Ireland | 8 | 0.1% |
| Italy | 18 | 0.2% |
| Japan | 7 | 0.1% |
| Korea | 24 | 0.3% |
| Latin America | 164 | 1.8% |
| Lebanon | 6 | 0.1% |
| Mexico | 18 | 0.2% |
| Nicaragua | 10 | 0.1% |
| Northern Europe | 115 | 1.3% |
| Oceania | 29 | 0.3% |
| Panama | 22 | 0.2% |
| Peru | 22 | 0.2% |
| Philippines | 19 | 0.2% |
| Poland | 24 | 0.3% |
| Scotland | 4 | 0.0% |
| Serbia | 46 | 0.5% |
| South Africa | 9 | 0.1% |
| South America | 62 | 0.7% |
| South Central Asia | 42 | 0.5% |
| South Eastern Asia | 30 | 0.3% |
| Southern Europe | 18 | 0.2% |
| Sweden | 5 | 0.1% |
| Taiwan | 9 | 0.1% |
| Venezuela | 22 | 0.2% |
| Vietnam | 11 | 0.1% |
| Western Asia | 6 | 0.1% |
| Western Europe | 43 | 0.5% | View All 48 Rows |
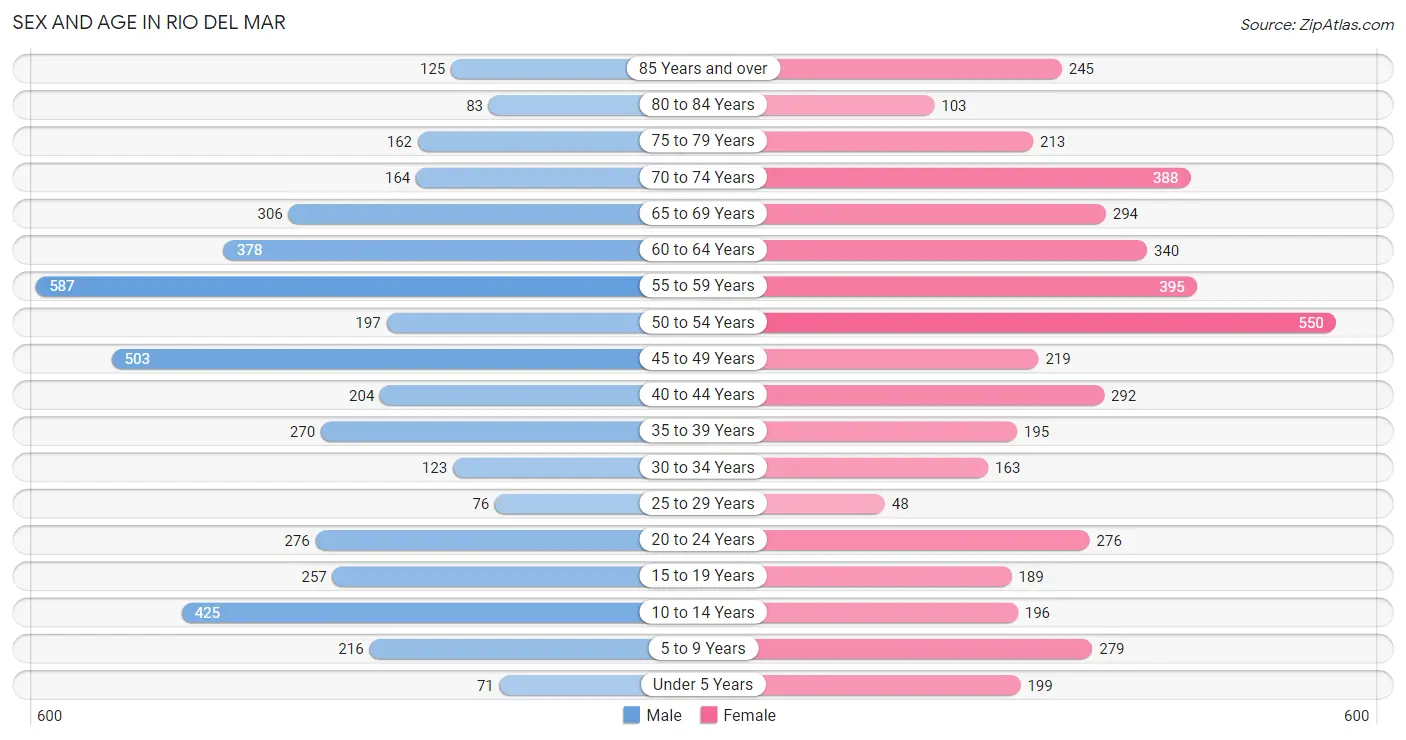
Sex and Age in Rio del Mar
Sex and Age in Rio del Mar
The most populous age groups in Rio del Mar are 55 to 59 Years (587 | 13.3%) for men and 50 to 54 Years (550 | 12.0%) for women.
| Age Bracket | Male | Female |
| Under 5 Years | 71 (1.6%) | 199 (4.3%) |
| 5 to 9 Years | 216 (4.9%) | 279 (6.1%) |
| 10 to 14 Years | 425 (9.6%) | 196 (4.3%) |
| 15 to 19 Years | 257 (5.8%) | 189 (4.1%) |
| 20 to 24 Years | 276 (6.2%) | 276 (6.0%) |
| 25 to 29 Years | 76 (1.7%) | 48 (1.1%) |
| 30 to 34 Years | 123 (2.8%) | 163 (3.6%) |
| 35 to 39 Years | 270 (6.1%) | 195 (4.3%) |
| 40 to 44 Years | 204 (4.6%) | 292 (6.4%) |
| 45 to 49 Years | 503 (11.4%) | 219 (4.8%) |
| 50 to 54 Years | 197 (4.4%) | 550 (12.0%) |
| 55 to 59 Years | 587 (13.3%) | 395 (8.6%) |
| 60 to 64 Years | 378 (8.6%) | 340 (7.4%) |
| 65 to 69 Years | 306 (6.9%) | 294 (6.4%) |
| 70 to 74 Years | 164 (3.7%) | 388 (8.5%) |
| 75 to 79 Years | 162 (3.7%) | 213 (4.6%) |
| 80 to 84 Years | 83 (1.9%) | 103 (2.2%) |
| 85 Years and over | 125 (2.8%) | 245 (5.3%) |
| Total | 4,423 (100.0%) | 4,584 (100.0%) |
Families and Households in Rio del Mar
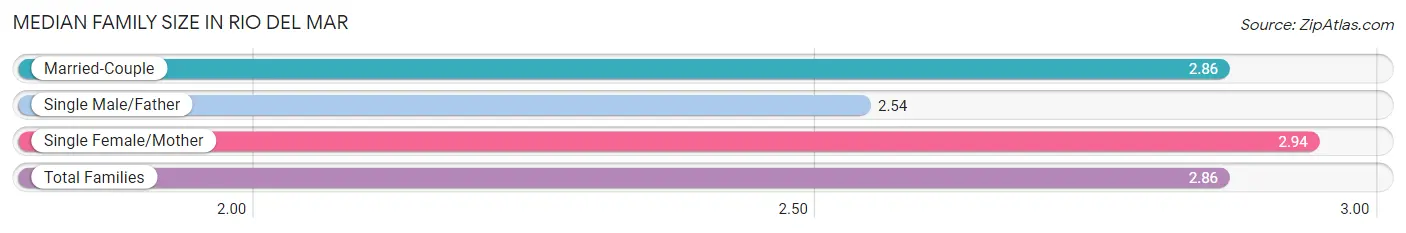
Median Family Size in Rio del Mar
The median family size in Rio del Mar is 2.86 persons per family, with single female/mother families (294 | 11.6%) accounting for the largest median family size of 2.94 persons per family. On the other hand, single male/father families (98 | 3.9%) represent the smallest median family size with 2.54 persons per family.
| Family Type | # Families | Family Size |
| Married-Couple | 2,136 (84.5%) | 2.86 |
| Single Male/Father | 98 (3.9%) | 2.54 |
| Single Female/Mother | 294 (11.6%) | 2.94 |
| Total Families | 2,528 (100.0%) | 2.86 |
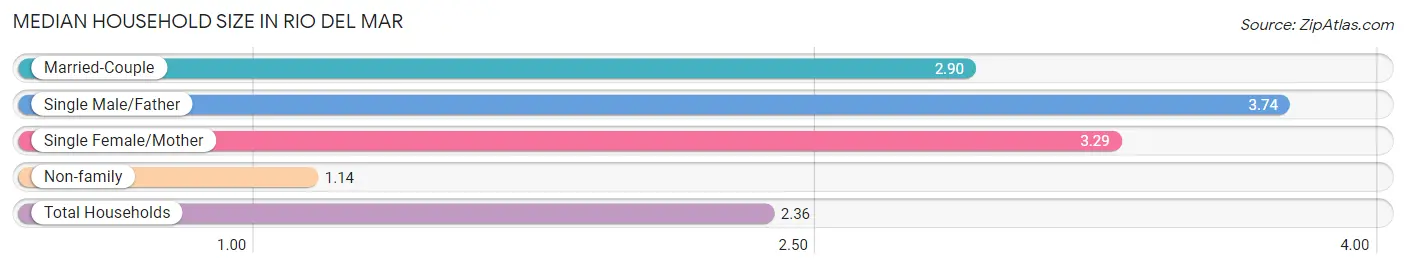
Median Household Size in Rio del Mar
The median household size in Rio del Mar is 2.36 persons per household, with single male/father households (98 | 2.6%) accounting for the largest median household size of 3.74 persons per household. non-family households (1,276 | 33.5%) represent the smallest median household size with 1.14 persons per household.
| Household Type | # Households | Household Size |
| Married-Couple | 2,136 (56.1%) | 2.90 |
| Single Male/Father | 98 (2.6%) | 3.74 |
| Single Female/Mother | 294 (7.7%) | 3.29 |
| Non-family | 1,276 (33.5%) | 1.14 |
| Total Households | 3,804 (100.0%) | 2.36 |
Household Size by Marriage Status in Rio del Mar
Out of a total of 3,804 households in Rio del Mar, 2,528 (66.5%) are family households, while 1,276 (33.5%) are nonfamily households. The most numerous type of family households are 2-person households, comprising 1,332, and the most common type of nonfamily households are 1-person households, comprising 1,133.
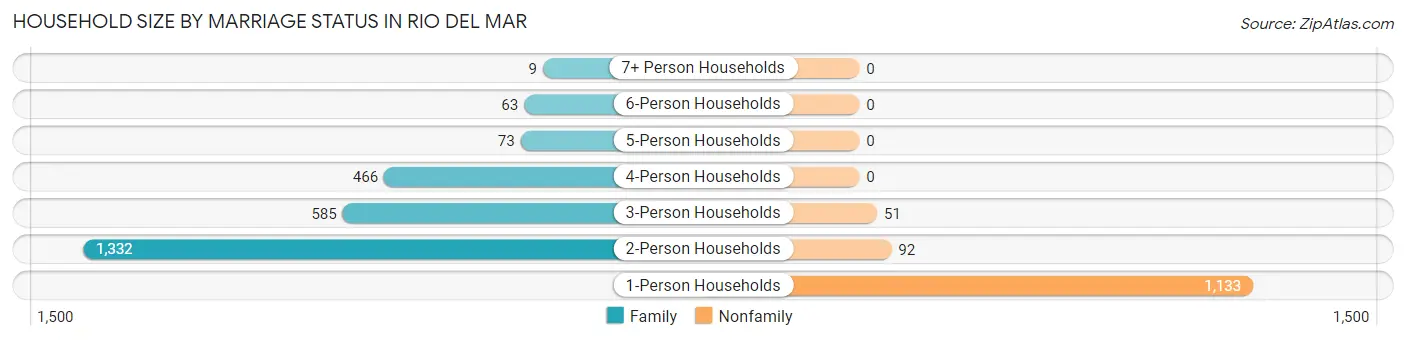
| Household Size | Family Households | Nonfamily Households |
| 1-Person Households | - | 1,133 (29.8%) |
| 2-Person Households | 1,332 (35.0%) | 92 (2.4%) |
| 3-Person Households | 585 (15.4%) | 51 (1.3%) |
| 4-Person Households | 466 (12.2%) | 0 (0.0%) |
| 5-Person Households | 73 (1.9%) | 0 (0.0%) |
| 6-Person Households | 63 (1.7%) | 0 (0.0%) |
| 7+ Person Households | 9 (0.2%) | 0 (0.0%) |
| Total | 2,528 (66.5%) | 1,276 (33.5%) |
Female Fertility in Rio del Mar
Fertility by Age in Rio del Mar
Average fertility rate in Rio del Mar is 10.0 births per 1,000 women. Women in the age bracket of 20 to 34 years have the highest fertility rate with 16.0 births per 1,000 women. Women in the age bracket of 20 to 34 years acount for 53.3% of all women with births.
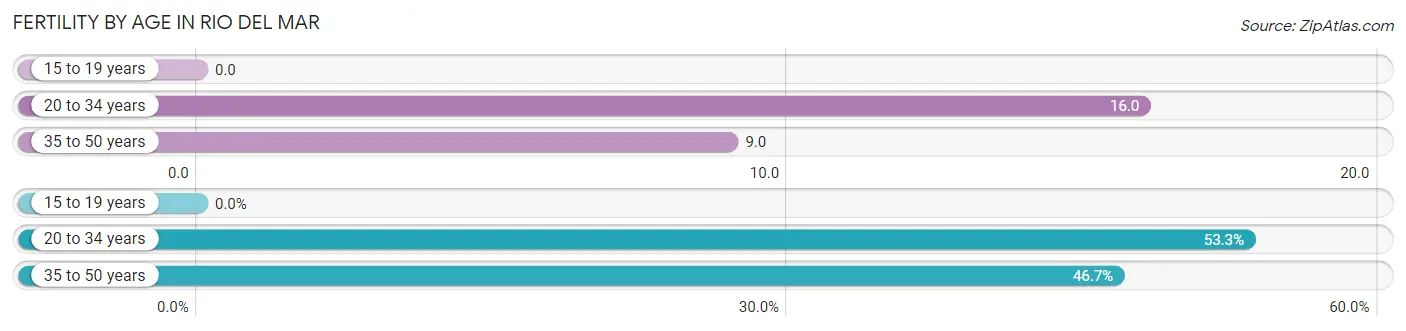
| Age Bracket | Women with Births | Births / 1,000 Women |
| 15 to 19 years | 0 (0.0%) | 0.0 |
| 20 to 34 years | 8 (53.3%) | 16.0 |
| 35 to 50 years | 7 (46.7%) | 9.0 |
| Total | 15 (100.0%) | 10.0 |
Fertility by Age by Marriage Status in Rio del Mar
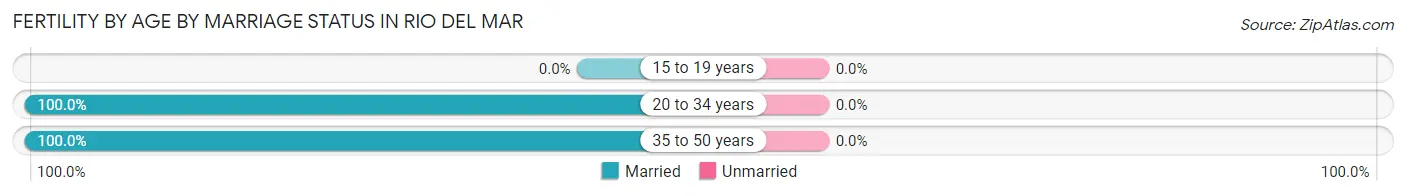
| Age Bracket | Married | Unmarried |
| 15 to 19 years | 0 (0.0%) | 0 (0.0%) |
| 20 to 34 years | 8 (100.0%) | 0 (0.0%) |
| 35 to 50 years | 7 (100.0%) | 0 (0.0%) |
| Total | 15 (100.0%) | 0 (0.0%) |
Fertility by Education in Rio del Mar
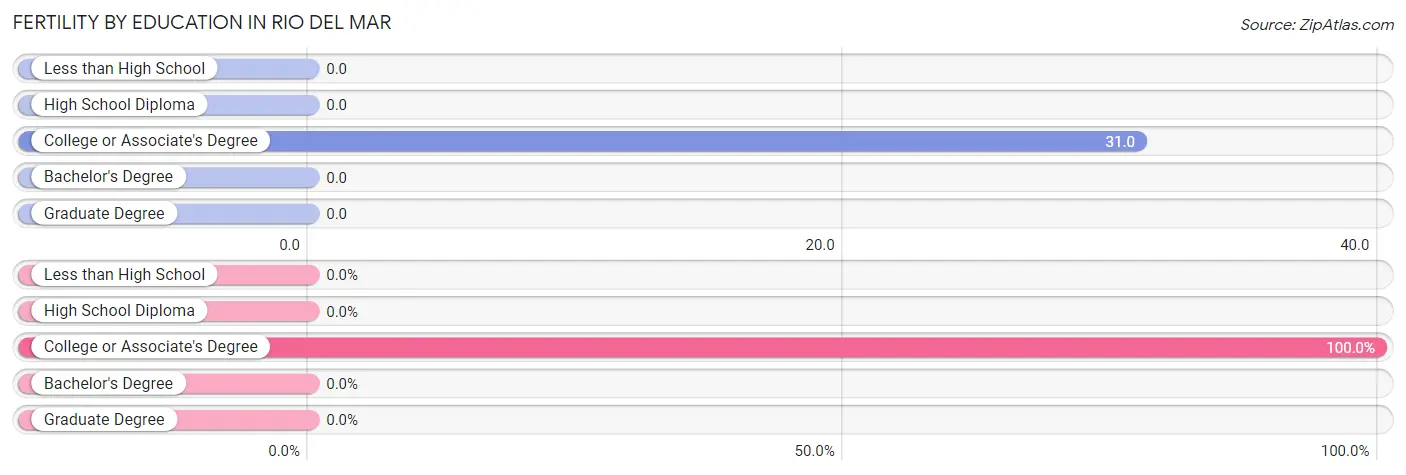
| Educational Attainment | Women with Births | Births / 1,000 Women |
| Less than High School | 0 (0.0%) | 0.0 |
| High School Diploma | 0 (0.0%) | 0.0 |
| College or Associate's Degree | 15 (100.0%) | 31.0 |
| Bachelor's Degree | 0 (0.0%) | 0.0 |
| Graduate Degree | 0 (0.0%) | 0.0 |
| Total | 15 (100.0%) | 10.0 |
Fertility by Education by Marriage Status in Rio del Mar
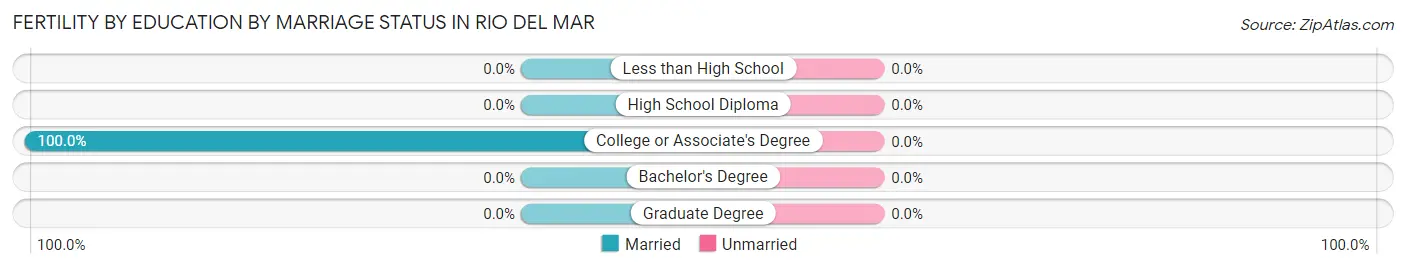
| Educational Attainment | Married | Unmarried |
| Less than High School | 0 (0.0%) | 0 (0.0%) |
| High School Diploma | 0 (0.0%) | 0 (0.0%) |
| College or Associate's Degree | 15 (100.0%) | 0 (0.0%) |
| Bachelor's Degree | 0 (0.0%) | 0 (0.0%) |
| Graduate Degree | 0 (0.0%) | 0 (0.0%) |
| Total | 15 (100.0%) | 0 (0.0%) |
Employment Characteristics in Rio del Mar
Employment by Class of Employer in Rio del Mar
Among the 4,549 employed individuals in Rio del Mar, private company employees (2,656 | 58.4%), self-employed (not incorporated) (528 | 11.6%), and local government employees (499 | 11.0%) make up the most common classes of employment.
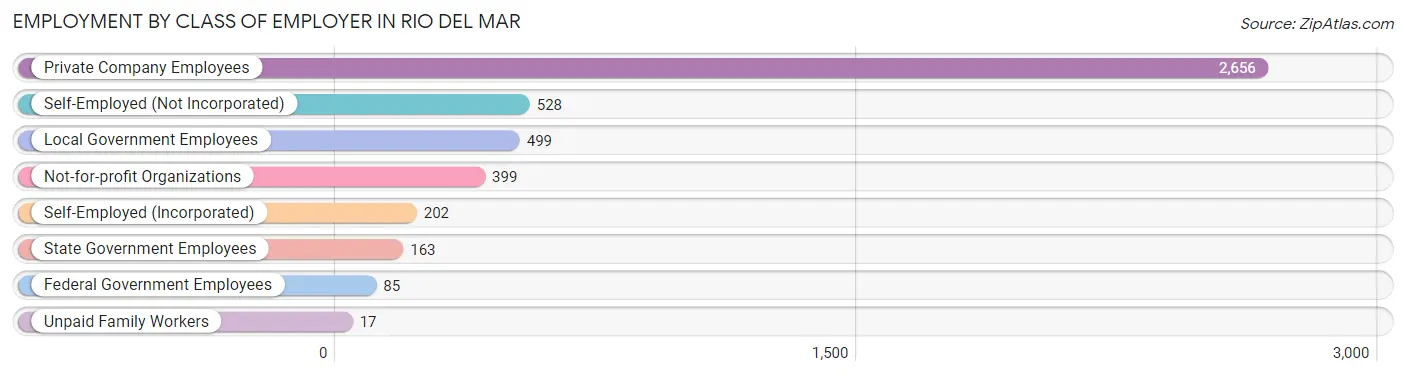
| Employer Class | # Employees | % Employees |
| Private Company Employees | 2,656 | 58.4% |
| Self-Employed (Incorporated) | 202 | 4.4% |
| Self-Employed (Not Incorporated) | 528 | 11.6% |
| Not-for-profit Organizations | 399 | 8.8% |
| Local Government Employees | 499 | 11.0% |
| State Government Employees | 163 | 3.6% |
| Federal Government Employees | 85 | 1.9% |
| Unpaid Family Workers | 17 | 0.4% |
| Total | 4,549 | 100.0% |
Employment Status by Age in Rio del Mar
According to the labor force statistics for Rio del Mar, out of the total population over 16 years of age (7,535), 64.6% or 4,868 individuals are in the labor force, with 4.6% or 224 of them unemployed. The age group with the highest labor force participation rate is 45 to 54 years, with 88.7% or 1,303 individuals in the labor force. Within the labor force, the 30 to 34 years age range has the highest percentage of unemployed individuals, with 28.9% or 57 of them being unemployed.
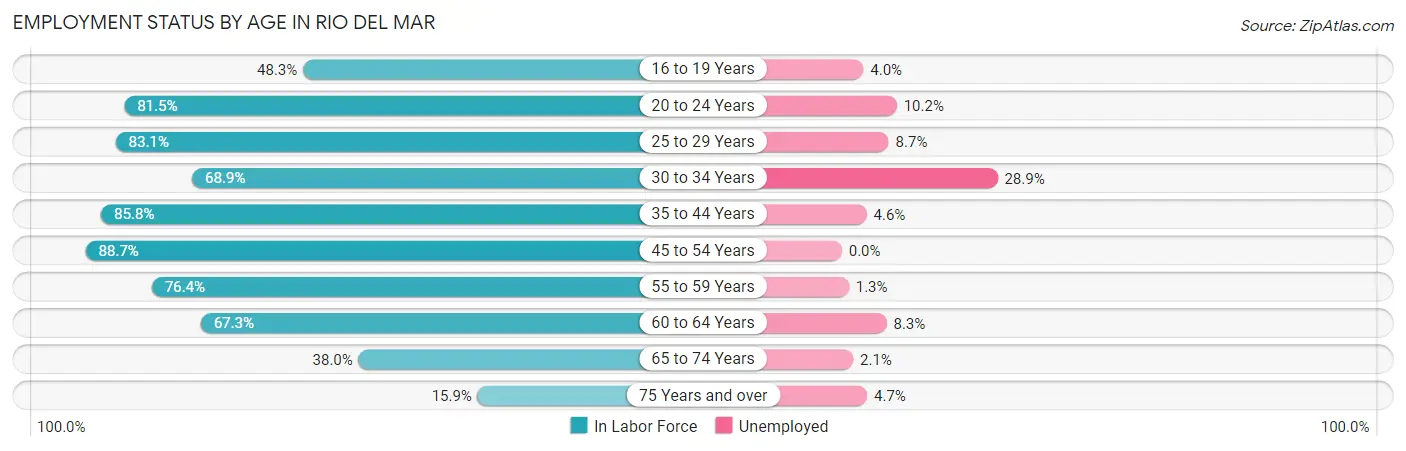
| Age Bracket | In Labor Force | Unemployed |
| 16 to 19 Years | 174 (48.3%) | 7 (4.0%) |
| 20 to 24 Years | 450 (81.5%) | 46 (10.2%) |
| 25 to 29 Years | 103 (83.1%) | 9 (8.7%) |
| 30 to 34 Years | 197 (68.9%) | 57 (28.9%) |
| 35 to 44 Years | 825 (85.8%) | 38 (4.6%) |
| 45 to 54 Years | 1,303 (88.7%) | 0 (0.0%) |
| 55 to 59 Years | 750 (76.4%) | 10 (1.3%) |
| 60 to 64 Years | 483 (67.3%) | 40 (8.3%) |
| 65 to 74 Years | 438 (38.0%) | 9 (2.1%) |
| 75 Years and over | 148 (15.9%) | 7 (4.7%) |
| Total | 4,868 (64.6%) | 224 (4.6%) |
Employment Status by Educational Attainment in Rio del Mar
According to labor force statistics for Rio del Mar, 80.6% of individuals (3,659) out of the total population between 25 and 64 years of age (4,540) are in the labor force, with 4.2% or 154 of them being unemployed. The group with the highest labor force participation rate are those with the educational attainment of less than high school, with 95.1% or 58 individuals in the labor force. Within the labor force, individuals with less than high school education have the highest percentage of unemployment, with 24.1% or 14 of them being unemployed.
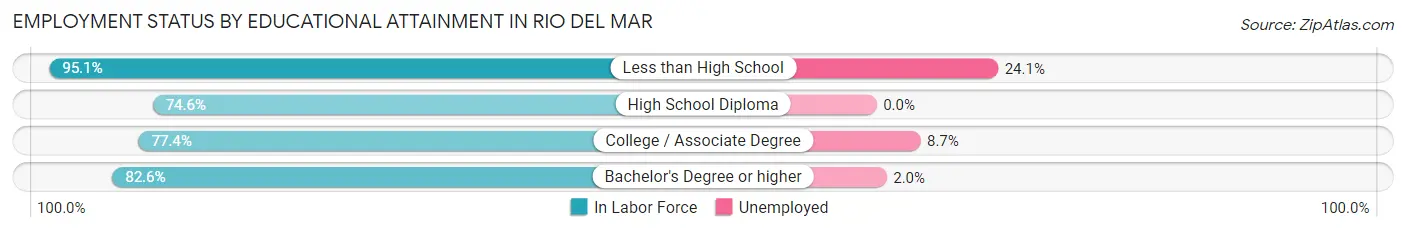
| Educational Attainment | In Labor Force | Unemployed |
| Less than High School | 58 (95.1%) | 15 (24.1%) |
| High School Diploma | 217 (74.6%) | 0 (0.0%) |
| College / Associate Degree | 1,091 (77.4%) | 123 (8.7%) |
| Bachelor's Degree or higher | 2,295 (82.6%) | 56 (2.0%) |
| Total | 3,659 (80.6%) | 191 (4.2%) |
Employment Occupations by Sex in Rio del Mar
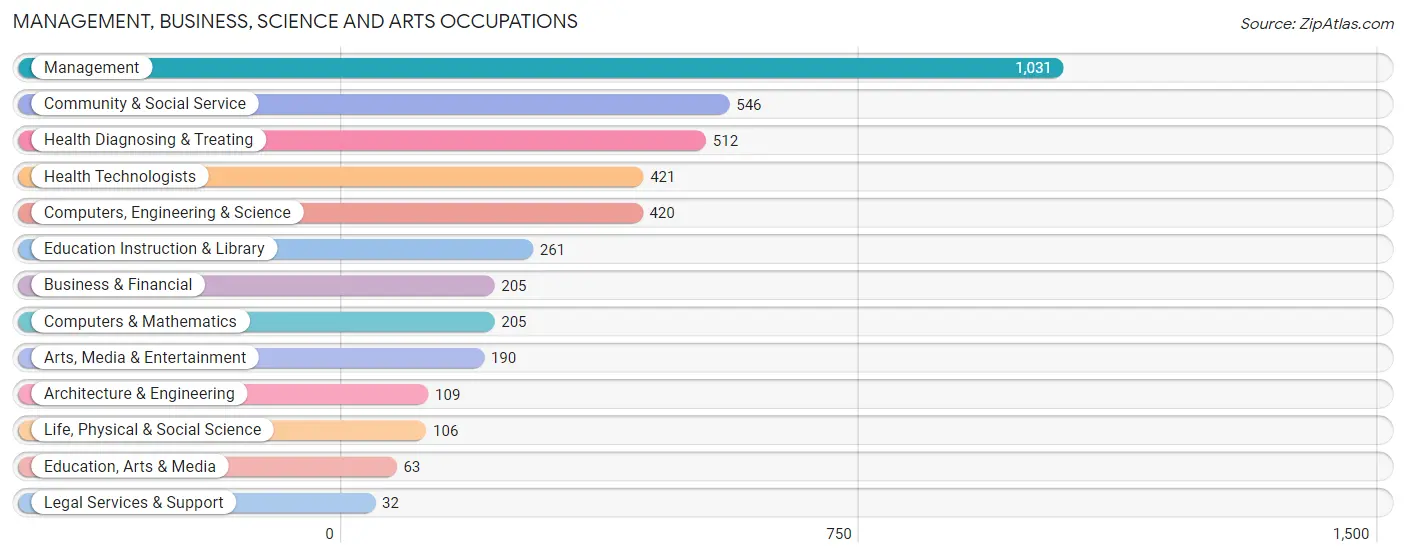
Management, Business, Science and Arts Occupations
The most common Management, Business, Science and Arts occupations in Rio del Mar are Management (1,031 | 22.2%), Community & Social Service (546 | 11.7%), Health Diagnosing & Treating (512 | 11.0%), Health Technologists (421 | 9.1%), and Computers, Engineering & Science (420 | 9.0%).
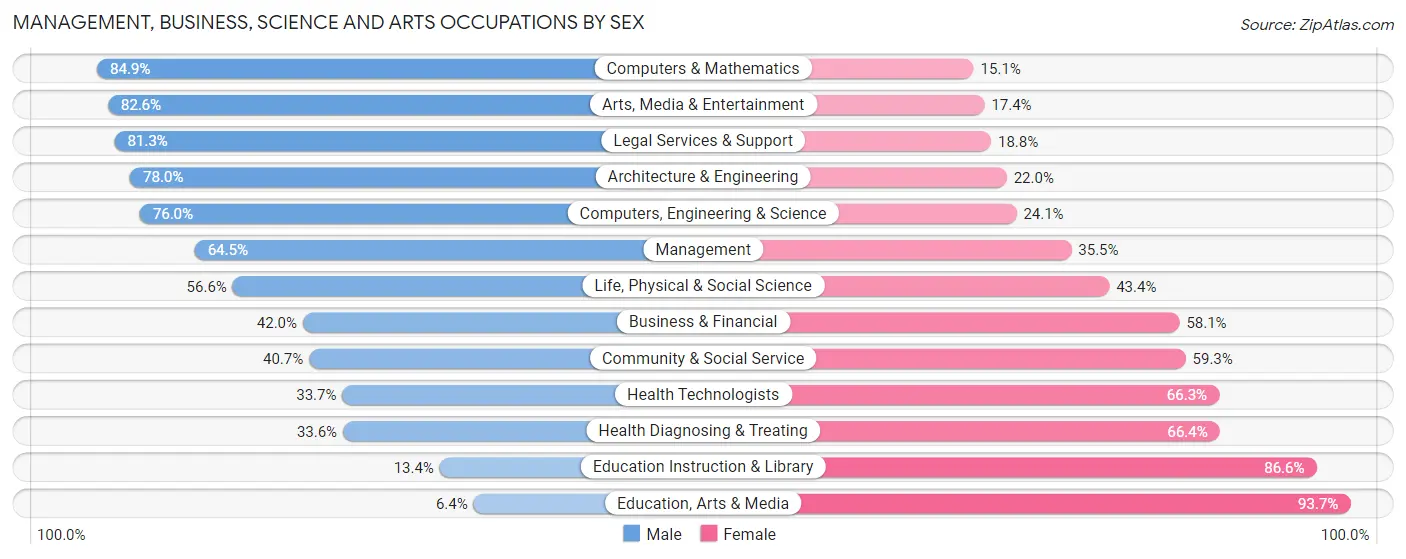
Management, Business, Science and Arts Occupations by Sex
Within the Management, Business, Science and Arts occupations in Rio del Mar, the most male-oriented occupations are Computers & Mathematics (84.9%), Arts, Media & Entertainment (82.6%), and Legal Services & Support (81.2%), while the most female-oriented occupations are Education, Arts & Media (93.6%), Education Instruction & Library (86.6%), and Health Diagnosing & Treating (66.4%).
| Occupation | Male | Female |
| Management | 665 (64.5%) | 366 (35.5%) |
| Business & Financial | 86 (41.9%) | 119 (58.1%) |
| Computers, Engineering & Science | 319 (75.9%) | 101 (24.0%) |
| Computers & Mathematics | 174 (84.9%) | 31 (15.1%) |
| Architecture & Engineering | 85 (78.0%) | 24 (22.0%) |
| Life, Physical & Social Science | 60 (56.6%) | 46 (43.4%) |
| Community & Social Service | 222 (40.7%) | 324 (59.3%) |
| Education, Arts & Media | 4 (6.4%) | 59 (93.6%) |
| Legal Services & Support | 26 (81.2%) | 6 (18.8%) |
| Education Instruction & Library | 35 (13.4%) | 226 (86.6%) |
| Arts, Media & Entertainment | 157 (82.6%) | 33 (17.4%) |
| Health Diagnosing & Treating | 172 (33.6%) | 340 (66.4%) |
| Health Technologists | 142 (33.7%) | 279 (66.3%) |
| Total (Category) | 1,464 (53.9%) | 1,250 (46.1%) |
| Total (Overall) | 2,517 (54.1%) | 2,131 (45.9%) |
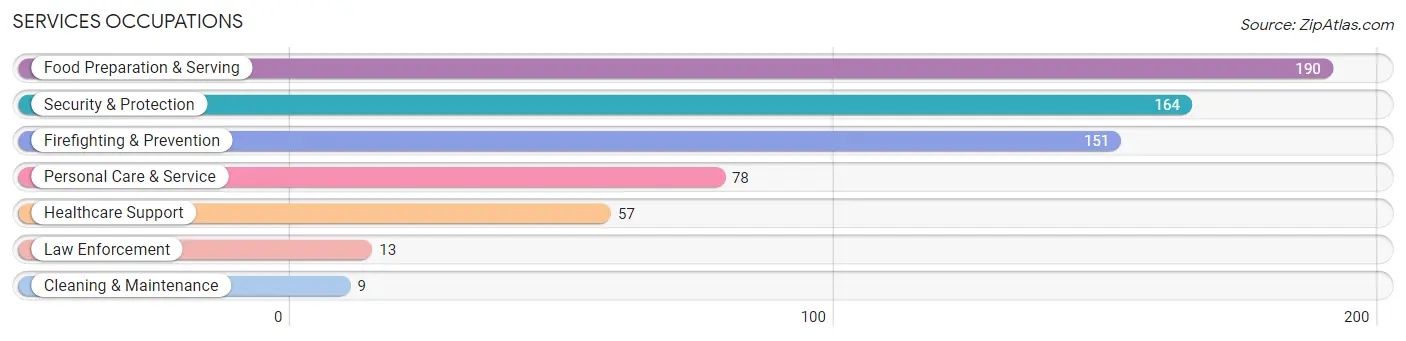
Services Occupations
The most common Services occupations in Rio del Mar are Food Preparation & Serving (190 | 4.1%), Security & Protection (164 | 3.5%), Firefighting & Prevention (151 | 3.3%), Personal Care & Service (78 | 1.7%), and Healthcare Support (57 | 1.2%).
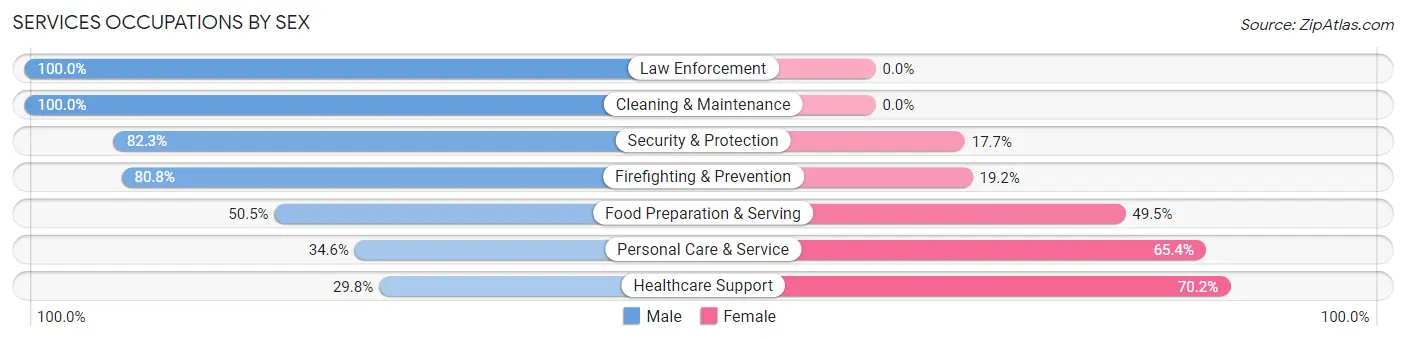
Services Occupations by Sex
Within the Services occupations in Rio del Mar, the most male-oriented occupations are Law Enforcement (100.0%), Cleaning & Maintenance (100.0%), and Security & Protection (82.3%), while the most female-oriented occupations are Healthcare Support (70.2%), Personal Care & Service (65.4%), and Food Preparation & Serving (49.5%).
| Occupation | Male | Female |
| Healthcare Support | 17 (29.8%) | 40 (70.2%) |
| Security & Protection | 135 (82.3%) | 29 (17.7%) |
| Firefighting & Prevention | 122 (80.8%) | 29 (19.2%) |
| Law Enforcement | 13 (100.0%) | 0 (0.0%) |
| Food Preparation & Serving | 96 (50.5%) | 94 (49.5%) |
| Cleaning & Maintenance | 9 (100.0%) | 0 (0.0%) |
| Personal Care & Service | 27 (34.6%) | 51 (65.4%) |
| Total (Category) | 284 (57.0%) | 214 (43.0%) |
| Total (Overall) | 2,517 (54.1%) | 2,131 (45.9%) |
Sales and Office Occupations
The most common Sales and Office occupations in Rio del Mar are Sales & Related (753 | 16.2%), and Office & Administration (443 | 9.5%).
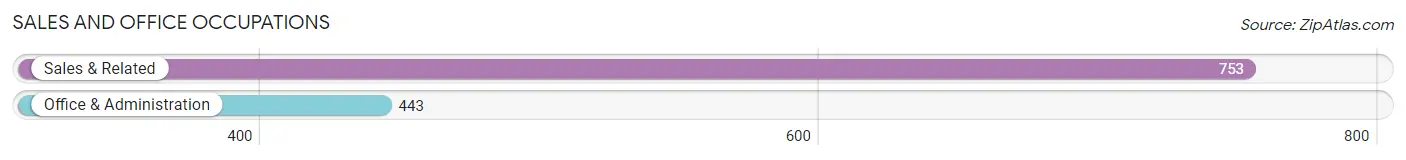
Sales and Office Occupations by Sex

| Occupation | Male | Female |
| Sales & Related | 485 (64.4%) | 268 (35.6%) |
| Office & Administration | 75 (16.9%) | 368 (83.1%) |
| Total (Category) | 560 (46.8%) | 636 (53.2%) |
| Total (Overall) | 2,517 (54.1%) | 2,131 (45.9%) |
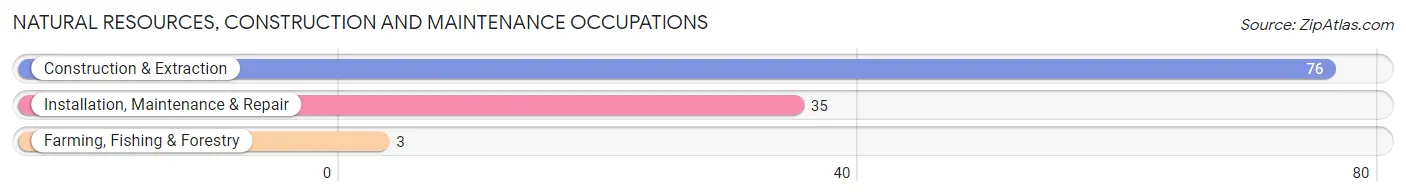
Natural Resources, Construction and Maintenance Occupations
The most common Natural Resources, Construction and Maintenance occupations in Rio del Mar are Construction & Extraction (76 | 1.6%), Installation, Maintenance & Repair (35 | 0.7%), and Farming, Fishing & Forestry (3 | 0.1%).
Natural Resources, Construction and Maintenance Occupations by Sex
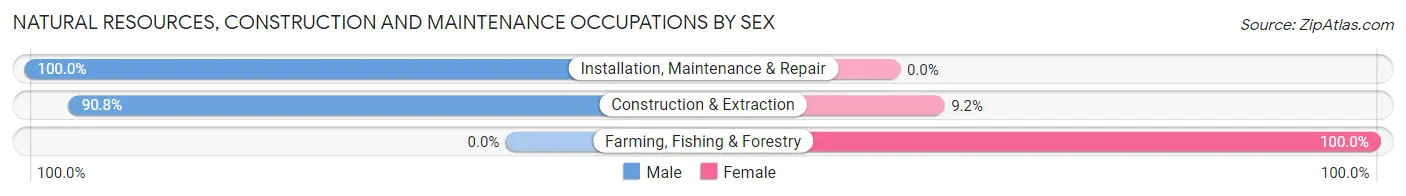
| Occupation | Male | Female |
| Farming, Fishing & Forestry | 0 (0.0%) | 3 (100.0%) |
| Construction & Extraction | 69 (90.8%) | 7 (9.2%) |
| Installation, Maintenance & Repair | 35 (100.0%) | 0 (0.0%) |
| Total (Category) | 104 (91.2%) | 10 (8.8%) |
| Total (Overall) | 2,517 (54.1%) | 2,131 (45.9%) |
Production, Transportation and Moving Occupations
The most common Production, Transportation and Moving occupations in Rio del Mar are Production (76 | 1.6%), Transportation (31 | 0.7%), and Material Moving (19 | 0.4%).
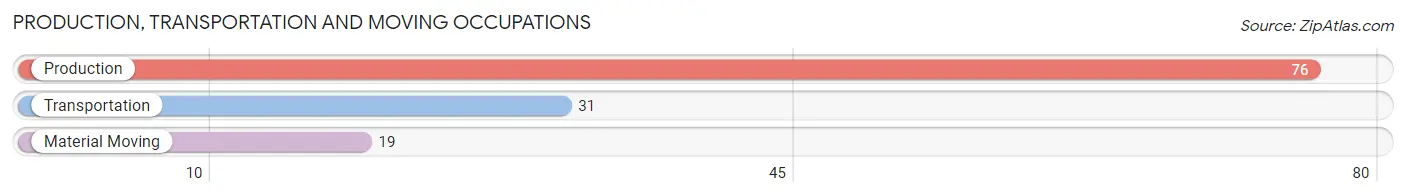
Production, Transportation and Moving Occupations by Sex
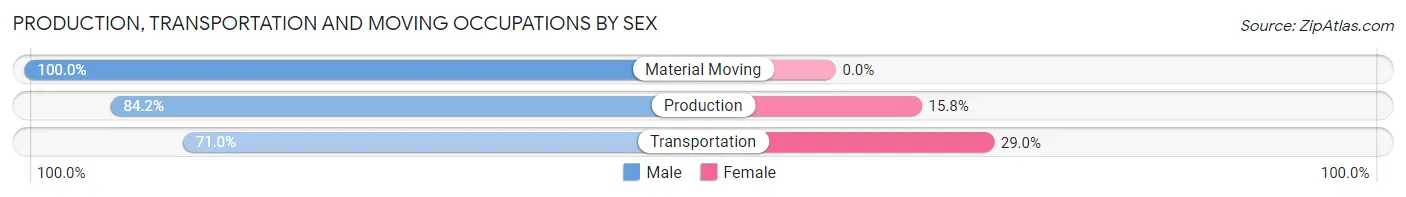
| Occupation | Male | Female |
| Production | 64 (84.2%) | 12 (15.8%) |
| Transportation | 22 (71.0%) | 9 (29.0%) |
| Material Moving | 19 (100.0%) | 0 (0.0%) |
| Total (Category) | 105 (83.3%) | 21 (16.7%) |
| Total (Overall) | 2,517 (54.1%) | 2,131 (45.9%) |
Employment Industries by Sex in Rio del Mar
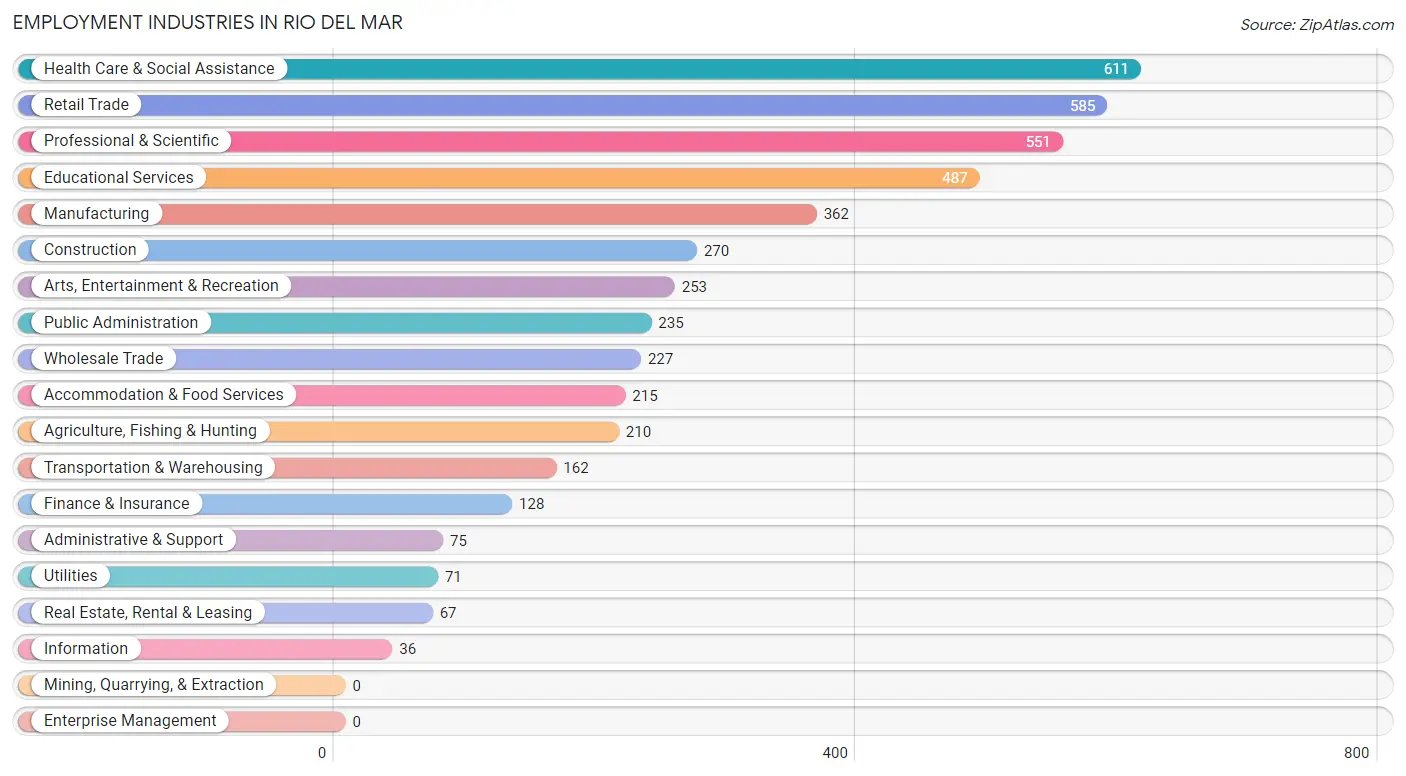
Employment Industries in Rio del Mar
The major employment industries in Rio del Mar include Health Care & Social Assistance (611 | 13.2%), Retail Trade (585 | 12.6%), Professional & Scientific (551 | 11.8%), Educational Services (487 | 10.5%), and Manufacturing (362 | 7.8%).
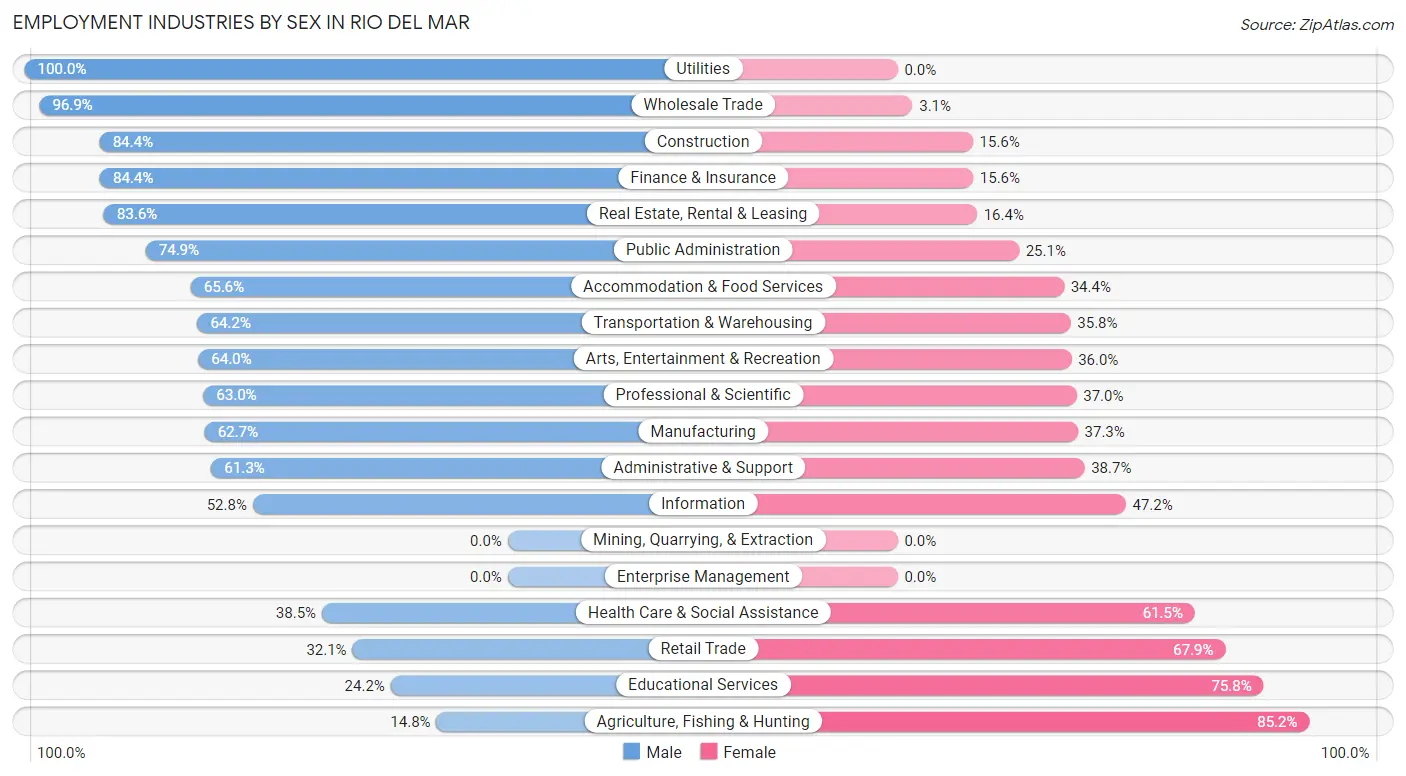
Employment Industries by Sex in Rio del Mar
The Rio del Mar industries that see more men than women are Utilities (100.0%), Wholesale Trade (96.9%), and Construction (84.4%), whereas the industries that tend to have a higher number of women are Agriculture, Fishing & Hunting (85.2%), Educational Services (75.8%), and Retail Trade (67.9%).
| Industry | Male | Female |
| Agriculture, Fishing & Hunting | 31 (14.8%) | 179 (85.2%) |
| Mining, Quarrying, & Extraction | 0 (0.0%) | 0 (0.0%) |
| Construction | 228 (84.4%) | 42 (15.6%) |
| Manufacturing | 227 (62.7%) | 135 (37.3%) |
| Wholesale Trade | 220 (96.9%) | 7 (3.1%) |
| Retail Trade | 188 (32.1%) | 397 (67.9%) |
| Transportation & Warehousing | 104 (64.2%) | 58 (35.8%) |
| Utilities | 71 (100.0%) | 0 (0.0%) |
| Information | 19 (52.8%) | 17 (47.2%) |
| Finance & Insurance | 108 (84.4%) | 20 (15.6%) |
| Real Estate, Rental & Leasing | 56 (83.6%) | 11 (16.4%) |
| Professional & Scientific | 347 (63.0%) | 204 (37.0%) |
| Enterprise Management | 0 (0.0%) | 0 (0.0%) |
| Administrative & Support | 46 (61.3%) | 29 (38.7%) |
| Educational Services | 118 (24.2%) | 369 (75.8%) |
| Health Care & Social Assistance | 235 (38.5%) | 376 (61.5%) |
| Arts, Entertainment & Recreation | 162 (64.0%) | 91 (36.0%) |
| Accommodation & Food Services | 141 (65.6%) | 74 (34.4%) |
| Public Administration | 176 (74.9%) | 59 (25.1%) |
| Total | 2,517 (54.1%) | 2,131 (45.9%) |
Education in Rio del Mar
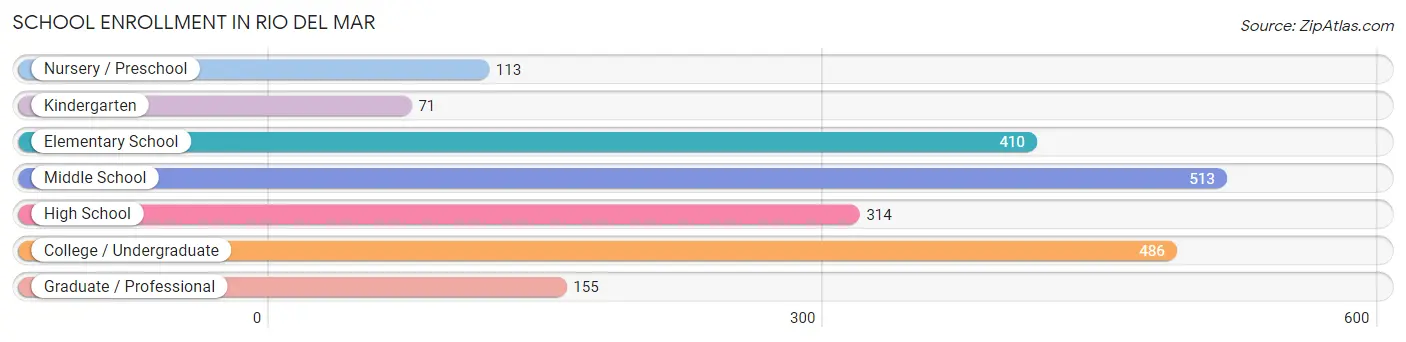
School Enrollment in Rio del Mar
The most common levels of schooling among the 2,062 students in Rio del Mar are middle school (513 | 24.9%), college / undergraduate (486 | 23.6%), and elementary school (410 | 19.9%).
| School Level | # Students | % Students |
| Nursery / Preschool | 113 | 5.5% |
| Kindergarten | 71 | 3.4% |
| Elementary School | 410 | 19.9% |
| Middle School | 513 | 24.9% |
| High School | 314 | 15.2% |
| College / Undergraduate | 486 | 23.6% |
| Graduate / Professional | 155 | 7.5% |
| Total | 2,062 | 100.0% |
School Enrollment by Age by Funding Source in Rio del Mar
Out of a total of 2,062 students who are enrolled in schools in Rio del Mar, 499 (24.2%) attend a private institution, while the remaining 1,563 (75.8%) are enrolled in public schools. The age group of 3 to 4 year olds has the highest likelihood of being enrolled in private schools, with 96 (90.6% in the age bracket) enrolled. Conversely, the age group of 20 to 24 year olds has the lowest likelihood of being enrolled in a private school, with 290 (91.8% in the age bracket) attending a public institution.
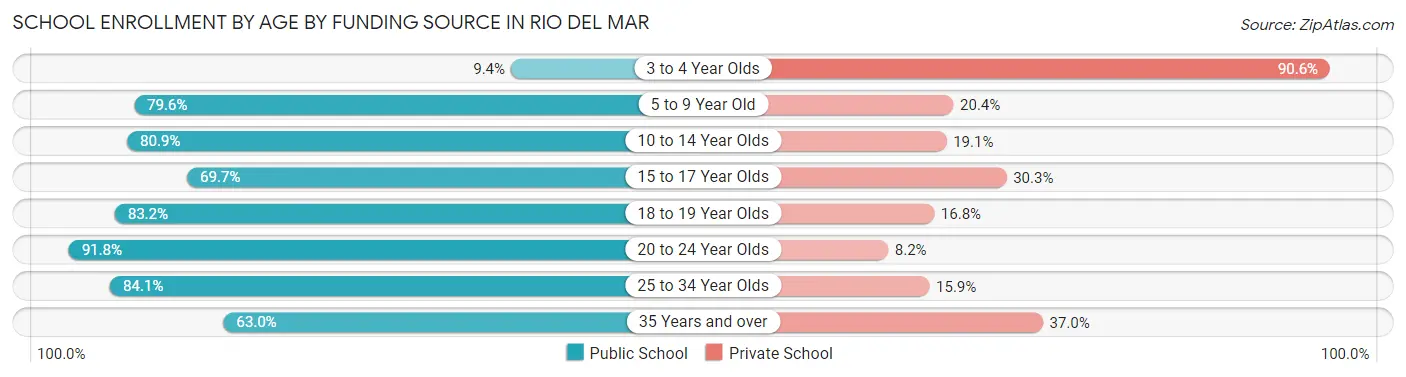
| Age Bracket | Public School | Private School |
| 3 to 4 Year Olds | 10 (9.4%) | 96 (90.6%) |
| 5 to 9 Year Old | 363 (79.6%) | 93 (20.4%) |
| 10 to 14 Year Olds | 470 (80.9%) | 111 (19.1%) |
| 15 to 17 Year Olds | 175 (69.7%) | 76 (30.3%) |
| 18 to 19 Year Olds | 99 (83.2%) | 20 (16.8%) |
| 20 to 24 Year Olds | 290 (91.8%) | 26 (8.2%) |
| 25 to 34 Year Olds | 37 (84.1%) | 7 (15.9%) |
| 35 Years and over | 119 (63.0%) | 70 (37.0%) |
| Total | 1,563 (75.8%) | 499 (24.2%) |
Educational Attainment by Field of Study in Rio del Mar
Business (580 | 13.4%), science & technology (520 | 12.0%), bio, nature & agricultural (468 | 10.8%), visual & performing arts (440 | 10.2%), and social sciences (360 | 8.3%) are the most common fields of study among 4,316 individuals in Rio del Mar who have obtained a bachelor's degree or higher.
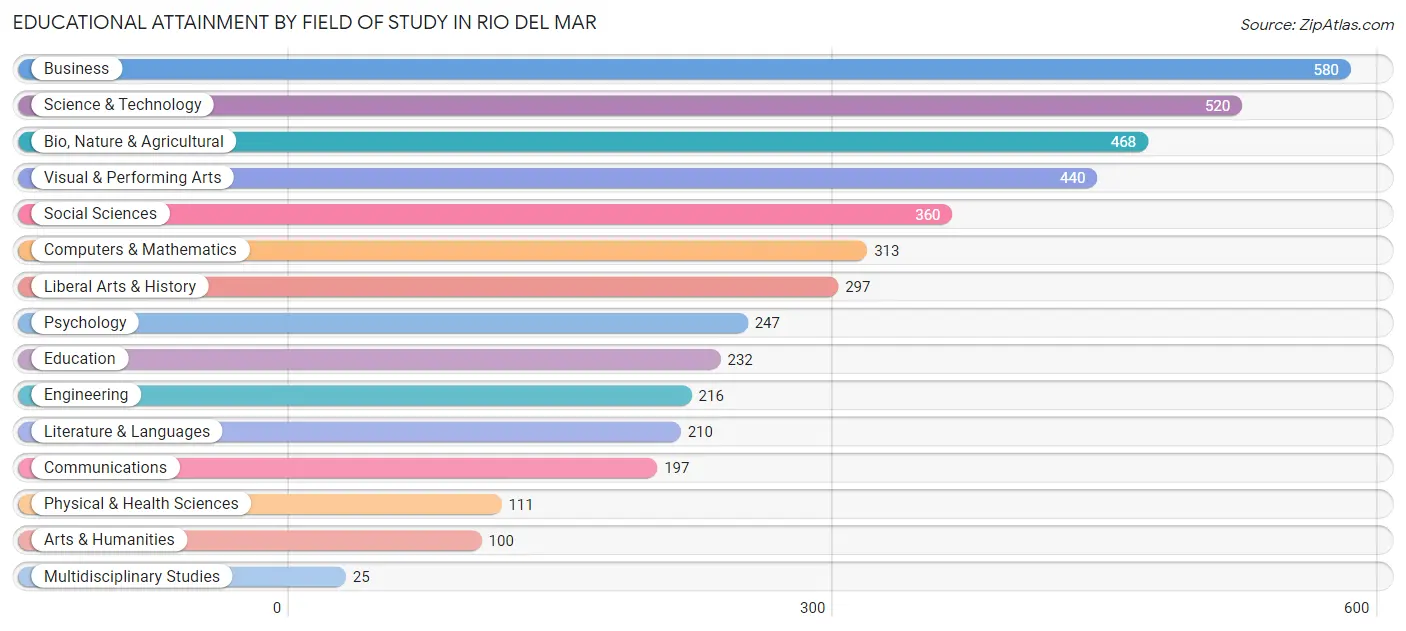
| Field of Study | # Graduates | % Graduates |
| Computers & Mathematics | 313 | 7.2% |
| Bio, Nature & Agricultural | 468 | 10.8% |
| Physical & Health Sciences | 111 | 2.6% |
| Psychology | 247 | 5.7% |
| Social Sciences | 360 | 8.3% |
| Engineering | 216 | 5.0% |
| Multidisciplinary Studies | 25 | 0.6% |
| Science & Technology | 520 | 12.0% |
| Business | 580 | 13.4% |
| Education | 232 | 5.4% |
| Literature & Languages | 210 | 4.9% |
| Liberal Arts & History | 297 | 6.9% |
| Visual & Performing Arts | 440 | 10.2% |
| Communications | 197 | 4.6% |
| Arts & Humanities | 100 | 2.3% |
| Total | 4,316 | 100.0% |
Transportation & Commute in Rio del Mar
Vehicle Availability by Sex in Rio del Mar
The most prevalent vehicle ownership categories in Rio del Mar are males with 2 vehicles (907, accounting for 36.1%) and females with 2 vehicles (701, making up 44.6%).
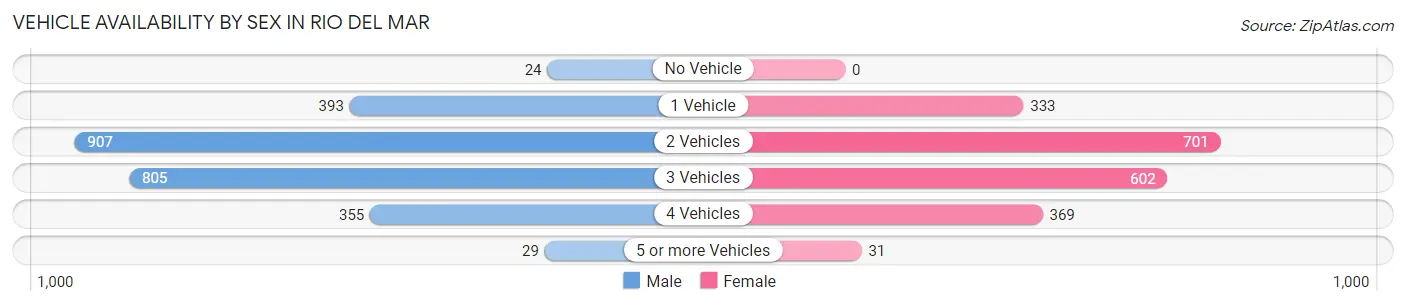
| Vehicles Available | Male | Female |
| No Vehicle | 24 (1.0%) | 0 (0.0%) |
| 1 Vehicle | 393 (15.6%) | 333 (16.4%) |
| 2 Vehicles | 907 (36.1%) | 701 (34.4%) |
| 3 Vehicles | 805 (32.0%) | 602 (29.6%) |
| 4 Vehicles | 355 (14.1%) | 369 (18.1%) |
| 5 or more Vehicles | 29 (1.1%) | 31 (1.5%) |
| Total | 2,513 (100.0%) | 2,036 (100.0%) |
Commute Time in Rio del Mar
The most frequently occuring commute durations in Rio del Mar are 20 to 24 minutes (611 commuters, 18.9%), 15 to 19 minutes (574 commuters, 17.7%), and 45 to 59 minutes (339 commuters, 10.5%).
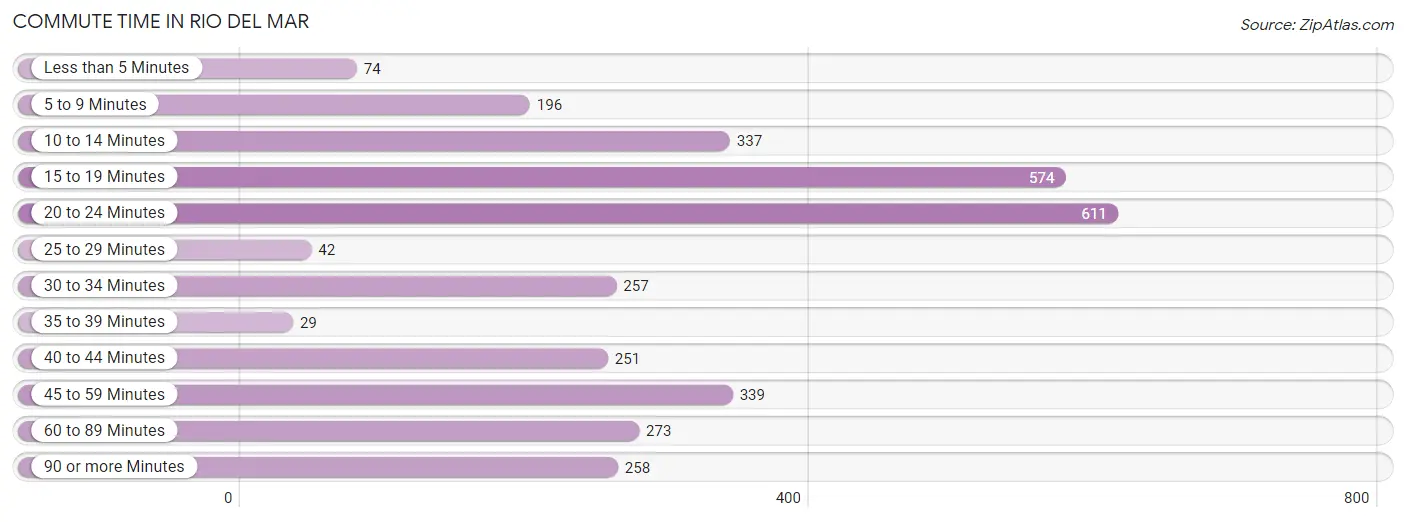
| Commute Time | # Commuters | % Commuters |
| Less than 5 Minutes | 74 | 2.3% |
| 5 to 9 Minutes | 196 | 6.0% |
| 10 to 14 Minutes | 337 | 10.4% |
| 15 to 19 Minutes | 574 | 17.7% |
| 20 to 24 Minutes | 611 | 18.9% |
| 25 to 29 Minutes | 42 | 1.3% |
| 30 to 34 Minutes | 257 | 7.9% |
| 35 to 39 Minutes | 29 | 0.9% |
| 40 to 44 Minutes | 251 | 7.7% |
| 45 to 59 Minutes | 339 | 10.5% |
| 60 to 89 Minutes | 273 | 8.4% |
| 90 or more Minutes | 258 | 8.0% |
Commute Time by Sex in Rio del Mar
The most common commute times in Rio del Mar are 20 to 24 minutes (280 commuters, 16.1%) for males and 15 to 19 minutes (353 commuters, 23.5%) for females.
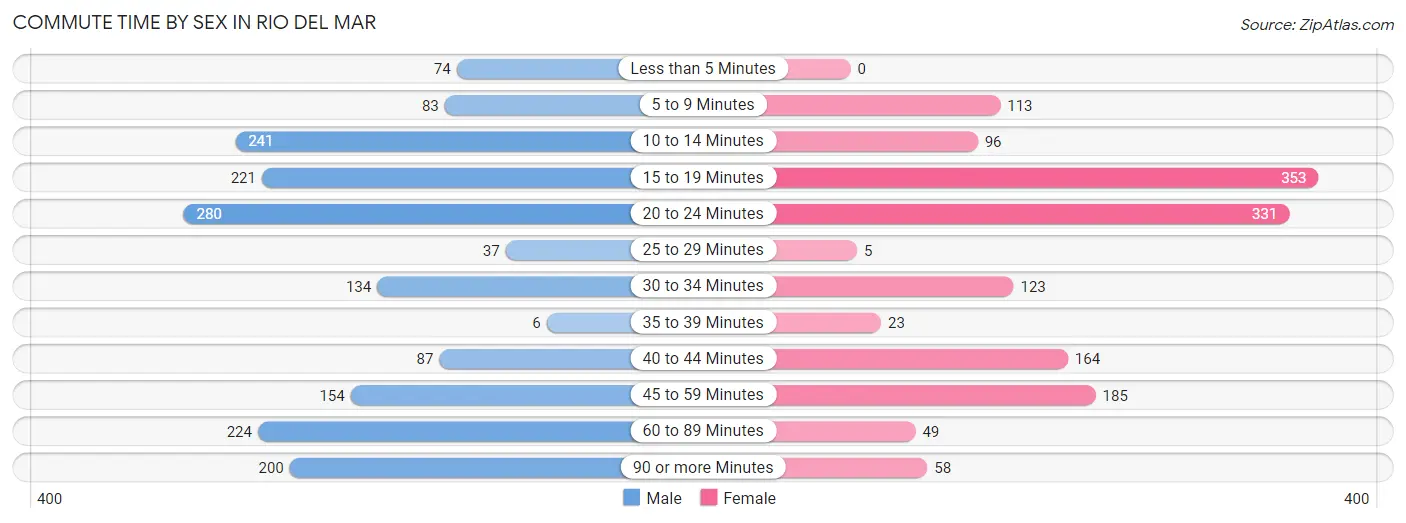
| Commute Time | Male | Female |
| Less than 5 Minutes | 74 (4.3%) | 0 (0.0%) |
| 5 to 9 Minutes | 83 (4.8%) | 113 (7.5%) |
| 10 to 14 Minutes | 241 (13.8%) | 96 (6.4%) |
| 15 to 19 Minutes | 221 (12.7%) | 353 (23.5%) |
| 20 to 24 Minutes | 280 (16.1%) | 331 (22.1%) |
| 25 to 29 Minutes | 37 (2.1%) | 5 (0.3%) |
| 30 to 34 Minutes | 134 (7.7%) | 123 (8.2%) |
| 35 to 39 Minutes | 6 (0.3%) | 23 (1.5%) |
| 40 to 44 Minutes | 87 (5.0%) | 164 (10.9%) |
| 45 to 59 Minutes | 154 (8.8%) | 185 (12.3%) |
| 60 to 89 Minutes | 224 (12.9%) | 49 (3.3%) |
| 90 or more Minutes | 200 (11.5%) | 58 (3.9%) |
Time of Departure to Work by Sex in Rio del Mar
The most frequent times of departure to work in Rio del Mar are 8:00 AM to 8:29 AM (307, 17.6%) for males and 8:00 AM to 8:29 AM (262, 17.5%) for females.
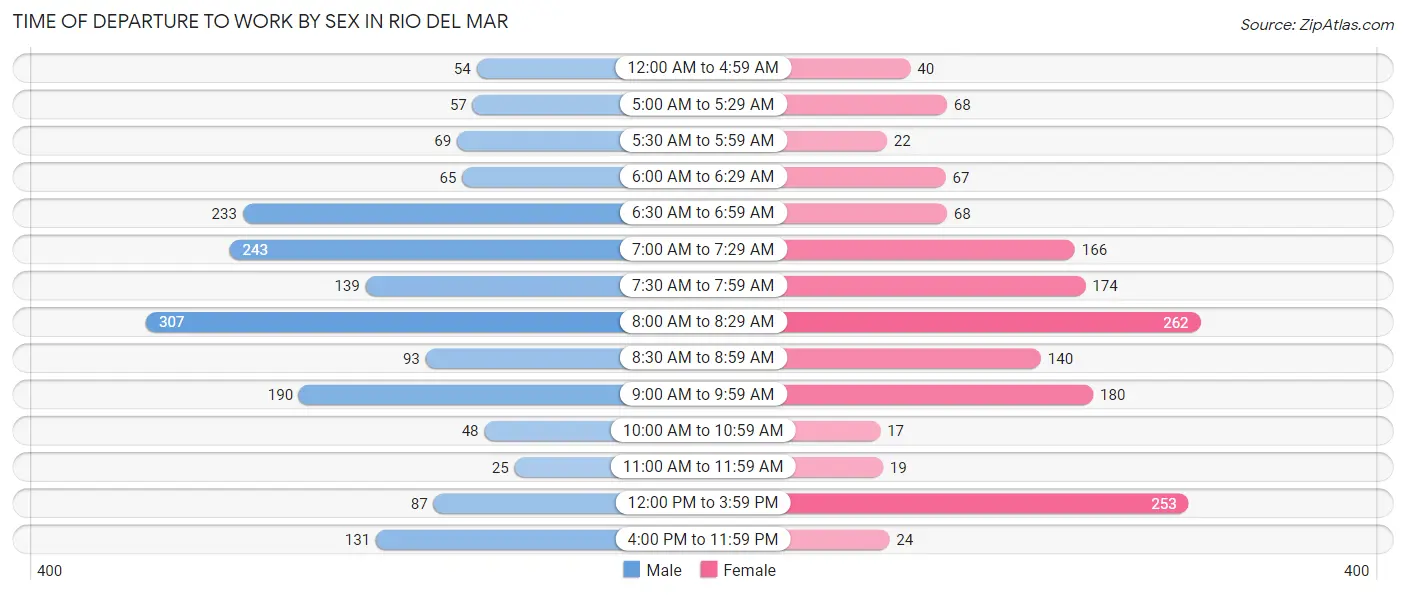
| Time of Departure | Male | Female |
| 12:00 AM to 4:59 AM | 54 (3.1%) | 40 (2.7%) |
| 5:00 AM to 5:29 AM | 57 (3.3%) | 68 (4.5%) |
| 5:30 AM to 5:59 AM | 69 (4.0%) | 22 (1.5%) |
| 6:00 AM to 6:29 AM | 65 (3.7%) | 67 (4.5%) |
| 6:30 AM to 6:59 AM | 233 (13.4%) | 68 (4.5%) |
| 7:00 AM to 7:29 AM | 243 (14.0%) | 166 (11.1%) |
| 7:30 AM to 7:59 AM | 139 (8.0%) | 174 (11.6%) |
| 8:00 AM to 8:29 AM | 307 (17.6%) | 262 (17.5%) |
| 8:30 AM to 8:59 AM | 93 (5.3%) | 140 (9.3%) |
| 9:00 AM to 9:59 AM | 190 (10.9%) | 180 (12.0%) |
| 10:00 AM to 10:59 AM | 48 (2.8%) | 17 (1.1%) |
| 11:00 AM to 11:59 AM | 25 (1.4%) | 19 (1.3%) |
| 12:00 PM to 3:59 PM | 87 (5.0%) | 253 (16.9%) |
| 4:00 PM to 11:59 PM | 131 (7.5%) | 24 (1.6%) |
| Total | 1,741 (100.0%) | 1,500 (100.0%) |
Housing Occupancy in Rio del Mar
Occupancy by Ownership in Rio del Mar
Of the total 3,804 dwellings in Rio del Mar, owner-occupied units account for 3,009 (79.1%), while renter-occupied units make up 795 (20.9%).
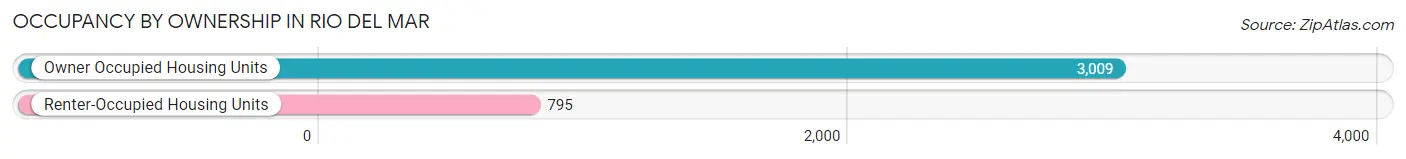
| Occupancy | # Housing Units | % Housing Units |
| Owner Occupied Housing Units | 3,009 | 79.1% |
| Renter-Occupied Housing Units | 795 | 20.9% |
| Total Occupied Housing Units | 3,804 | 100.0% |
Occupancy by Household Size in Rio del Mar
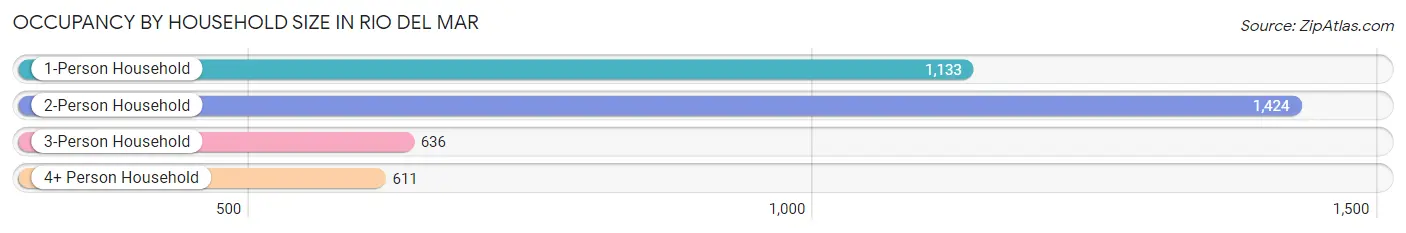
| Household Size | # Housing Units | % Housing Units |
| 1-Person Household | 1,133 | 29.8% |
| 2-Person Household | 1,424 | 37.4% |
| 3-Person Household | 636 | 16.7% |
| 4+ Person Household | 611 | 16.1% |
| Total Housing Units | 3,804 | 100.0% |
Occupancy by Ownership by Household Size in Rio del Mar
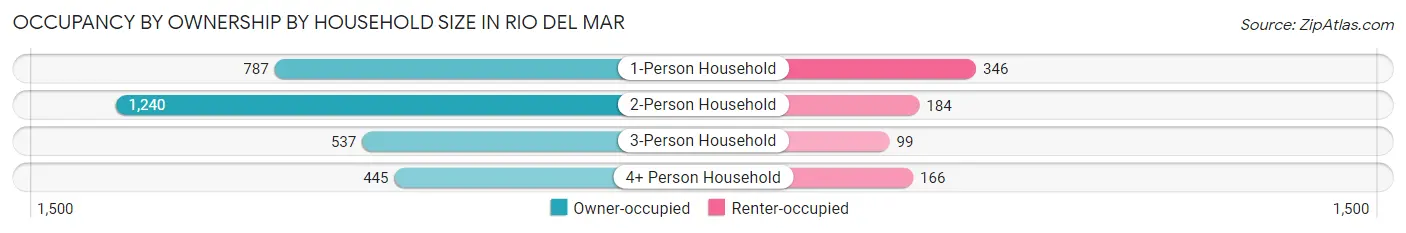
| Household Size | Owner-occupied | Renter-occupied |
| 1-Person Household | 787 (69.5%) | 346 (30.5%) |
| 2-Person Household | 1,240 (87.1%) | 184 (12.9%) |
| 3-Person Household | 537 (84.4%) | 99 (15.6%) |
| 4+ Person Household | 445 (72.8%) | 166 (27.2%) |
| Total Housing Units | 3,009 (79.1%) | 795 (20.9%) |
Occupancy by Educational Attainment in Rio del Mar
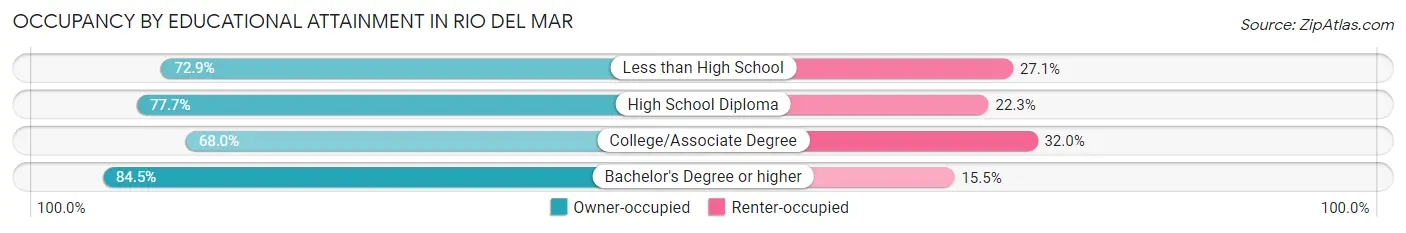
| Household Size | Owner-occupied | Renter-occupied |
| Less than High School | 43 (72.9%) | 16 (27.1%) |
| High School Diploma | 136 (77.7%) | 39 (22.3%) |
| College/Associate Degree | 768 (68.0%) | 361 (32.0%) |
| Bachelor's Degree or higher | 2,062 (84.5%) | 379 (15.5%) |
Occupancy by Age of Householder in Rio del Mar
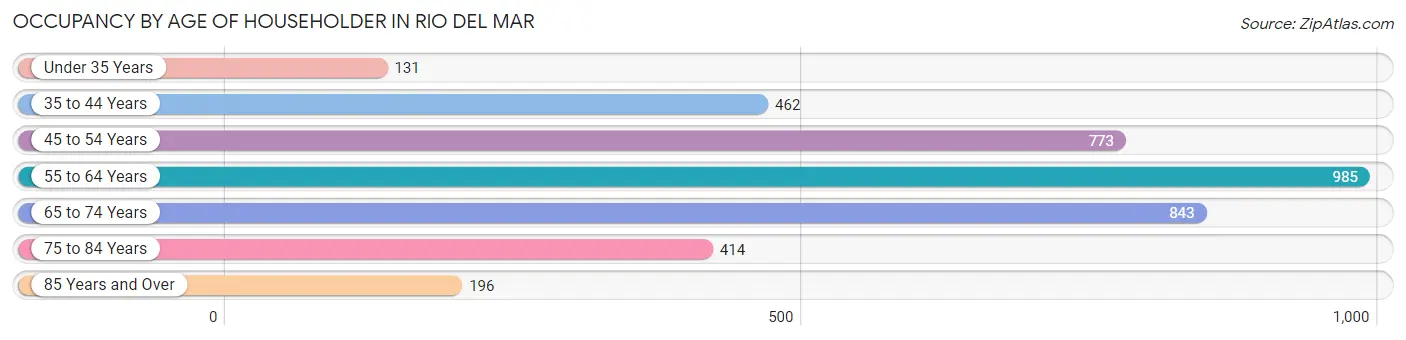
| Age Bracket | # Households | % Households |
| Under 35 Years | 131 | 3.4% |
| 35 to 44 Years | 462 | 12.1% |
| 45 to 54 Years | 773 | 20.3% |
| 55 to 64 Years | 985 | 25.9% |
| 65 to 74 Years | 843 | 22.2% |
| 75 to 84 Years | 414 | 10.9% |
| 85 Years and Over | 196 | 5.1% |
| Total | 3,804 | 100.0% |
Housing Finances in Rio del Mar
Median Income by Occupancy in Rio del Mar
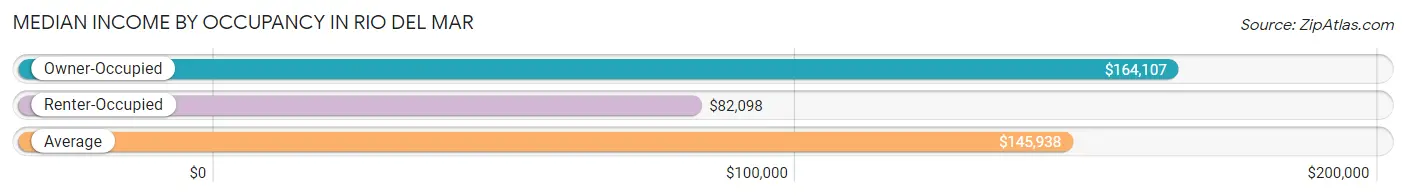
| Occupancy Type | # Households | Median Income |
| Owner-Occupied | 3,009 (79.1%) | $164,107 |
| Renter-Occupied | 795 (20.9%) | $82,098 |
| Average | 3,804 (100.0%) | $145,938 |
Occupancy by Householder Income Bracket in Rio del Mar
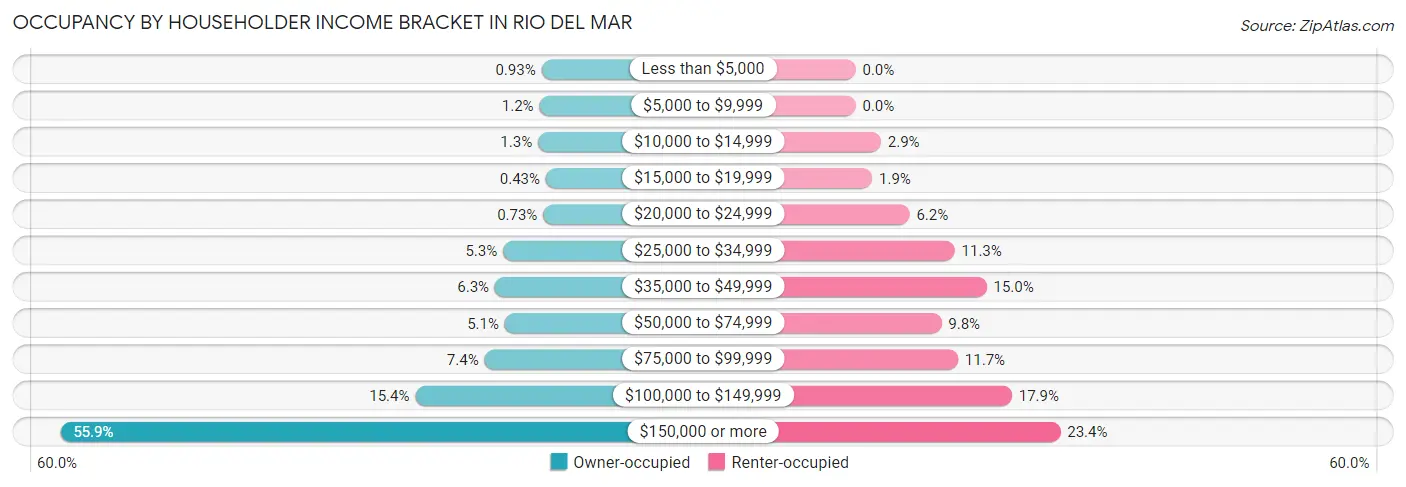
| Income Bracket | Owner-occupied | Renter-occupied |
| Less than $5,000 | 28 (0.9%) | 0 (0.0%) |
| $5,000 to $9,999 | 35 (1.2%) | 0 (0.0%) |
| $10,000 to $14,999 | 40 (1.3%) | 23 (2.9%) |
| $15,000 to $19,999 | 13 (0.4%) | 15 (1.9%) |
| $20,000 to $24,999 | 22 (0.7%) | 49 (6.2%) |
| $25,000 to $34,999 | 160 (5.3%) | 90 (11.3%) |
| $35,000 to $49,999 | 188 (6.2%) | 119 (15.0%) |
| $50,000 to $74,999 | 154 (5.1%) | 78 (9.8%) |
| $75,000 to $99,999 | 224 (7.4%) | 93 (11.7%) |
| $100,000 to $149,999 | 462 (15.3%) | 142 (17.9%) |
| $150,000 or more | 1,683 (55.9%) | 186 (23.4%) |
| Total | 3,009 (100.0%) | 795 (100.0%) |
Monthly Housing Cost Tiers in Rio del Mar
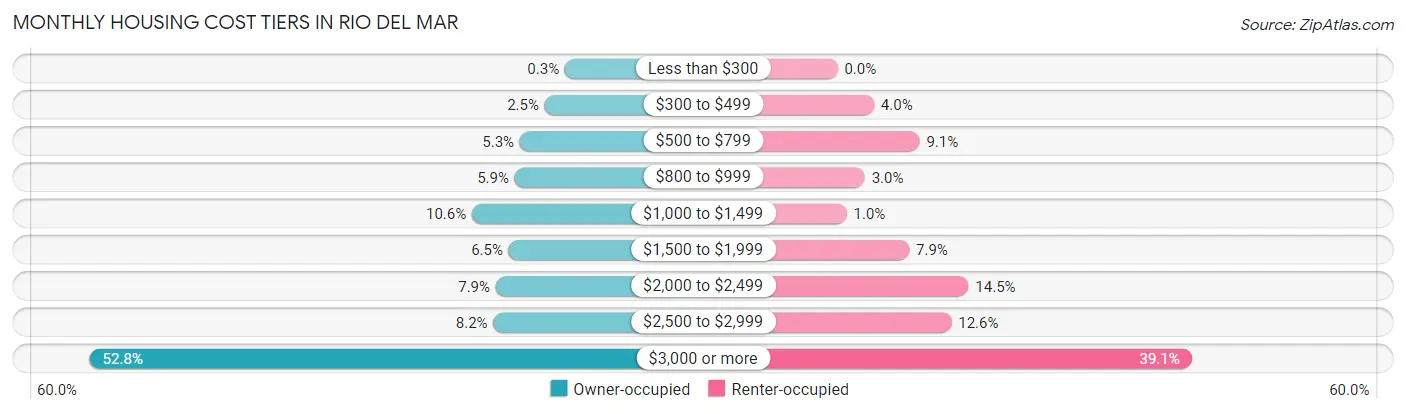
| Monthly Cost | Owner-occupied | Renter-occupied |
| Less than $300 | 9 (0.3%) | 0 (0.0%) |
| $300 to $499 | 76 (2.5%) | 32 (4.0%) |
| $500 to $799 | 159 (5.3%) | 72 (9.1%) |
| $800 to $999 | 176 (5.9%) | 24 (3.0%) |
| $1,000 to $1,499 | 318 (10.6%) | 8 (1.0%) |
| $1,500 to $1,999 | 196 (6.5%) | 63 (7.9%) |
| $2,000 to $2,499 | 239 (7.9%) | 115 (14.5%) |
| $2,500 to $2,999 | 247 (8.2%) | 100 (12.6%) |
| $3,000 or more | 1,589 (52.8%) | 311 (39.1%) |
| Total | 3,009 (100.0%) | 795 (100.0%) |
Physical Housing Characteristics in Rio del Mar
Housing Structures in Rio del Mar
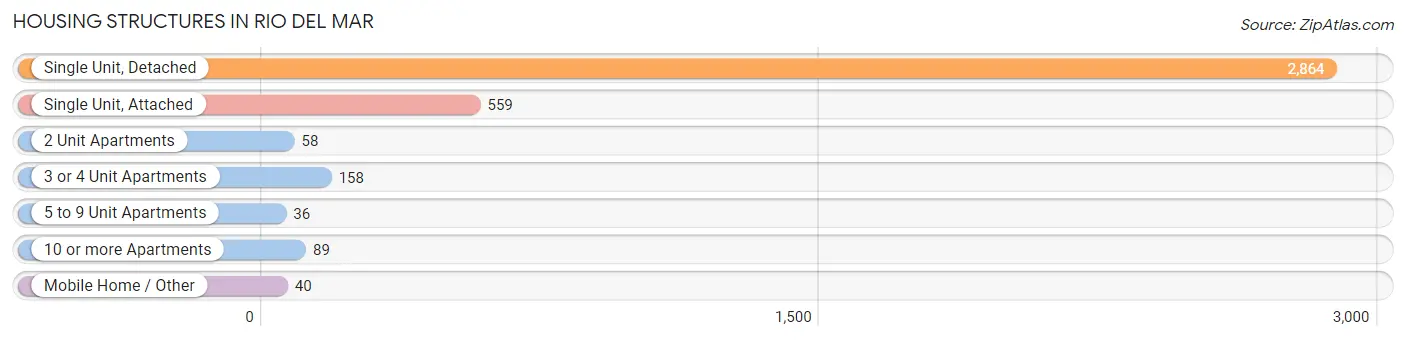
| Structure Type | # Housing Units | % Housing Units |
| Single Unit, Detached | 2,864 | 75.3% |
| Single Unit, Attached | 559 | 14.7% |
| 2 Unit Apartments | 58 | 1.5% |
| 3 or 4 Unit Apartments | 158 | 4.2% |
| 5 to 9 Unit Apartments | 36 | 0.9% |
| 10 or more Apartments | 89 | 2.3% |
| Mobile Home / Other | 40 | 1.1% |
| Total | 3,804 | 100.0% |
Housing Structures by Occupancy in Rio del Mar
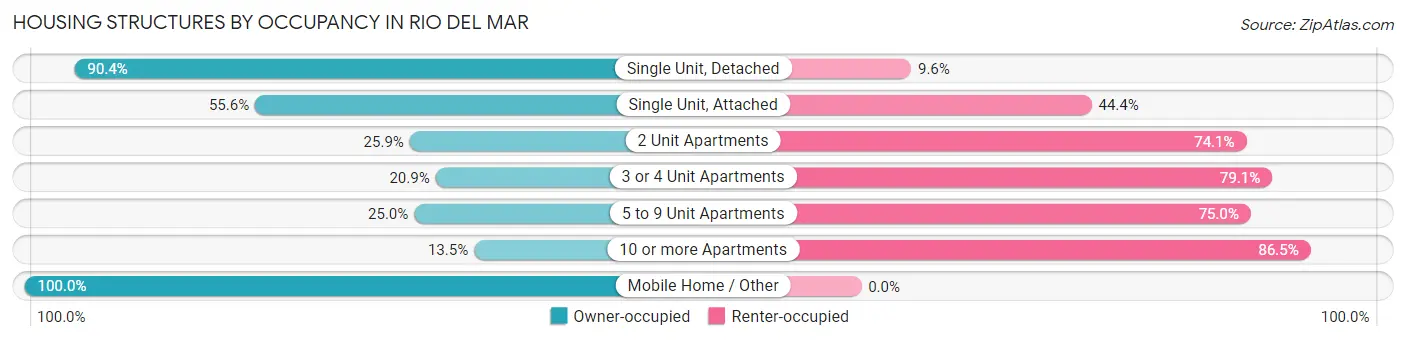
| Structure Type | Owner-occupied | Renter-occupied |
| Single Unit, Detached | 2,589 (90.4%) | 275 (9.6%) |
| Single Unit, Attached | 311 (55.6%) | 248 (44.4%) |
| 2 Unit Apartments | 15 (25.9%) | 43 (74.1%) |
| 3 or 4 Unit Apartments | 33 (20.9%) | 125 (79.1%) |
| 5 to 9 Unit Apartments | 9 (25.0%) | 27 (75.0%) |
| 10 or more Apartments | 12 (13.5%) | 77 (86.5%) |
| Mobile Home / Other | 40 (100.0%) | 0 (0.0%) |
| Total | 3,009 (79.1%) | 795 (20.9%) |
Housing Structures by Number of Rooms in Rio del Mar
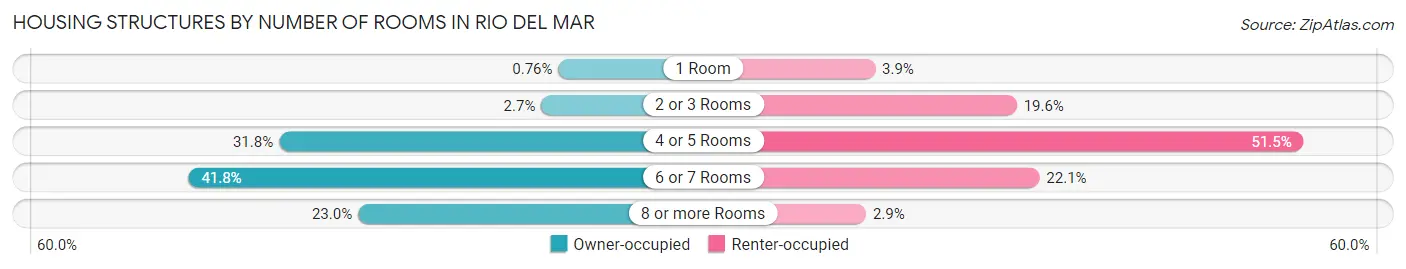
| Number of Rooms | Owner-occupied | Renter-occupied |
| 1 Room | 23 (0.8%) | 31 (3.9%) |
| 2 or 3 Rooms | 80 (2.7%) | 156 (19.6%) |
| 4 or 5 Rooms | 956 (31.8%) | 409 (51.4%) |
| 6 or 7 Rooms | 1,258 (41.8%) | 176 (22.1%) |
| 8 or more Rooms | 692 (23.0%) | 23 (2.9%) |
| Total | 3,009 (100.0%) | 795 (100.0%) |
Housing Structure by Heating Type in Rio del Mar
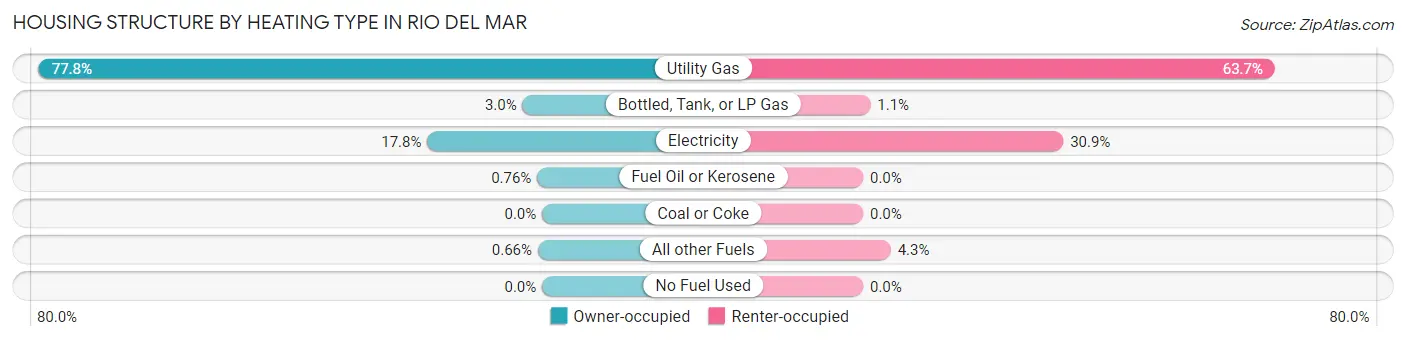
| Heating Type | Owner-occupied | Renter-occupied |
| Utility Gas | 2,341 (77.8%) | 506 (63.6%) |
| Bottled, Tank, or LP Gas | 91 (3.0%) | 9 (1.1%) |
| Electricity | 534 (17.7%) | 246 (30.9%) |
| Fuel Oil or Kerosene | 23 (0.8%) | 0 (0.0%) |
| Coal or Coke | 0 (0.0%) | 0 (0.0%) |
| All other Fuels | 20 (0.7%) | 34 (4.3%) |
| No Fuel Used | 0 (0.0%) | 0 (0.0%) |
| Total | 3,009 (100.0%) | 795 (100.0%) |
Household Vehicle Usage in Rio del Mar
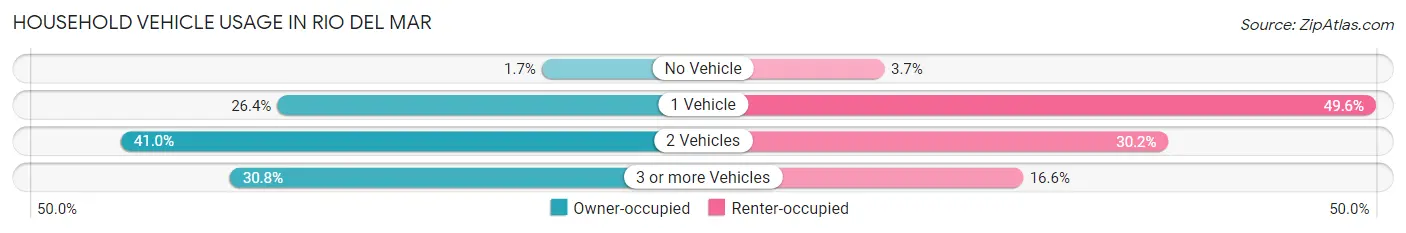
| Vehicles per Household | Owner-occupied | Renter-occupied |
| No Vehicle | 52 (1.7%) | 29 (3.6%) |
| 1 Vehicle | 795 (26.4%) | 394 (49.6%) |
| 2 Vehicles | 1,234 (41.0%) | 240 (30.2%) |
| 3 or more Vehicles | 928 (30.8%) | 132 (16.6%) |
| Total | 3,009 (100.0%) | 795 (100.0%) |
Real Estate & Mortgages in Rio del Mar
Real Estate and Mortgage Overview in Rio del Mar
| Characteristic | Without Mortgage | With Mortgage |
| Housing Units | 823 | 2,186 |
| Median Property Value | $1,191,800 | $1,219,400 |
| Median Household Income | $97,326 | $1,384 |
| Monthly Housing Costs | $1,033 | $1,573 |
| Real Estate Taxes | $6,882 | $0 |
Property Value by Mortgage Status in Rio del Mar
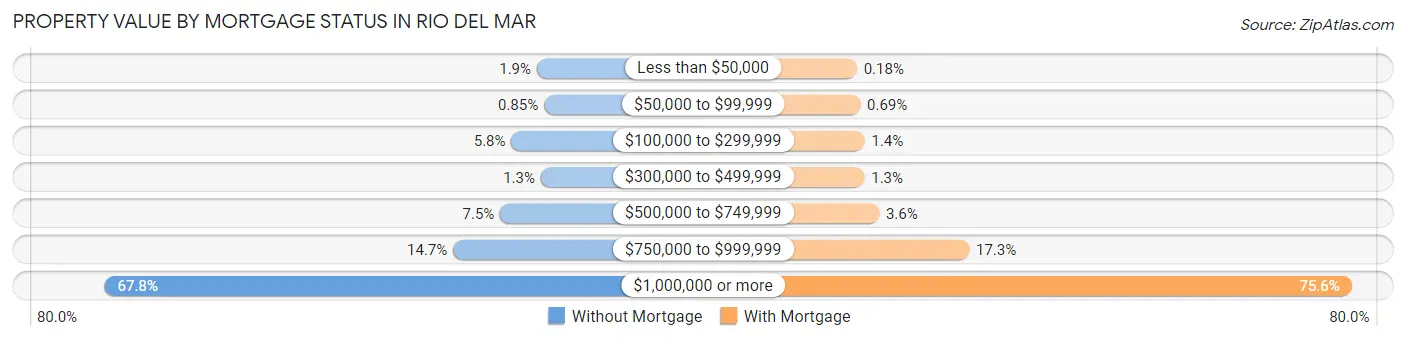
| Property Value | Without Mortgage | With Mortgage |
| Less than $50,000 | 16 (1.9%) | 4 (0.2%) |
| $50,000 to $99,999 | 7 (0.9%) | 15 (0.7%) |
| $100,000 to $299,999 | 48 (5.8%) | 30 (1.4%) |
| $300,000 to $499,999 | 11 (1.3%) | 29 (1.3%) |
| $500,000 to $749,999 | 62 (7.5%) | 78 (3.6%) |
| $750,000 to $999,999 | 121 (14.7%) | 378 (17.3%) |
| $1,000,000 or more | 558 (67.8%) | 1,652 (75.6%) |
| Total | 823 (100.0%) | 2,186 (100.0%) |
Household Income by Mortgage Status in Rio del Mar
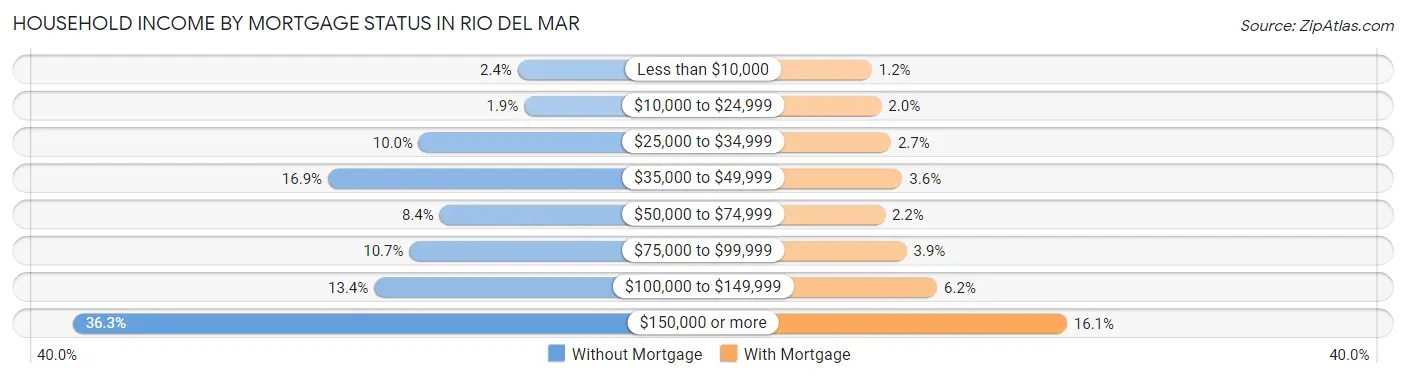
| Household Income | Without Mortgage | With Mortgage |
| Less than $10,000 | 20 (2.4%) | 27 (1.2%) |
| $10,000 to $24,999 | 16 (1.9%) | 43 (2.0%) |
| $25,000 to $34,999 | 82 (10.0%) | 59 (2.7%) |
| $35,000 to $49,999 | 139 (16.9%) | 78 (3.6%) |
| $50,000 to $74,999 | 69 (8.4%) | 49 (2.2%) |
| $75,000 to $99,999 | 88 (10.7%) | 85 (3.9%) |
| $100,000 to $149,999 | 110 (13.4%) | 136 (6.2%) |
| $150,000 or more | 299 (36.3%) | 352 (16.1%) |
| Total | 823 (100.0%) | 2,186 (100.0%) |
Property Value to Household Income Ratio in Rio del Mar
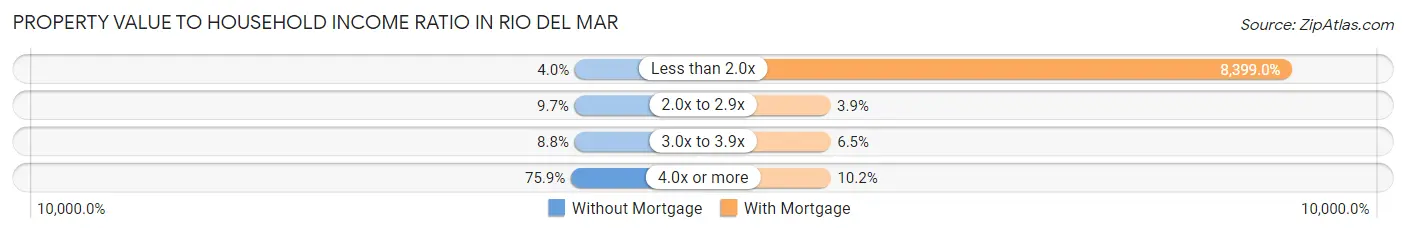
| Value-to-Income Ratio | Without Mortgage | With Mortgage |
| Less than 2.0x | 33 (4.0%) | 183,601 (8,399.0%) |
| 2.0x to 2.9x | 80 (9.7%) | 86 (3.9%) |
| 3.0x to 3.9x | 72 (8.7%) | 142 (6.5%) |
| 4.0x or more | 625 (75.9%) | 222 (10.2%) |
| Total | 823 (100.0%) | 2,186 (100.0%) |
Real Estate Taxes by Mortgage Status in Rio del Mar
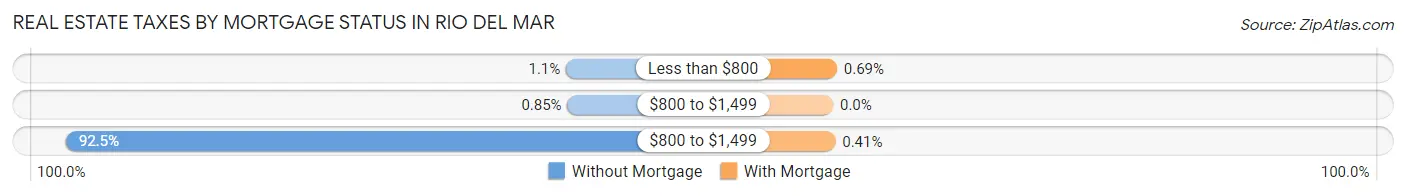
| Property Taxes | Without Mortgage | With Mortgage |
| Less than $800 | 9 (1.1%) | 15 (0.7%) |
| $800 to $1,499 | 7 (0.9%) | 0 (0.0%) |
| $800 to $1,499 | 761 (92.5%) | 9 (0.4%) |
| Total | 823 (100.0%) | 2,186 (100.0%) |
Health & Disability in Rio del Mar
Health Insurance Coverage by Age in Rio del Mar
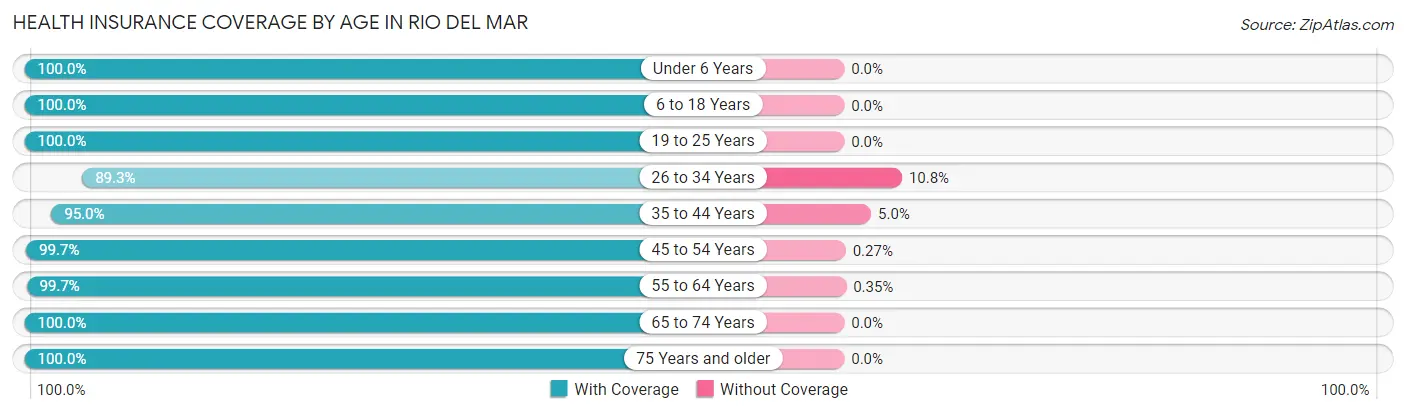
| Age Bracket | With Coverage | Without Coverage |
| Under 6 Years | 331 (100.0%) | 0 (0.0%) |
| 6 to 18 Years | 1,416 (100.0%) | 0 (0.0%) |
| 19 to 25 Years | 647 (100.0%) | 0 (0.0%) |
| 26 to 34 Years | 357 (89.2%) | 43 (10.7%) |
| 35 to 44 Years | 913 (95.0%) | 48 (5.0%) |
| 45 to 54 Years | 1,465 (99.7%) | 4 (0.3%) |
| 55 to 64 Years | 1,694 (99.7%) | 6 (0.4%) |
| 65 to 74 Years | 1,152 (100.0%) | 0 (0.0%) |
| 75 Years and older | 931 (100.0%) | 0 (0.0%) |
| Total | 8,906 (98.9%) | 101 (1.1%) |
Health Insurance Coverage by Citizenship Status in Rio del Mar
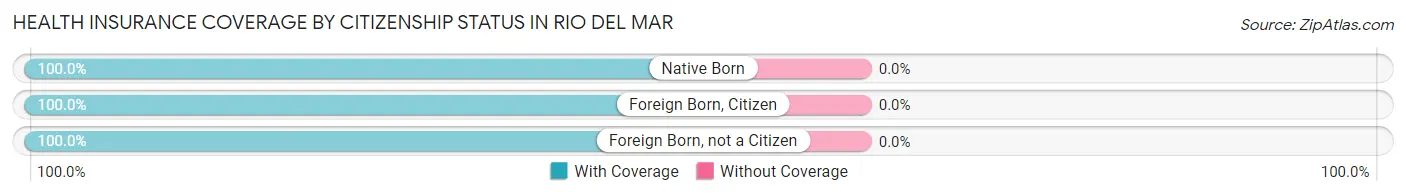
| Citizenship Status | With Coverage | Without Coverage |
| Native Born | 331 (100.0%) | 0 (0.0%) |
| Foreign Born, Citizen | 1,416 (100.0%) | 0 (0.0%) |
| Foreign Born, not a Citizen | 647 (100.0%) | 0 (0.0%) |
Health Insurance Coverage by Household Income in Rio del Mar
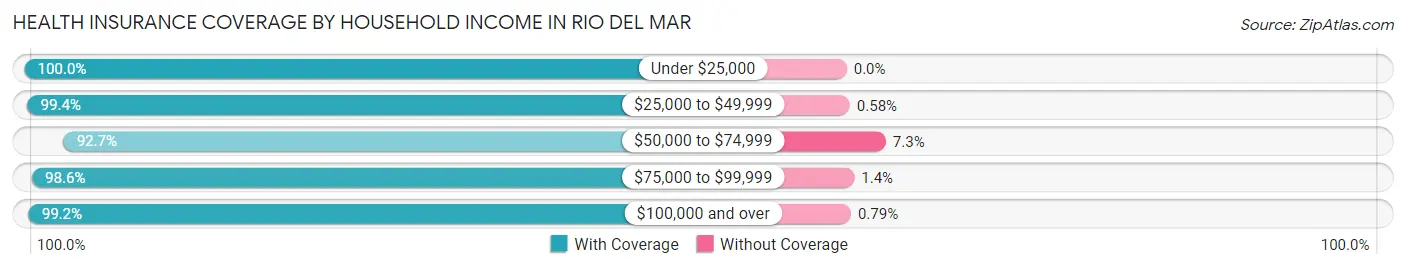
| Household Income | With Coverage | Without Coverage |
| Under $25,000 | 244 (100.0%) | 0 (0.0%) |
| $25,000 to $49,999 | 860 (99.4%) | 5 (0.6%) |
| $50,000 to $74,999 | 417 (92.7%) | 33 (7.3%) |
| $75,000 to $99,999 | 695 (98.6%) | 10 (1.4%) |
| $100,000 and over | 6,676 (99.2%) | 53 (0.8%) |
Public vs Private Health Insurance Coverage by Age in Rio del Mar
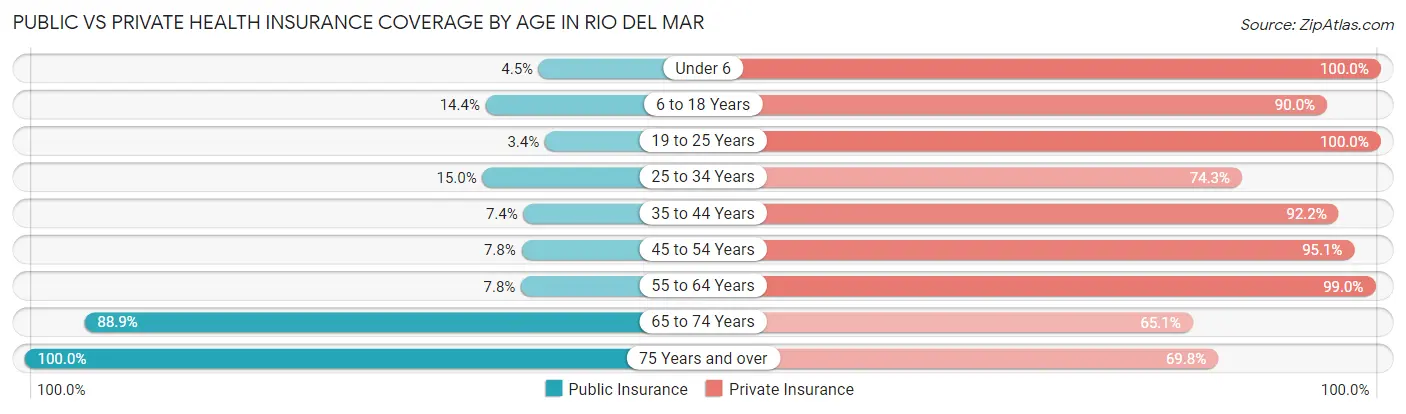
| Age Bracket | Public Insurance | Private Insurance |
| Under 6 | 15 (4.5%) | 331 (100.0%) |
| 6 to 18 Years | 204 (14.4%) | 1,275 (90.0%) |
| 19 to 25 Years | 22 (3.4%) | 647 (100.0%) |
| 25 to 34 Years | 60 (15.0%) | 297 (74.3%) |
| 35 to 44 Years | 71 (7.4%) | 886 (92.2%) |
| 45 to 54 Years | 114 (7.8%) | 1,397 (95.1%) |
| 55 to 64 Years | 133 (7.8%) | 1,683 (99.0%) |
| 65 to 74 Years | 1,024 (88.9%) | 750 (65.1%) |
| 75 Years and over | 931 (100.0%) | 650 (69.8%) |
| Total | 2,574 (28.6%) | 7,916 (87.9%) |
Disability Status by Sex by Age in Rio del Mar
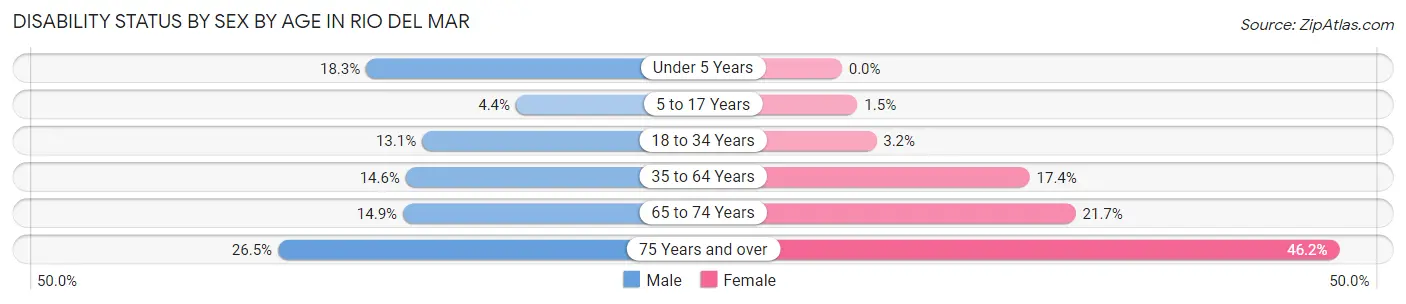
| Age Bracket | Male | Female |
| Under 5 Years | 13 (18.3%) | 0 (0.0%) |
| 5 to 17 Years | 33 (4.4%) | 9 (1.5%) |
| 18 to 34 Years | 82 (13.1%) | 17 (3.2%) |
| 35 to 64 Years | 313 (14.6%) | 347 (17.4%) |
| 65 to 74 Years | 70 (14.9%) | 148 (21.7%) |
| 75 Years and over | 98 (26.5%) | 259 (46.2%) |
Disability Class by Sex by Age in Rio del Mar
Disability Class: Hearing Difficulty
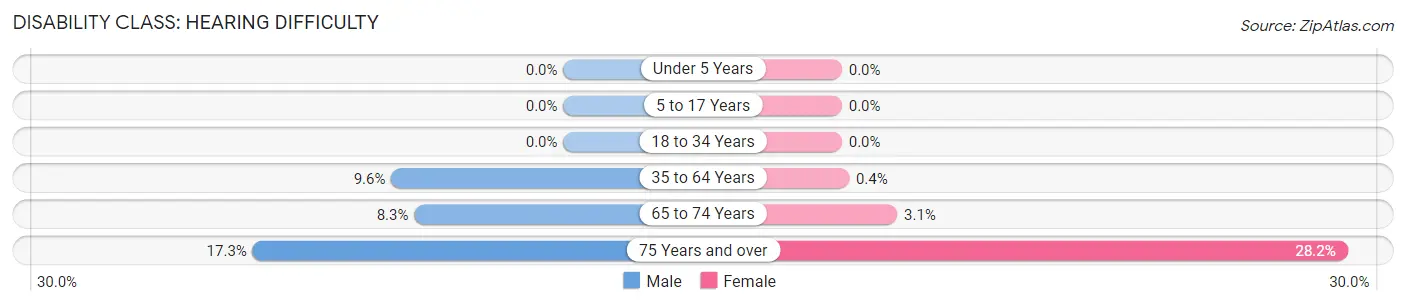
| Age Bracket | Male | Female |
| Under 5 Years | 0 (0.0%) | 0 (0.0%) |
| 5 to 17 Years | 0 (0.0%) | 0 (0.0%) |
| 18 to 34 Years | 0 (0.0%) | 0 (0.0%) |
| 35 to 64 Years | 205 (9.6%) | 8 (0.4%) |
| 65 to 74 Years | 39 (8.3%) | 21 (3.1%) |
| 75 Years and over | 64 (17.3%) | 158 (28.2%) |
Disability Class: Vision Difficulty
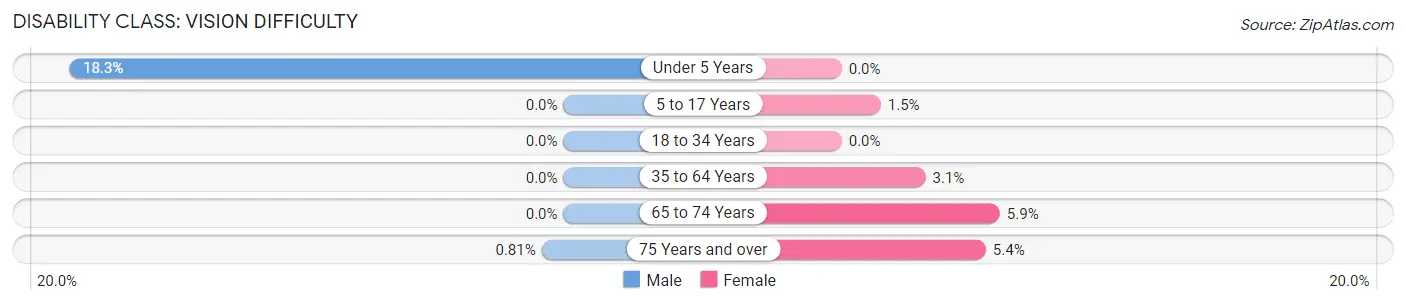
| Age Bracket | Male | Female |
| Under 5 Years | 13 (18.3%) | 0 (0.0%) |
| 5 to 17 Years | 0 (0.0%) | 9 (1.5%) |
| 18 to 34 Years | 0 (0.0%) | 0 (0.0%) |
| 35 to 64 Years | 0 (0.0%) | 62 (3.1%) |
| 65 to 74 Years | 0 (0.0%) | 40 (5.9%) |
| 75 Years and over | 3 (0.8%) | 30 (5.3%) |
Disability Class: Cognitive Difficulty
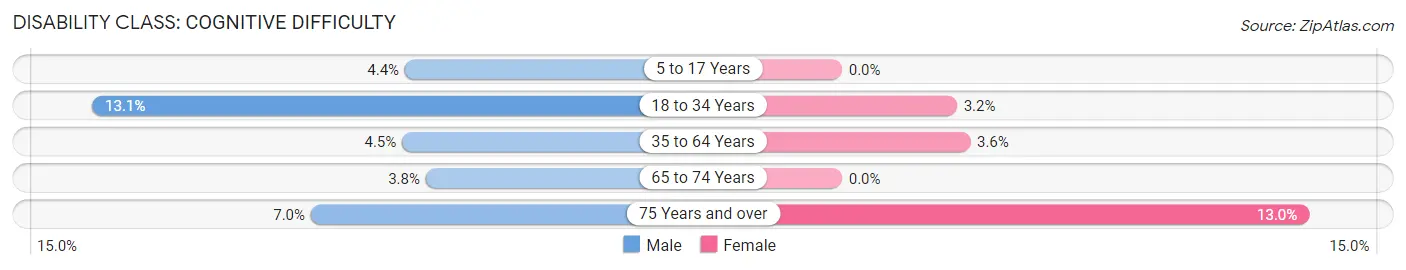
| Age Bracket | Male | Female |
| 5 to 17 Years | 33 (4.4%) | 0 (0.0%) |
| 18 to 34 Years | 82 (13.1%) | 17 (3.2%) |
| 35 to 64 Years | 96 (4.5%) | 71 (3.6%) |
| 65 to 74 Years | 18 (3.8%) | 0 (0.0%) |
| 75 Years and over | 26 (7.0%) | 73 (13.0%) |
Disability Class: Ambulatory Difficulty
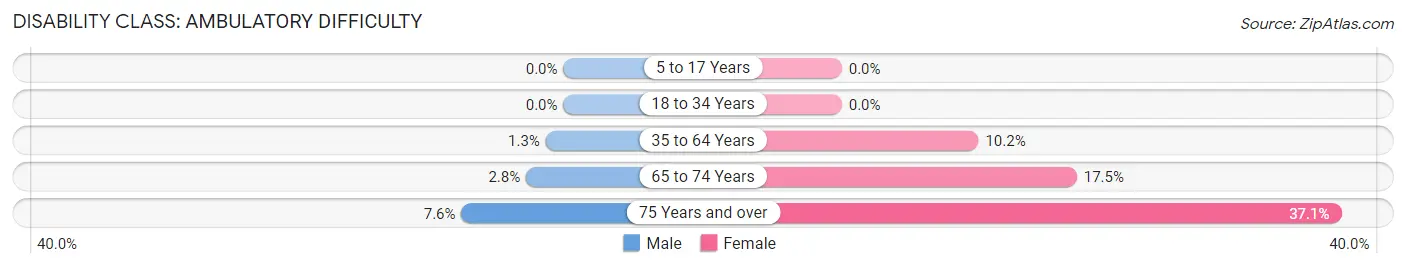
| Age Bracket | Male | Female |
| 5 to 17 Years | 0 (0.0%) | 0 (0.0%) |
| 18 to 34 Years | 0 (0.0%) | 0 (0.0%) |
| 35 to 64 Years | 28 (1.3%) | 202 (10.2%) |
| 65 to 74 Years | 13 (2.8%) | 119 (17.4%) |
| 75 Years and over | 28 (7.6%) | 208 (37.1%) |
Disability Class: Self-Care Difficulty
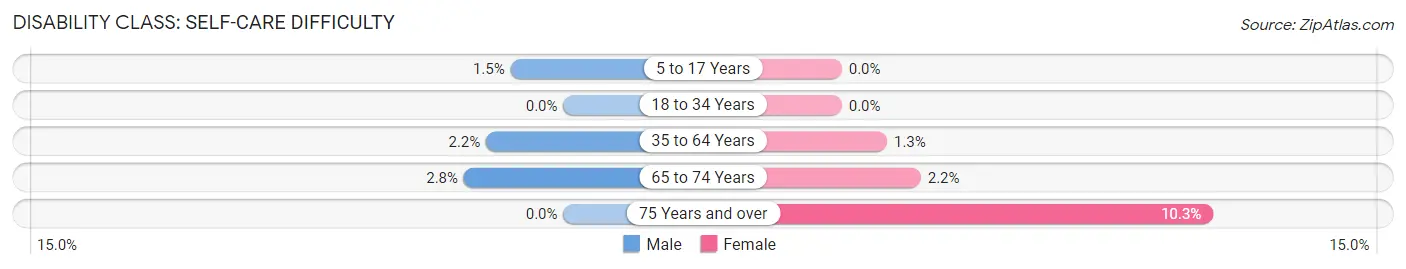
| Age Bracket | Male | Female |
| 5 to 17 Years | 11 (1.5%) | 0 (0.0%) |
| 18 to 34 Years | 0 (0.0%) | 0 (0.0%) |
| 35 to 64 Years | 46 (2.1%) | 25 (1.3%) |
| 65 to 74 Years | 13 (2.8%) | 15 (2.2%) |
| 75 Years and over | 0 (0.0%) | 58 (10.3%) |
Technology Access in Rio del Mar
Computing Device Access in Rio del Mar
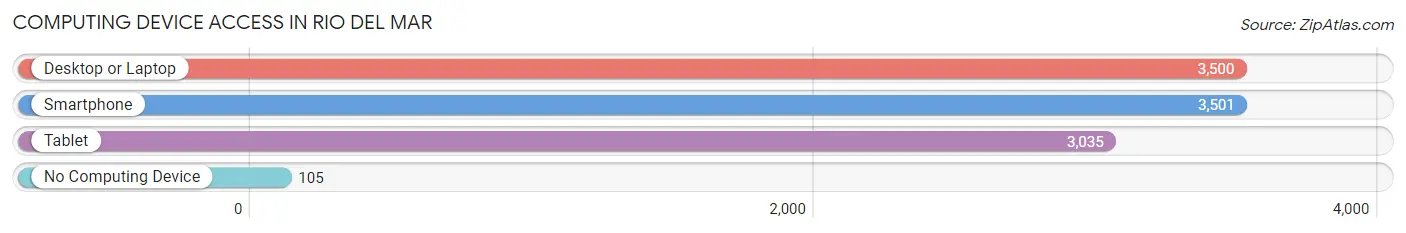
| Device Type | # Households | % Households |
| Desktop or Laptop | 3,500 | 92.0% |
| Smartphone | 3,501 | 92.0% |
| Tablet | 3,035 | 79.8% |
| No Computing Device | 105 | 2.8% |
| Total | 3,804 | 100.0% |
Internet Access in Rio del Mar
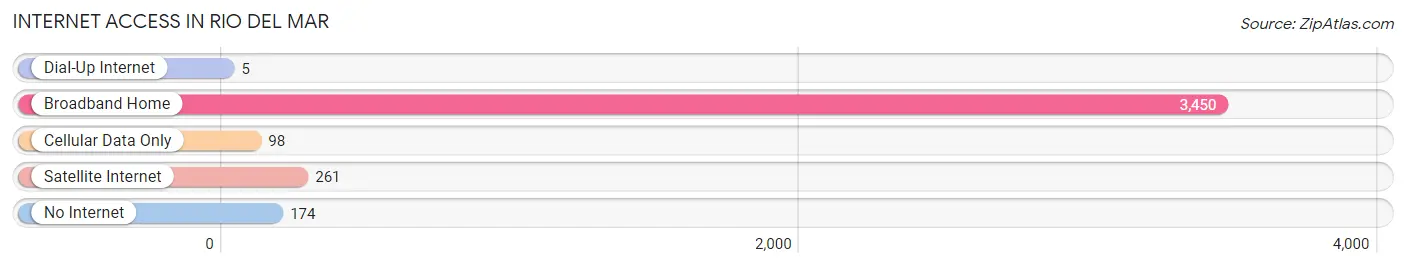
| Internet Type | # Households | % Households |
| Dial-Up Internet | 5 | 0.1% |
| Broadband Home | 3,450 | 90.7% |
| Cellular Data Only | 98 | 2.6% |
| Satellite Internet | 261 | 6.9% |
| No Internet | 174 | 4.6% |
| Total | 3,804 | 100.0% |
Rio del Mar Summary
Rio Del Mar is a census-designated place located in Santa Cruz County, California. It is situated on the Monterey Bay, just south of Aptos and north of La Selva Beach. The population was 5,298 at the 2010 census.
History
Rio Del Mar was originally known as Aptos Beach, and was part of the Rancho Aptos land grant. The area was first settled in the late 1800s by Portuguese immigrants who were drawn to the area by the abundance of fish in the Monterey Bay. The area was renamed Rio Del Mar in the early 1900s, and the name is derived from the Spanish words for “river of the sea.”
In the early 1900s, the area was a popular vacation destination for wealthy San Franciscans. The area was home to several resorts, including the Rio Del Mar Hotel, which was built in 1906. The hotel was destroyed by fire in the 1920s, but the area remained a popular destination for tourists.
In the 1950s, the area began to experience rapid growth as the population of Santa Cruz County increased. The area was annexed by the City of Aptos in 1959, and the population continued to grow throughout the 1960s and 1970s.
Geography
Rio Del Mar is located at 36°58'25"N 121°55'17"W (36.973611, -121.921389). According to the United States Census Bureau, the CDP has a total area of 4.2 square miles (10.9 km2), of which 4.1 square miles (10.6 km2) is land and 0.1 square miles (0.3 km2) (2.37%) is water.
Economy
Rio Del Mar is primarily a residential community, and the economy is largely based on tourism and service industries. The area is home to several restaurants, hotels, and retail stores. The area is also home to several technology companies, including the headquarters of the software company Adobe Systems.
Demographics
As of the census of 2000, there were 5,298 people, 2,093 households, and 1,521 families residing in the CDP. The population density was 1,279.3 people per square mile (493.3/km2). There were 2,179 housing units at an average density of 527.3 per square mile (203.5/km2). The racial makeup of the CDP was 87.2% White, 0.7% African American, 0.7% Native American, 5.2% Asian, 0.2% Pacific Islander, 3.2% from other races, and 3.0% from two or more races. Hispanic or Latino of any race were 8.7% of the population.
There were 2,093 households, out of which 33.2% had children under the age of 18 living with them, 57.2% were married couples living together, 9.2% had a female householder with no husband present, and 29.7% were non-families. 22.7% of all households were made up of individuals, and 7.2% had someone living alone who was 65 years of age or older. The average household size was 2.53 and the average family size was 2.98.
In the CDP, the population was spread out, with 24.2% under the age of 18, 6.2% from 18 to 24, 28.2% from 25 to 44, 28.2% from 45 to 64, and 13.2% who were 65 years of age or older. The median age was 40 years. For every 100 females, there were 97.2 males. For every 100 females age 18 and over, there were 94.2 males.
The median income for a household in the CDP was $63,929, and the median income for a family was $72,917. Males had a median income of $50,000 versus $37,500 for females. The per capita income for the CDP was $30,945. About 4.2% of families and 6.2% of the population were below the poverty line, including 7.2% of those under age 18 and 4.2% of those age 65 or over.
Common Questions
What is Per Capita Income in Rio del Mar?
Per Capita income in Rio del Mar is $83,444.
What is the Median Family Income in Rio del Mar?
Median Family Income in Rio del Mar is $183,574.
What is the Median Household income in Rio del Mar?
Median Household Income in Rio del Mar is $145,938.
What is Income or Wage Gap in Rio del Mar?
Income or Wage Gap in Rio del Mar is 50.9%.
Women in Rio del Mar earn 49.1 cents for every dollar earned by a man.
What is Inequality or Gini Index in Rio del Mar?
Inequality or Gini Index in Rio del Mar is 0.47.
What is the Total Population of Rio del Mar?
Total Population of Rio del Mar is 9,007.
What is the Total Male Population of Rio del Mar?
Total Male Population of Rio del Mar is 4,423.
What is the Total Female Population of Rio del Mar?
Total Female Population of Rio del Mar is 4,584.
What is the Ratio of Males per 100 Females in Rio del Mar?
There are 96.49 Males per 100 Females in Rio del Mar.
What is the Ratio of Females per 100 Males in Rio del Mar?
There are 103.64 Females per 100 Males in Rio del Mar.
What is the Median Population Age in Rio del Mar?
Median Population Age in Rio del Mar is 50.2 Years.
What is the Average Family Size in Rio del Mar
Average Family Size in Rio del Mar is 2.9 People.
What is the Average Household Size in Rio del Mar
Average Household Size in Rio del Mar is 2.4 People.
How Large is the Labor Force in Rio del Mar?
There are 4,868 People in the Labor Forcein in Rio del Mar.
What is the Percentage of People in the Labor Force in Rio del Mar?
64.6% of People are in the Labor Force in Rio del Mar.
What is the Unemployment Rate in Rio del Mar?
Unemployment Rate in Rio del Mar is 4.6%.