Cities with the Lowest Poverty Level Among Families in the United States
RELATED REPORTS & OPTIONS
Lowest Family Poverty
United States
Compare Cities
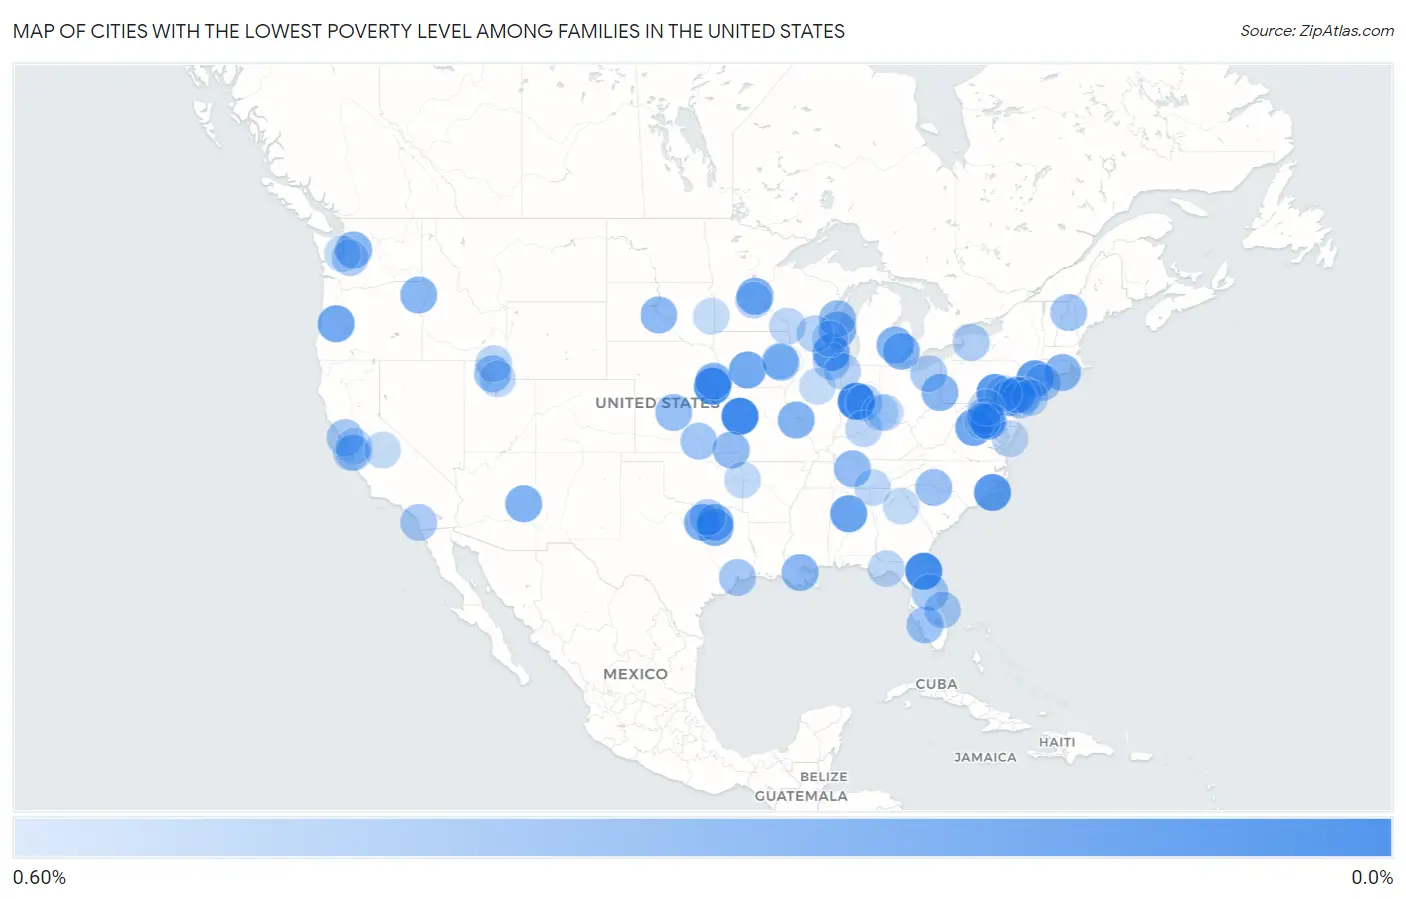
Map of Cities with the Lowest Poverty Level Among Families in the United States
0.60%
0.0%
Cities with the Lowest Poverty Level Among Families in the United States
| City | Family Poverty | vs State | vs National | |
| 1. | Media Borough | 0.077% | 8.0%(-7.92)#1 | 8.8%(-8.71)#1 |
| 2. | Pittsboro | 0.082% | 8.5%(-8.40)#1 | 8.8%(-8.70)#2 |
| 3. | Mission Hills | 0.093% | 7.6%(-7.55)#1 | 8.8%(-8.69)#3 |
| 4. | Asbury Lake | 0.11% | 9.1%(-9.01)#1 | 8.8%(-8.67)#4 |
| 5. | Hickman | 0.14% | 6.7%(-6.52)#1 | 8.8%(-8.64)#5 |
| 6. | Newport | 0.18% | 9.5%(-9.32)#1 | 8.8%(-8.60)#6 |
| 7. | Skyline View | 0.19% | 8.0%(-7.81)#2 | 8.8%(-8.60)#7 |
| 8. | Tappan | 0.20% | 9.7%(-9.54)#1 | 8.8%(-8.58)#8 |
| 9. | Packanack Lake | 0.22% | 6.9%(-6.72)#1 | 8.8%(-8.56)#9 |
| 10. | Sylvan Springs | 0.23% | 11.3%(-11.1)#1 | 8.8%(-8.56)#10 |
| 11. | Lionville | 0.24% | 8.0%(-7.76)#3 | 8.8%(-8.54)#11 |
| 12. | Spring Grove | 0.24% | 8.2%(-7.93)#1 | 8.8%(-8.54)#12 |
| 13. | Brightwood | 0.24% | 6.8%(-6.55)#1 | 8.8%(-8.54)#13 |
| 14. | Creswell | 0.25% | 7.3%(-7.01)#1 | 8.8%(-8.53)#14 |
| 15. | Earlham | 0.25% | 7.0%(-6.80)#1 | 8.8%(-8.53)#15 |
| 16. | Talty | 0.28% | 10.7%(-10.4)#1 | 8.8%(-8.50)#16 |
| 17. | Otsego | 0.29% | 5.5%(-5.24)#1 | 8.8%(-8.50)#17 |
| 18. | Haslet | 0.29% | 10.7%(-10.4)#2 | 8.8%(-8.49)#18 |
| 19. | Pinetop Country Club | 0.29% | 9.2%(-8.91)#1 | 8.8%(-8.49)#19 |
| 20. | St Paul | 0.31% | 8.5%(-8.19)#1 | 8.8%(-8.47)#20 |
| 21. | South Run | 0.31% | 6.8%(-6.49)#2 | 8.8%(-8.47)#21 |
| 22. | Lavon | 0.31% | 10.7%(-10.4)#3 | 8.8%(-8.47)#22 |
| 23. | Linden | 0.31% | 8.8%(-8.47)#1 | 8.8%(-8.47)#23 |
| 24. | Bingham Farms | 0.31% | 8.8%(-8.47)#2 | 8.8%(-8.47)#24 |
| 25. | Farmingdale Borough | 0.31% | 6.9%(-6.63)#2 | 8.8%(-8.47)#25 |
| 26. | Waverly | 0.31% | 6.7%(-6.35)#2 | 8.8%(-8.47)#26 |
| 27. | Sea Girt Borough | 0.31% | 6.9%(-6.63)#3 | 8.8%(-8.47)#27 |
| 28. | Cedar Grove | 0.32% | 6.6%(-6.27)#1 | 8.8%(-8.46)#28 |
| 29. | Essex Fells Borough | 0.32% | 6.9%(-6.62)#4 | 8.8%(-8.46)#29 |
| 30. | Lake Delta | 0.33% | 9.7%(-9.42)#2 | 8.8%(-8.46)#30 |
| 31. | Snoqualmie | 0.33% | 6.3%(-6.02)#1 | 8.8%(-8.45)#31 |
| 32. | Joseph | 0.33% | 7.3%(-6.93)#2 | 8.8%(-8.45)#32 |
| 33. | Hooverson Heights | 0.33% | 11.9%(-11.6)#1 | 8.8%(-8.45)#33 |
| 34. | Mystic | 0.34% | 6.8%(-6.51)#1 | 8.8%(-8.45)#34 |
| 35. | Fort Pierre | 0.34% | 7.5%(-7.19)#1 | 8.8%(-8.44)#35 |
| 36. | Montz | 0.34% | 13.9%(-13.6)#1 | 8.8%(-8.44)#36 |
| 37. | Oak Hill | 0.35% | 10.0%(-9.66)#1 | 8.8%(-8.43)#37 |
| 38. | Spotswood Borough | 0.35% | 6.9%(-6.59)#5 | 8.8%(-8.43)#38 |
| 39. | Altamont | 0.35% | 7.6%(-7.29)#2 | 8.8%(-8.43)#39 |
| 40. | Whitelaw | 0.36% | 6.6%(-6.23)#2 | 8.8%(-8.42)#40 |
| 41. | Plainville | 0.37% | 7.6%(-7.28)#3 | 8.8%(-8.41)#41 |
| 42. | Fairfax | 0.37% | 7.0%(-6.67)#2 | 8.8%(-8.41)#42 |
| 43. | Fairfax Station | 0.38% | 6.8%(-6.42)#3 | 8.8%(-8.40)#43 |
| 44. | Tega Cay | 0.38% | 10.2%(-9.81)#1 | 8.8%(-8.40)#44 |
| 45. | Farr West | 0.39% | 5.7%(-5.26)#1 | 8.8%(-8.39)#45 |
| 46. | Olga | 0.40% | 9.1%(-8.72)#2 | 8.8%(-8.38)#46 |
| 47. | Goddard | 0.41% | 7.6%(-7.24)#4 | 8.8%(-8.37)#47 |
| 48. | Lancaster | 0.41% | 4.4%(-3.98)#1 | 8.8%(-8.37)#48 |
| 49. | West Hills | 0.41% | 9.7%(-9.33)#3 | 8.8%(-8.37)#49 |
| 50. | Beach City | 0.41% | 10.7%(-10.3)#4 | 8.8%(-8.37)#50 |
| 51. | Blue Bell | 0.42% | 8.0%(-7.58)#4 | 8.8%(-8.37)#51 |
| 52. | Tiburon | 0.42% | 8.5%(-8.12)#1 | 8.8%(-8.36)#52 |
| 53. | Lake Mary | 0.42% | 9.1%(-8.70)#3 | 8.8%(-8.36)#53 |
| 54. | Bridgewater Center | 0.42% | 6.9%(-6.52)#6 | 8.8%(-8.36)#54 |
| 55. | Del Mar | 0.43% | 8.5%(-8.10)#2 | 8.8%(-8.35)#55 |
| 56. | Indian River Shores | 0.43% | 9.1%(-8.69)#4 | 8.8%(-8.35)#56 |
| 57. | Countryside | 0.44% | 6.8%(-6.36)#4 | 8.8%(-8.35)#57 |
| 58. | Freeburg Borough | 0.44% | 8.0%(-7.56)#5 | 8.8%(-8.34)#58 |
| 59. | Wayne | 0.44% | 8.2%(-7.73)#2 | 8.8%(-8.34)#59 |
| 60. | Corfu | 0.44% | 9.7%(-9.30)#4 | 8.8%(-8.34)#60 |
| 61. | Reminderville | 0.45% | 9.3%(-8.81)#1 | 8.8%(-8.34)#61 |
| 62. | Laflin Borough | 0.45% | 8.0%(-7.55)#6 | 8.8%(-8.33)#62 |
| 63. | Scotts Valley | 0.45% | 8.5%(-8.08)#3 | 8.8%(-8.33)#63 |
| 64. | Prairie Heights | 0.45% | 6.3%(-5.90)#2 | 8.8%(-8.33)#64 |
| 65. | Krugerville | 0.45% | 10.7%(-10.2)#5 | 8.8%(-8.33)#65 |
| 66. | Cumberland | 0.46% | 8.5%(-8.02)#2 | 8.8%(-8.32)#66 |
| 67. | White Horse | 0.46% | 6.9%(-6.48)#7 | 8.8%(-8.32)#67 |
| 68. | Kingston Estates | 0.46% | 6.9%(-6.48)#8 | 8.8%(-8.32)#68 |
| 69. | Maple Glen | 0.47% | 8.0%(-7.53)#7 | 8.8%(-8.32)#69 |
| 70. | Poynette | 0.47% | 6.6%(-6.12)#3 | 8.8%(-8.31)#70 |
| 71. | Atkins | 0.47% | 7.0%(-6.58)#3 | 8.8%(-8.31)#71 |
| 72. | St John | 0.47% | 8.5%(-8.01)#3 | 8.8%(-8.31)#72 |
| 73. | Forest Hills Borough | 0.47% | 8.0%(-7.52)#8 | 8.8%(-8.31)#73 |
| 74. | Greenfield | 0.48% | 5.5%(-5.04)#2 | 8.8%(-8.30)#74 |
| 75. | Clarks Summit Borough | 0.48% | 8.0%(-7.52)#9 | 8.8%(-8.30)#75 |
| 76. | Leisure Knoll | 0.48% | 6.9%(-6.46)#9 | 8.8%(-8.30)#76 |
| 77. | Newton | 0.49% | 5.7%(-5.17)#2 | 8.8%(-8.30)#77 |
| 78. | Hokah | 0.49% | 5.5%(-5.04)#3 | 8.8%(-8.30)#78 |
| 79. | Crawfordville | 0.49% | 9.1%(-8.64)#5 | 8.8%(-8.30)#79 |
| 80. | Greenville | 0.49% | 8.5%(-7.99)#4 | 8.8%(-8.29)#80 |
| 81. | Lookout Mountain | 0.49% | 10.0%(-9.52)#2 | 8.8%(-8.29)#81 |
| 82. | East Foothills | 0.50% | 8.5%(-8.03)#4 | 8.8%(-8.28)#82 |
| 83. | Hayfield | 0.50% | 6.8%(-6.29)#5 | 8.8%(-8.28)#83 |
| 84. | Parksley | 0.50% | 6.8%(-6.29)#6 | 8.8%(-8.28)#84 |
| 85. | Reinholds | 0.50% | 8.0%(-7.50)#10 | 8.8%(-8.28)#85 |
| 86. | Morgan | 0.50% | 5.7%(-5.15)#3 | 8.8%(-8.28)#86 |
| 87. | Walkersville | 0.50% | 6.2%(-5.71)#1 | 8.8%(-8.28)#87 |
| 88. | Remy | 0.50% | 11.0%(-10.5)#1 | 8.8%(-8.28)#88 |
| 89. | Rosedale | 0.51% | 6.3%(-5.84)#3 | 8.8%(-8.28)#89 |
| 90. | Stanhope Borough | 0.51% | 6.9%(-6.43)#10 | 8.8%(-8.27)#90 |
| 91. | Harrison | 0.51% | 9.3%(-8.75)#2 | 8.8%(-8.27)#91 |
| 92. | Merton | 0.51% | 6.6%(-6.08)#4 | 8.8%(-8.27)#92 |
| 93. | Corralitos | 0.51% | 8.5%(-8.03)#5 | 8.8%(-8.27)#93 |
| 94. | Winterville | 0.51% | 10.0%(-9.51)#1 | 8.8%(-8.27)#94 |
| 95. | Linton Hall | 0.51% | 6.8%(-6.28)#7 | 8.8%(-8.27)#95 |
| 96. | Lincoln Park Borough | 0.51% | 6.9%(-6.43)#11 | 8.8%(-8.27)#96 |
| 97. | Aurora | 0.52% | 7.5%(-7.01)#2 | 8.8%(-8.27)#97 |
| 98. | Congerville | 0.52% | 8.2%(-7.66)#3 | 8.8%(-8.27)#98 |
| 99. | Wyoming | 0.52% | 9.3%(-8.74)#3 | 8.8%(-8.27)#99 |
| 100. | Yosemite Lakes | 0.52% | 8.5%(-8.02)#6 | 8.8%(-8.27)#100 |
Common Questions
What are the Top 10 Cities with the Lowest Poverty Level Among Families in the United States?
Top 10 Cities with the Lowest Poverty Level Among Families in the United States are:
#1
0.082%
#2
0.093%
#3
0.11%
#4
0.14%
#5
0.18%
#6
0.19%
#7
0.20%
#8
0.23%
#9
0.24%
#10
0.24%
What city has the Lowest Poverty Level Among Families in the United States?
Pittsboro has the Lowest Poverty Level Among Families in the United States with 0.082%.
What is the Poverty Level Among Families in the United States?
Poverty Level Among Families in the United States is 8.8%.