Cities with the Lowest Poverty Level Among Families in Missouri
RELATED REPORTS & OPTIONS
Lowest Family Poverty
Missouri
Compare Cities
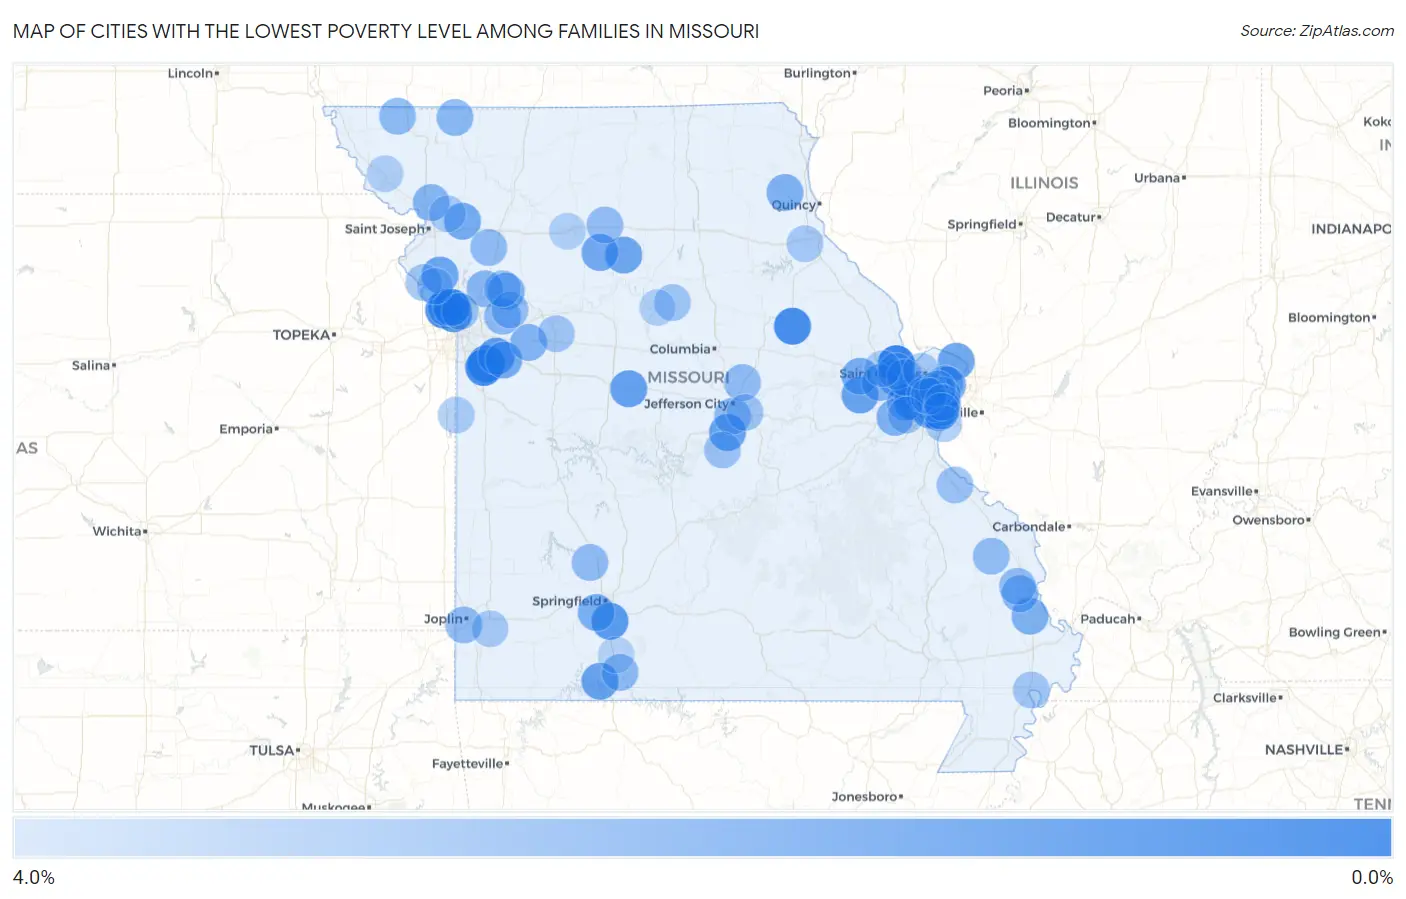
Map of Cities with the Lowest Poverty Level Among Families in Missouri
4.0%
0.0%
Cities with the Lowest Poverty Level Among Families in Missouri
| City | Family Poverty | vs State | vs National | |
| 1. | St Paul | 0.31% | 8.5%(-8.19)#1 | 8.8%(-8.47)#20 |
| 2. | Greenwood | 0.56% | 8.5%(-7.93)#2 | 8.8%(-8.22)#130 |
| 3. | Des Peres | 0.57% | 8.5%(-7.92)#3 | 8.8%(-8.21)#139 |
| 4. | Martinsburg | 0.65% | 8.5%(-7.84)#4 | 8.8%(-8.13)#183 |
| 5. | Grantwood Village | 0.66% | 8.5%(-7.83)#5 | 8.8%(-8.12)#191 |
| 6. | Parkville | 0.67% | 8.5%(-7.82)#6 | 8.8%(-8.11)#203 |
| 7. | Lake Winnebago | 0.75% | 8.5%(-7.74)#7 | 8.8%(-8.03)#271 |
| 8. | Ellisville | 0.75% | 8.5%(-7.74)#8 | 8.8%(-8.03)#273 |
| 9. | Glendale | 0.96% | 8.5%(-7.54)#9 | 8.8%(-7.83)#477 |
| 10. | Concord | 0.96% | 8.5%(-7.53)#10 | 8.8%(-7.82)#480 |
| 11. | Houston Lake | 0.96% | 8.5%(-7.53)#11 | 8.8%(-7.82)#486 |
| 12. | Ladue | 0.98% | 8.5%(-7.51)#12 | 8.8%(-7.80)#511 |
| 13. | Fenton | 1.1% | 8.5%(-7.42)#13 | 8.8%(-7.71)#621 |
| 14. | Fremont Hills | 1.1% | 8.5%(-7.41)#14 | 8.8%(-7.69)#635 |
| 15. | Lake Waukomis | 1.1% | 8.5%(-7.36)#15 | 8.8%(-7.65)#673 |
| 16. | Lake Lotawana | 1.1% | 8.5%(-7.35)#16 | 8.8%(-7.63)#690 |
| 17. | Weatherby Lake | 1.2% | 8.5%(-7.31)#17 | 8.8%(-7.60)#744 |
| 18. | Sunset Hills | 1.2% | 8.5%(-7.28)#18 | 8.8%(-7.57)#771 |
| 19. | Smithton | 1.4% | 8.5%(-7.13)#19 | 8.8%(-7.42)#962 |
| 20. | Marthasville | 1.4% | 8.5%(-7.08)#20 | 8.8%(-7.37)#1,023 |
| 21. | Indian Point | 1.4% | 8.5%(-7.07)#21 | 8.8%(-7.36)#1,032 |
| 22. | St Thomas | 1.4% | 8.5%(-7.06)#22 | 8.8%(-7.35)#1,050 |
| 23. | Dardenne Prairie | 1.5% | 8.5%(-7.02)#23 | 8.8%(-7.31)#1,111 |
| 24. | West Alton | 1.5% | 8.5%(-6.97)#24 | 8.8%(-7.25)#1,189 |
| 25. | Camden Point | 1.5% | 8.5%(-6.97)#25 | 8.8%(-7.25)#1,190 |
| 26. | Mendon | 1.5% | 8.5%(-6.95)#26 | 8.8%(-7.24)#1,211 |
| 27. | Northwoods | 1.6% | 8.5%(-6.94)#27 | 8.8%(-7.23)#1,227 |
| 28. | Hale | 1.6% | 8.5%(-6.91)#28 | 8.8%(-7.19)#1,274 |
| 29. | Platte Woods | 1.7% | 8.5%(-6.81)#29 | 8.8%(-7.10)#1,403 |
| 30. | Clarksdale | 1.7% | 8.5%(-6.80)#30 | 8.8%(-7.09)#1,421 |
| 31. | Lone Jack | 1.7% | 8.5%(-6.75)#31 | 8.8%(-7.04)#1,495 |
| 32. | Innsbrook | 1.8% | 8.5%(-6.74)#32 | 8.8%(-7.03)#1,515 |
| 33. | Clarkson Valley | 1.8% | 8.5%(-6.72)#33 | 8.8%(-7.01)#1,554 |
| 34. | Battlefield | 1.8% | 8.5%(-6.66)#34 | 8.8%(-6.95)#1,636 |
| 35. | Benton | 1.9% | 8.5%(-6.60)#35 | 8.8%(-6.89)#1,734 |
| 36. | Ewing | 1.9% | 8.5%(-6.55)#36 | 8.8%(-6.84)#1,811 |
| 37. | Wood Heights | 2.0% | 8.5%(-6.52)#37 | 8.8%(-6.81)#1,853 |
| 38. | Pacific | 2.0% | 8.5%(-6.52)#38 | 8.8%(-6.81)#1,854 |
| 39. | New Melle | 2.0% | 8.5%(-6.48)#39 | 8.8%(-6.77)#1,905 |
| 40. | Chesterfield | 2.0% | 8.5%(-6.47)#40 | 8.8%(-6.76)#1,921 |
| 41. | Odessa | 2.0% | 8.5%(-6.44)#41 | 8.8%(-6.73)#1,960 |
| 42. | Dutchtown | 2.1% | 8.5%(-6.41)#42 | 8.8%(-6.70)#2,008 |
| 43. | Savannah | 2.1% | 8.5%(-6.40)#43 | 8.8%(-6.69)#2,023 |
| 44. | Warson Woods | 2.1% | 8.5%(-6.38)#44 | 8.8%(-6.66)#2,056 |
| 45. | Kearney | 2.1% | 8.5%(-6.36)#45 | 8.8%(-6.65)#2,069 |
| 46. | Marlborough | 2.2% | 8.5%(-6.34)#46 | 8.8%(-6.63)#2,111 |
| 47. | Sheridan | 2.2% | 8.5%(-6.32)#47 | 8.8%(-6.61)#2,148 |
| 48. | Wildwood | 2.2% | 8.5%(-6.31)#48 | 8.8%(-6.59)#2,162 |
| 49. | Sappington | 2.2% | 8.5%(-6.27)#49 | 8.8%(-6.56)#2,209 |
| 50. | Elmo | 2.2% | 8.5%(-6.27)#50 | 8.8%(-6.56)#2,221 |
| 51. | Rockaway Beach | 2.3% | 8.5%(-6.22)#51 | 8.8%(-6.51)#2,300 |
| 52. | Sibley | 2.3% | 8.5%(-6.22)#52 | 8.8%(-6.51)#2,304 |
| 53. | Morrisville | 2.3% | 8.5%(-6.18)#53 | 8.8%(-6.47)#2,367 |
| 54. | Brentwood | 2.3% | 8.5%(-6.17)#54 | 8.8%(-6.46)#2,386 |
| 55. | Wardsville | 2.3% | 8.5%(-6.17)#55 | 8.8%(-6.46)#2,388 |
| 56. | Grand Falls Plaza | 2.3% | 8.5%(-6.17)#56 | 8.8%(-6.46)#2,397 |
| 57. | Turney | 2.3% | 8.5%(-6.17)#57 | 8.8%(-6.46)#2,400 |
| 58. | New Bloomfield | 2.3% | 8.5%(-6.15)#58 | 8.8%(-6.44)#2,420 |
| 59. | Orrick | 2.4% | 8.5%(-6.11)#59 | 8.8%(-6.40)#2,471 |
| 60. | Gordonville | 2.4% | 8.5%(-6.11)#60 | 8.8%(-6.40)#2,472 |
| 61. | Sedgewickville | 2.4% | 8.5%(-6.11)#61 | 8.8%(-6.40)#2,482 |
| 62. | Oakland | 2.4% | 8.5%(-6.08)#62 | 8.8%(-6.37)#2,527 |
| 63. | Meadville | 2.4% | 8.5%(-6.05)#63 | 8.8%(-6.34)#2,579 |
| 64. | Bellerive Acres | 2.4% | 8.5%(-6.05)#64 | 8.8%(-6.34)#2,581 |
| 65. | Richmond Heights | 2.5% | 8.5%(-6.01)#65 | 8.8%(-6.30)#2,650 |
| 66. | O Fallon | 2.5% | 8.5%(-5.99)#66 | 8.8%(-6.28)#2,698 |
| 67. | Webster Groves | 2.5% | 8.5%(-5.98)#67 | 8.8%(-6.27)#2,710 |
| 68. | Cottleville | 2.5% | 8.5%(-5.97)#68 | 8.8%(-6.26)#2,726 |
| 69. | Kirkwood | 2.5% | 8.5%(-5.95)#69 | 8.8%(-6.24)#2,748 |
| 70. | Bloomsdale | 2.6% | 8.5%(-5.93)#70 | 8.8%(-6.22)#2,777 |
| 71. | St Elizabeth | 2.6% | 8.5%(-5.93)#71 | 8.8%(-6.22)#2,782 |
| 72. | Creve Coeur | 2.6% | 8.5%(-5.91)#72 | 8.8%(-6.20)#2,817 |
| 73. | Oakview | 2.6% | 8.5%(-5.88)#73 | 8.8%(-6.17)#2,865 |
| 74. | Homestead | 2.6% | 8.5%(-5.86)#74 | 8.8%(-6.15)#2,902 |
| 75. | Armstrong | 2.7% | 8.5%(-5.83)#75 | 8.8%(-6.12)#2,972 |
| 76. | Town And Country | 2.7% | 8.5%(-5.82)#76 | 8.8%(-6.11)#2,986 |
| 77. | Weston | 2.7% | 8.5%(-5.81)#77 | 8.8%(-6.10)#2,995 |
| 78. | Higginsville | 2.7% | 8.5%(-5.81)#78 | 8.8%(-6.10)#2,996 |
| 79. | Frontenac | 2.7% | 8.5%(-5.81)#79 | 8.8%(-6.10)#2,998 |
| 80. | Affton | 2.7% | 8.5%(-5.81)#80 | 8.8%(-6.10)#3,004 |
| 81. | Taos | 2.7% | 8.5%(-5.80)#81 | 8.8%(-6.09)#3,015 |
| 82. | Eureka | 2.7% | 8.5%(-5.79)#82 | 8.8%(-6.08)#3,021 |
| 83. | New Madrid | 2.7% | 8.5%(-5.79)#83 | 8.8%(-6.07)#3,036 |
| 84. | Raintree Plantation | 2.8% | 8.5%(-5.71)#84 | 8.8%(-6.00)#3,153 |
| 85. | St Charles | 2.8% | 8.5%(-5.70)#85 | 8.8%(-5.99)#3,188 |
| 86. | Diamond | 2.8% | 8.5%(-5.69)#86 | 8.8%(-5.98)#3,198 |
| 87. | Rensselaer | 2.8% | 8.5%(-5.68)#87 | 8.8%(-5.96)#3,240 |
| 88. | Oakville | 2.8% | 8.5%(-5.65)#88 | 8.8%(-5.94)#3,273 |
| 89. | Cosby | 2.9% | 8.5%(-5.64)#89 | 8.8%(-5.92)#3,309 |
| 90. | Drexel | 2.9% | 8.5%(-5.62)#90 | 8.8%(-5.91)#3,326 |
| 91. | Olivette | 3.0% | 8.5%(-5.54)#91 | 8.8%(-5.83)#3,476 |
| 92. | Wentzville | 3.0% | 8.5%(-5.54)#92 | 8.8%(-5.83)#3,478 |
| 93. | Mound City | 3.0% | 8.5%(-5.51)#93 | 8.8%(-5.80)#3,526 |
| 94. | Tracy | 3.0% | 8.5%(-5.51)#94 | 8.8%(-5.80)#3,537 |
| 95. | Country Life Acres | 3.0% | 8.5%(-5.46)#95 | 8.8%(-5.75)#3,610 |
| 96. | Glasgow | 3.0% | 8.5%(-5.45)#96 | 8.8%(-5.74)#3,623 |
| 97. | Utica | 3.1% | 8.5%(-5.42)#97 | 8.8%(-5.70)#3,682 |
| 98. | Shrewsbury | 3.2% | 8.5%(-5.34)#98 | 8.8%(-5.63)#3,814 |
| 99. | Saddlebrooke | 3.2% | 8.5%(-5.29)#99 | 8.8%(-5.58)#3,882 |
| 100. | Green Park | 3.2% | 8.5%(-5.29)#100 | 8.8%(-5.58)#3,885 |
Common Questions
What are the Top 10 Cities with the Lowest Poverty Level Among Families in Missouri?
Top 10 Cities with the Lowest Poverty Level Among Families in Missouri are:
#1
0.31%
#2
0.56%
#3
0.57%
#4
0.65%
#5
0.66%
#6
0.67%
#7
0.75%
#8
0.75%
#9
0.96%
#10
0.96%
What city has the Lowest Poverty Level Among Families in Missouri?
St Paul has the Lowest Poverty Level Among Families in Missouri with 0.31%.
What is the Poverty Level Among Families in the State of Missouri?
Poverty Level Among Families in Missouri is 8.5%.
What is the Poverty Level Among Families in the United States?
Poverty Level Among Families in the United States is 8.8%.