Cities with the Lowest Poverty Level Among Families in South Dakota
RELATED REPORTS & OPTIONS
Lowest Family Poverty
South Dakota
Compare Cities
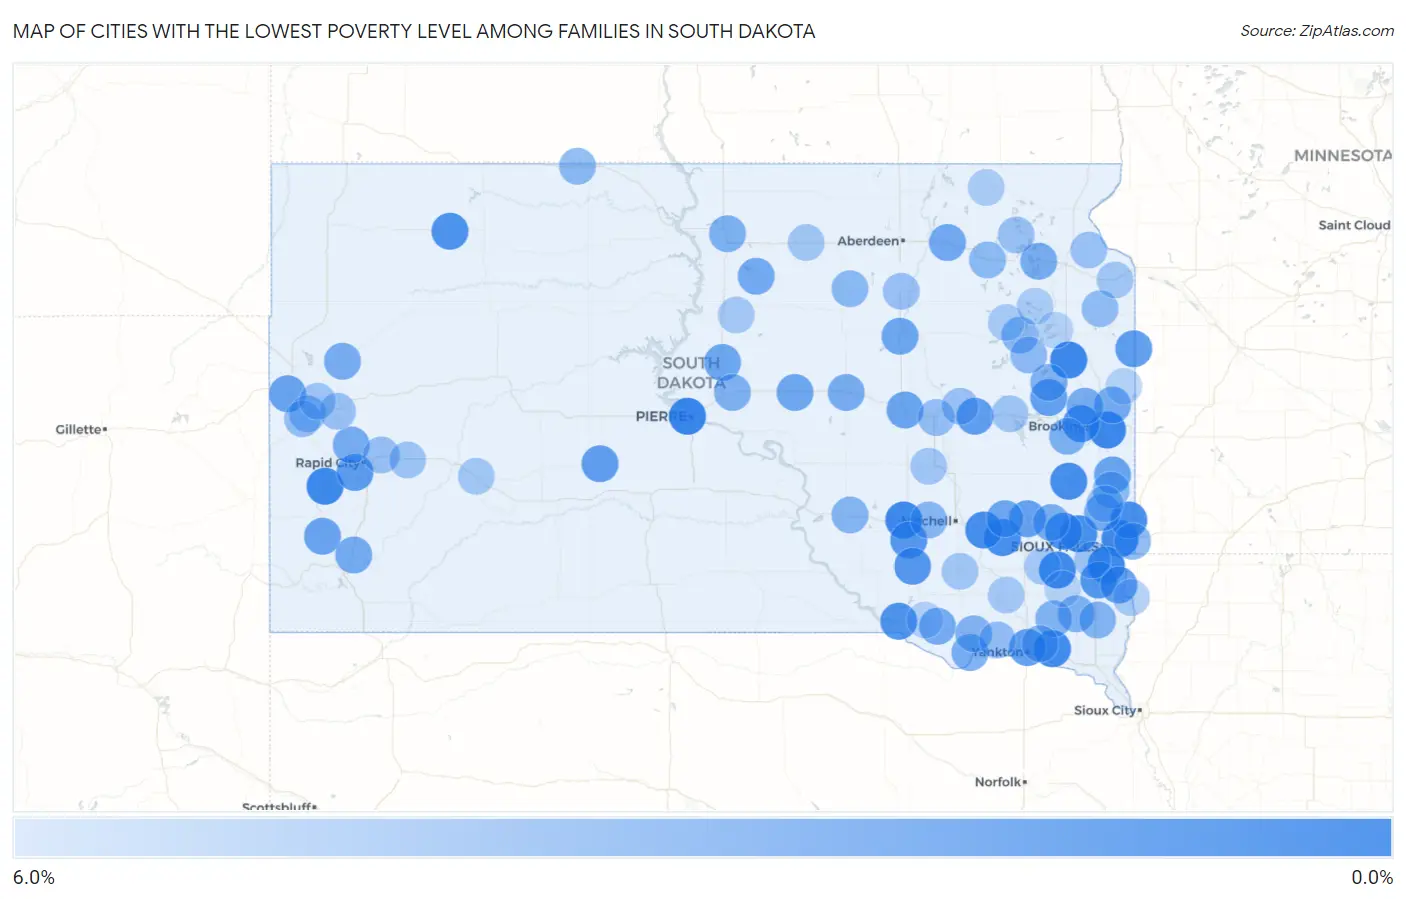
Map of Cities with the Lowest Poverty Level Among Families in South Dakota
6.0%
0.0%
Cities with the Lowest Poverty Level Among Families in South Dakota
| City | Family Poverty | vs State | vs National | |
| 1. | Fort Pierre | 0.34% | 7.5%(-7.19)#1 | 8.8%(-8.44)#35 |
| 2. | Aurora | 0.52% | 7.5%(-7.01)#2 | 8.8%(-8.27)#97 |
| 3. | Castlewood | 0.54% | 7.5%(-6.98)#3 | 8.8%(-8.24)#111 |
| 4. | Plankinton | 0.55% | 7.5%(-6.98)#4 | 8.8%(-8.24)#114 |
| 5. | Brandon | 0.63% | 7.5%(-6.90)#5 | 8.8%(-8.16)#172 |
| 6. | Hill City | 0.64% | 7.5%(-6.89)#6 | 8.8%(-8.14)#177 |
| 7. | Harrisburg | 0.74% | 7.5%(-6.79)#7 | 8.8%(-8.04)#265 |
| 8. | Parker | 0.74% | 7.5%(-6.78)#8 | 8.8%(-8.04)#267 |
| 9. | Gayville | 0.81% | 7.5%(-6.71)#9 | 8.8%(-7.97)#331 |
| 10. | Emery | 0.85% | 7.5%(-6.67)#10 | 8.8%(-7.93)#372 |
| 11. | Hartford | 0.87% | 7.5%(-6.65)#11 | 8.8%(-7.91)#394 |
| 12. | Alexandria | 0.97% | 7.5%(-6.56)#12 | 8.8%(-7.82)#492 |
| 13. | Lake Madison | 0.97% | 7.5%(-6.55)#13 | 8.8%(-7.81)#500 |
| 14. | Garretson | 1.0% | 7.5%(-6.52)#14 | 8.8%(-7.78)#533 |
| 15. | Volga | 1.1% | 7.5%(-6.42)#15 | 8.8%(-7.68)#646 |
| 16. | Humboldt | 1.2% | 7.5%(-6.33)#16 | 8.8%(-7.58)#758 |
| 17. | Bison | 1.3% | 7.5%(-6.21)#17 | 8.8%(-7.47)#900 |
| 18. | Pickstown | 1.3% | 7.5%(-6.19)#18 | 8.8%(-7.45)#925 |
| 19. | Worthing | 1.6% | 7.5%(-5.93)#19 | 8.8%(-7.19)#1,284 |
| 20. | Stickney | 1.6% | 7.5%(-5.91)#20 | 8.8%(-7.17)#1,311 |
| 21. | Corsica | 1.7% | 7.5%(-5.85)#21 | 8.8%(-7.11)#1,396 |
| 22. | Colonial Pine Hills | 1.9% | 7.5%(-5.62)#22 | 8.8%(-6.88)#1,750 |
| 23. | Gary | 2.0% | 7.5%(-5.53)#23 | 8.8%(-6.78)#1,886 |
| 24. | Yankton | 2.1% | 7.5%(-5.47)#24 | 8.8%(-6.73)#1,962 |
| 25. | Midland | 2.1% | 7.5%(-5.44)#25 | 8.8%(-6.70)#2,013 |
| 26. | Iroquois | 2.1% | 7.5%(-5.40)#26 | 8.8%(-6.65)#2,072 |
| 27. | Canton | 2.1% | 7.5%(-5.38)#27 | 8.8%(-6.63)#2,103 |
| 28. | Badger | 2.2% | 7.5%(-5.30)#28 | 8.8%(-6.56)#2,224 |
| 29. | Salem | 2.3% | 7.5%(-5.25)#29 | 8.8%(-6.51)#2,297 |
| 30. | North Spearfish | 2.5% | 7.5%(-5.07)#30 | 8.8%(-6.32)#2,611 |
| 31. | Pringle | 2.5% | 7.5%(-5.03)#31 | 8.8%(-6.28)#2,689 |
| 32. | Wolsey | 2.6% | 7.5%(-4.94)#32 | 8.8%(-6.20)#2,813 |
| 33. | Egan | 2.6% | 7.5%(-4.93)#33 | 8.8%(-6.18)#2,847 |
| 34. | Spencer | 2.6% | 7.5%(-4.89)#34 | 8.8%(-6.15)#2,909 |
| 35. | Redfield | 2.7% | 7.5%(-4.87)#35 | 8.8%(-6.13)#2,948 |
| 36. | Onida | 2.7% | 7.5%(-4.84)#36 | 8.8%(-6.10)#3,003 |
| 37. | Highmore | 2.8% | 7.5%(-4.76)#37 | 8.8%(-6.02)#3,133 |
| 38. | Groton | 2.9% | 7.5%(-4.63)#38 | 8.8%(-5.88)#3,370 |
| 39. | White | 2.9% | 7.5%(-4.61)#39 | 8.8%(-5.86)#3,409 |
| 40. | Hoven | 3.0% | 7.5%(-4.54)#40 | 8.8%(-5.80)#3,529 |
| 41. | Baltic | 3.0% | 7.5%(-4.50)#41 | 8.8%(-5.75)#3,598 |
| 42. | Buffalo Gap | 3.0% | 7.5%(-4.50)#42 | 8.8%(-5.75)#3,608 |
| 43. | Dante | 3.0% | 7.5%(-4.50)#43 | 8.8%(-5.75)#3,609 |
| 44. | Newell | 3.1% | 7.5%(-4.40)#44 | 8.8%(-5.66)#3,767 |
| 45. | Bruce | 3.1% | 7.5%(-4.40)#45 | 8.8%(-5.66)#3,769 |
| 46. | Summerset | 3.1% | 7.5%(-4.40)#46 | 8.8%(-5.65)#3,782 |
| 47. | Miller | 3.1% | 7.5%(-4.39)#47 | 8.8%(-5.65)#3,787 |
| 48. | Springfield | 3.2% | 7.5%(-4.37)#48 | 8.8%(-5.62)#3,816 |
| 49. | Waubay | 3.2% | 7.5%(-4.33)#49 | 8.8%(-5.58)#3,881 |
| 50. | Montrose | 3.2% | 7.5%(-4.30)#50 | 8.8%(-5.56)#3,916 |
| 51. | Centerville | 3.4% | 7.5%(-4.12)#51 | 8.8%(-5.38)#4,227 |
| 52. | Selby | 3.4% | 7.5%(-4.12)#52 | 8.8%(-5.37)#4,235 |
| 53. | Sinai | 3.4% | 7.5%(-4.08)#53 | 8.8%(-5.33)#4,303 |
| 54. | Blunt | 3.5% | 7.5%(-4.02)#54 | 8.8%(-5.27)#4,385 |
| 55. | Lake Norden | 3.6% | 7.5%(-3.95)#55 | 8.8%(-5.21)#4,483 |
| 56. | Tyndall | 3.6% | 7.5%(-3.94)#56 | 8.8%(-5.20)#4,527 |
| 57. | Irene | 3.6% | 7.5%(-3.89)#57 | 8.8%(-5.15)#4,614 |
| 58. | Beresford | 3.7% | 7.5%(-3.86)#58 | 8.8%(-5.11)#4,666 |
| 59. | Kimball | 3.8% | 7.5%(-3.74)#59 | 8.8%(-4.99)#4,860 |
| 60. | Valley Springs | 3.8% | 7.5%(-3.73)#60 | 8.8%(-4.99)#4,865 |
| 61. | Henry | 3.8% | 7.5%(-3.68)#61 | 8.8%(-4.94)#4,953 |
| 62. | Mission Hill | 3.8% | 7.5%(-3.68)#62 | 8.8%(-4.94)#4,956 |
| 63. | Mount Vernon | 3.9% | 7.5%(-3.60)#63 | 8.8%(-4.86)#5,053 |
| 64. | Trent | 3.9% | 7.5%(-3.58)#64 | 8.8%(-4.83)#5,101 |
| 65. | Cresbard | 4.0% | 7.5%(-3.53)#65 | 8.8%(-4.78)#5,197 |
| 66. | Mcintosh | 4.0% | 7.5%(-3.53)#66 | 8.8%(-4.78)#5,199 |
| 67. | Bristol | 4.1% | 7.5%(-3.42)#67 | 8.8%(-4.67)#5,365 |
| 68. | Hazel | 4.2% | 7.5%(-3.36)#68 | 8.8%(-4.62)#5,453 |
| 69. | Deadwood | 4.2% | 7.5%(-3.30)#69 | 8.8%(-4.56)#5,524 |
| 70. | Strandburg | 4.3% | 7.5%(-3.18)#70 | 8.8%(-4.43)#5,769 |
| 71. | Dell Rapids | 4.4% | 7.5%(-3.17)#71 | 8.8%(-4.43)#5,775 |
| 72. | Tabor | 4.5% | 7.5%(-3.05)#72 | 8.8%(-4.30)#5,934 |
| 73. | Huron | 4.5% | 7.5%(-3.04)#73 | 8.8%(-4.30)#5,949 |
| 74. | Box Elder | 4.5% | 7.5%(-3.01)#74 | 8.8%(-4.27)#5,991 |
| 75. | Lead | 4.6% | 7.5%(-2.97)#75 | 8.8%(-4.23)#6,064 |
| 76. | Yale | 4.7% | 7.5%(-2.87)#76 | 8.8%(-4.13)#6,220 |
| 77. | Roslyn | 4.7% | 7.5%(-2.87)#77 | 8.8%(-4.13)#6,223 |
| 78. | Mellette | 4.7% | 7.5%(-2.87)#78 | 8.8%(-4.13)#6,224 |
| 79. | Wilmot | 4.7% | 7.5%(-2.81)#79 | 8.8%(-4.06)#6,323 |
| 80. | Sturgis | 4.8% | 7.5%(-2.76)#80 | 8.8%(-4.02)#6,360 |
| 81. | Whitewood | 4.8% | 7.5%(-2.74)#81 | 8.8%(-4.00)#6,415 |
| 82. | New Underwood | 4.8% | 7.5%(-2.72)#82 | 8.8%(-3.97)#6,447 |
| 83. | De Smet | 4.9% | 7.5%(-2.66)#83 | 8.8%(-3.91)#6,530 |
| 84. | Tea | 4.9% | 7.5%(-2.61)#84 | 8.8%(-3.87)#6,611 |
| 85. | Parkston | 5.0% | 7.5%(-2.54)#85 | 8.8%(-3.79)#6,727 |
| 86. | Woonsocket | 5.0% | 7.5%(-2.49)#86 | 8.8%(-3.75)#6,831 |
| 87. | Milbank | 5.0% | 7.5%(-2.48)#87 | 8.8%(-3.74)#6,852 |
| 88. | Wall | 5.1% | 7.5%(-2.44)#88 | 8.8%(-3.70)#6,895 |
| 89. | Roscoe | 5.1% | 7.5%(-2.44)#89 | 8.8%(-3.70)#6,896 |
| 90. | Gettysburg | 5.2% | 7.5%(-2.31)#90 | 8.8%(-3.56)#7,089 |
| 91. | Marion | 5.2% | 7.5%(-2.30)#91 | 8.8%(-3.56)#7,094 |
| 92. | Menno | 5.2% | 7.5%(-2.29)#92 | 8.8%(-3.55)#7,117 |
| 93. | Garden City | 5.3% | 7.5%(-2.26)#93 | 8.8%(-3.52)#7,192 |
| 94. | Fairview | 5.3% | 7.5%(-2.26)#94 | 8.8%(-3.52)#7,194 |
| 95. | Florence | 5.5% | 7.5%(-2.05)#95 | 8.8%(-3.30)#7,527 |
| 96. | Britton | 5.5% | 7.5%(-2.02)#96 | 8.8%(-3.27)#7,555 |
| 97. | Wagner | 5.7% | 7.5%(-1.81)#97 | 8.8%(-3.07)#7,863 |
| 98. | Watertown | 5.8% | 7.5%(-1.72)#98 | 8.8%(-2.98)#8,007 |
| 99. | Astoria | 5.9% | 7.5%(-1.64)#99 | 8.8%(-2.90)#8,137 |
| 100. | Hurley | 5.9% | 7.5%(-1.58)#100 | 8.8%(-2.84)#8,214 |
Common Questions
What are the Top 10 Cities with the Lowest Poverty Level Among Families in South Dakota?
Top 10 Cities with the Lowest Poverty Level Among Families in South Dakota are:
#1
0.34%
#2
0.52%
#3
0.54%
#4
0.55%
#5
0.63%
#6
0.64%
#7
0.74%
#8
0.74%
#9
0.81%
#10
0.85%
What city has the Lowest Poverty Level Among Families in South Dakota?
Fort Pierre has the Lowest Poverty Level Among Families in South Dakota with 0.34%.
What is the Poverty Level Among Families in the State of South Dakota?
Poverty Level Among Families in South Dakota is 7.5%.
What is the Poverty Level Among Families in the United States?
Poverty Level Among Families in the United States is 8.8%.