Cities with the Lowest Poverty Level Among Families in North Carolina
RELATED REPORTS & OPTIONS
Lowest Family Poverty
North Carolina
Compare Cities
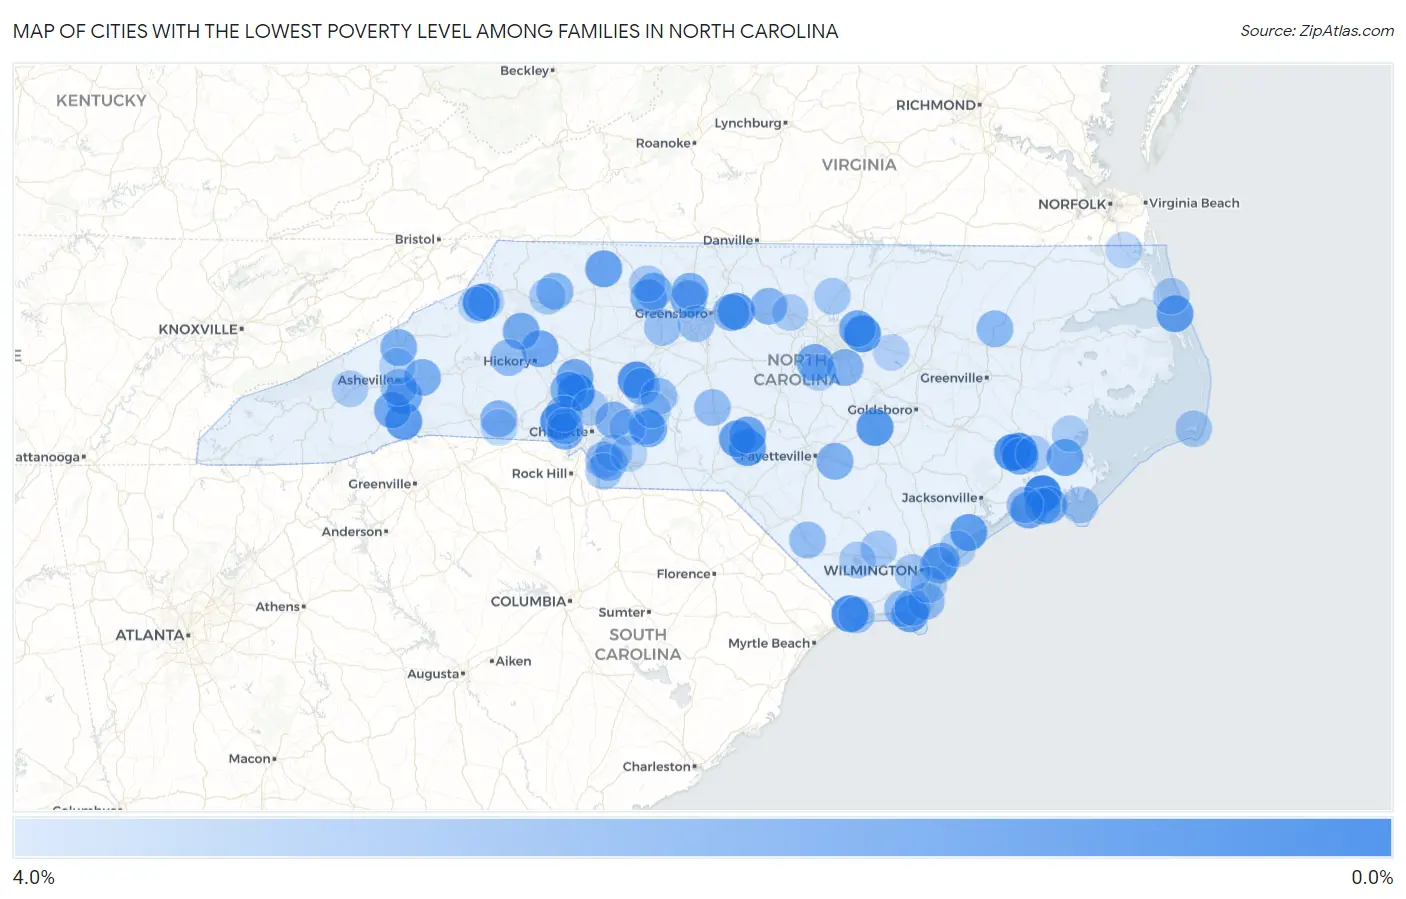
Map of Cities with the Lowest Poverty Level Among Families in North Carolina
4.0%
0.0%
Cities with the Lowest Poverty Level Among Families in North Carolina
| City | Family Poverty | vs State | vs National | |
| 1. | Newport | 0.18% | 9.5%(-9.32)#1 | 8.8%(-8.60)#6 |
| 2. | Westport | 0.53% | 9.5%(-8.96)#2 | 8.8%(-8.25)#106 |
| 3. | Trent Woods | 0.58% | 9.5%(-8.91)#3 | 8.8%(-8.20)#144 |
| 4. | Ranlo | 0.71% | 9.5%(-8.79)#4 | 8.8%(-8.07)#239 |
| 5. | Carolina Shores | 0.77% | 9.5%(-8.72)#5 | 8.8%(-8.01)#296 |
| 6. | Seven Devils | 0.78% | 9.5%(-8.72)#6 | 8.8%(-8.01)#297 |
| 7. | Faith | 0.85% | 9.5%(-8.65)#7 | 8.8%(-7.93)#369 |
| 8. | Rolesville | 0.88% | 9.5%(-8.62)#8 | 8.8%(-7.90)#400 |
| 9. | River Bend | 0.91% | 9.5%(-8.59)#9 | 8.8%(-7.87)#435 |
| 10. | Newton Grove | 1.1% | 9.5%(-8.44)#10 | 8.8%(-7.72)#601 |
| 11. | Whitsett | 1.1% | 9.5%(-8.40)#11 | 8.8%(-7.68)#643 |
| 12. | Pinebluff | 1.2% | 9.5%(-8.34)#12 | 8.8%(-7.62)#712 |
| 13. | Valley Hill | 1.2% | 9.5%(-8.29)#13 | 8.8%(-7.57)#773 |
| 14. | Holly Ridge | 1.3% | 9.5%(-8.24)#14 | 8.8%(-7.53)#839 |
| 15. | Kitty Hawk | 1.3% | 9.5%(-8.19)#15 | 8.8%(-7.47)#896 |
| 16. | Foxfire | 1.4% | 9.5%(-8.14)#16 | 8.8%(-7.43)#955 |
| 17. | Caswell Beach | 1.4% | 9.5%(-8.12)#17 | 8.8%(-7.40)#983 |
| 18. | Dobson | 1.5% | 9.5%(-8.03)#18 | 8.8%(-7.31)#1,099 |
| 19. | Oriental | 1.5% | 9.5%(-7.96)#19 | 8.8%(-7.24)#1,204 |
| 20. | Pinehurst | 1.6% | 9.5%(-7.88)#20 | 8.8%(-7.16)#1,321 |
| 21. | Emerald Isle | 1.6% | 9.5%(-7.88)#21 | 8.8%(-7.16)#1,323 |
| 22. | Royal Pines | 1.6% | 9.5%(-7.87)#22 | 8.8%(-7.16)#1,327 |
| 23. | Bethlehem | 1.7% | 9.5%(-7.84)#23 | 8.8%(-7.13)#1,364 |
| 24. | Brices Creek | 1.7% | 9.5%(-7.84)#24 | 8.8%(-7.12)#1,369 |
| 25. | Lake Norman Of Catawba | 1.7% | 9.5%(-7.84)#25 | 8.8%(-7.12)#1,370 |
| 26. | Mills River | 1.7% | 9.5%(-7.80)#26 | 8.8%(-7.09)#1,423 |
| 27. | Oakboro | 1.7% | 9.5%(-7.79)#27 | 8.8%(-7.07)#1,444 |
| 28. | Apex | 1.7% | 9.5%(-7.77)#28 | 8.8%(-7.06)#1,469 |
| 29. | Cramerton | 1.8% | 9.5%(-7.74)#29 | 8.8%(-7.03)#1,512 |
| 30. | Wake Forest | 1.8% | 9.5%(-7.74)#30 | 8.8%(-7.02)#1,533 |
| 31. | Cedar Rock | 1.8% | 9.5%(-7.73)#31 | 8.8%(-7.01)#1,546 |
| 32. | Pine Knoll Shores | 1.8% | 9.5%(-7.73)#32 | 8.8%(-7.01)#1,553 |
| 33. | Porters Neck | 1.9% | 9.5%(-7.60)#33 | 8.8%(-6.88)#1,735 |
| 34. | Black Mountain | 2.0% | 9.5%(-7.54)#34 | 8.8%(-6.82)#1,829 |
| 35. | Rural Hall | 2.0% | 9.5%(-7.52)#35 | 8.8%(-6.80)#1,860 |
| 36. | Oak Ridge | 2.0% | 9.5%(-7.52)#36 | 8.8%(-6.80)#1,862 |
| 37. | Denver | 2.0% | 9.5%(-7.52)#37 | 8.8%(-6.80)#1,868 |
| 38. | Stokesdale | 2.0% | 9.5%(-7.48)#38 | 8.8%(-6.76)#1,912 |
| 39. | Mars Hill | 2.0% | 9.5%(-7.48)#39 | 8.8%(-6.76)#1,917 |
| 40. | Stedman | 2.0% | 9.5%(-7.46)#40 | 8.8%(-6.74)#1,947 |
| 41. | Bethania | 2.1% | 9.5%(-7.41)#41 | 8.8%(-6.70)#2,005 |
| 42. | Emma | 2.1% | 9.5%(-7.41)#42 | 8.8%(-6.69)#2,018 |
| 43. | Harrisburg | 2.1% | 9.5%(-7.40)#43 | 8.8%(-6.68)#2,036 |
| 44. | Governors Club | 2.2% | 9.5%(-7.33)#44 | 8.8%(-6.61)#2,130 |
| 45. | Lattimore | 2.2% | 9.5%(-7.32)#45 | 8.8%(-6.61)#2,140 |
| 46. | Sedalia | 2.2% | 9.5%(-7.32)#46 | 8.8%(-6.61)#2,141 |
| 47. | Garner | 2.2% | 9.5%(-7.32)#47 | 8.8%(-6.60)#2,154 |
| 48. | Rockwell | 2.2% | 9.5%(-7.31)#48 | 8.8%(-6.60)#2,161 |
| 49. | Woodlawn | 2.2% | 9.5%(-7.29)#49 | 8.8%(-6.58)#2,183 |
| 50. | Mulberry | 2.3% | 9.5%(-7.21)#50 | 8.8%(-6.50)#2,332 |
| 51. | Ogden | 2.3% | 9.5%(-7.21)#51 | 8.8%(-6.49)#2,339 |
| 52. | Oak City | 2.3% | 9.5%(-7.17)#52 | 8.8%(-6.46)#2,393 |
| 53. | St James | 2.5% | 9.5%(-7.03)#53 | 8.8%(-6.31)#2,628 |
| 54. | Weddington | 2.5% | 9.5%(-7.02)#54 | 8.8%(-6.30)#2,641 |
| 55. | Kure Beach | 2.5% | 9.5%(-7.00)#55 | 8.8%(-6.28)#2,676 |
| 56. | Alexis | 2.5% | 9.5%(-7.00)#56 | 8.8%(-6.28)#2,682 |
| 57. | Richfield | 2.5% | 9.5%(-6.97)#57 | 8.8%(-6.25)#2,731 |
| 58. | Stanley | 2.6% | 9.5%(-6.94)#58 | 8.8%(-6.22)#2,765 |
| 59. | Boardman | 2.6% | 9.5%(-6.93)#59 | 8.8%(-6.22)#2,790 |
| 60. | Valdese | 2.6% | 9.5%(-6.93)#60 | 8.8%(-6.21)#2,799 |
| 61. | Star | 2.6% | 9.5%(-6.92)#61 | 8.8%(-6.21)#2,805 |
| 62. | Wesley Chapel | 2.6% | 9.5%(-6.90)#62 | 8.8%(-6.18)#2,841 |
| 63. | Indian Beach | 2.6% | 9.5%(-6.90)#63 | 8.8%(-6.18)#2,848 |
| 64. | Bogue | 2.6% | 9.5%(-6.88)#64 | 8.8%(-6.16)#2,878 |
| 65. | Biltmore Forest | 2.7% | 9.5%(-6.84)#65 | 8.8%(-6.13)#2,942 |
| 66. | Southport | 2.7% | 9.5%(-6.84)#66 | 8.8%(-6.12)#2,956 |
| 67. | Jamestown | 2.7% | 9.5%(-6.78)#67 | 8.8%(-6.07)#3,049 |
| 68. | Midway | 2.7% | 9.5%(-6.78)#68 | 8.8%(-6.06)#3,056 |
| 69. | Red Cross | 2.7% | 9.5%(-6.75)#69 | 8.8%(-6.03)#3,107 |
| 70. | Sunset Beach | 2.8% | 9.5%(-6.73)#70 | 8.8%(-6.01)#3,145 |
| 71. | Deep Run | 2.8% | 9.5%(-6.72)#71 | 8.8%(-6.00)#3,157 |
| 72. | Harkers Island | 2.9% | 9.5%(-6.57)#72 | 8.8%(-5.86)#3,419 |
| 73. | Indian Trail | 2.9% | 9.5%(-6.57)#73 | 8.8%(-5.85)#3,435 |
| 74. | Buxton | 2.9% | 9.5%(-6.55)#74 | 8.8%(-5.83)#3,469 |
| 75. | Belville | 3.0% | 9.5%(-6.54)#75 | 8.8%(-5.83)#3,483 |
| 76. | Stem | 3.0% | 9.5%(-6.54)#76 | 8.8%(-5.82)#3,492 |
| 77. | Millers Creek | 3.0% | 9.5%(-6.53)#77 | 8.8%(-5.82)#3,496 |
| 78. | East Arcadia | 3.0% | 9.5%(-6.51)#78 | 8.8%(-5.80)#3,528 |
| 79. | King | 3.0% | 9.5%(-6.49)#79 | 8.8%(-5.77)#3,572 |
| 80. | Waxhaw | 3.0% | 9.5%(-6.47)#80 | 8.8%(-5.75)#3,594 |
| 81. | Duck | 3.0% | 9.5%(-6.47)#81 | 8.8%(-5.75)#3,602 |
| 82. | Midland | 3.0% | 9.5%(-6.47)#82 | 8.8%(-5.75)#3,612 |
| 83. | Huntersville | 3.1% | 9.5%(-6.45)#83 | 8.8%(-5.73)#3,635 |
| 84. | Lake Waccamaw | 3.1% | 9.5%(-6.44)#84 | 8.8%(-5.73)#3,640 |
| 85. | Lake Junaluska | 3.1% | 9.5%(-6.44)#85 | 8.8%(-5.72)#3,656 |
| 86. | Hillsborough | 3.1% | 9.5%(-6.39)#86 | 8.8%(-5.68)#3,721 |
| 87. | Fairfield Harbour | 3.1% | 9.5%(-6.39)#87 | 8.8%(-5.67)#3,737 |
| 88. | Mesic | 3.1% | 9.5%(-6.37)#88 | 8.8%(-5.66)#3,773 |
| 89. | Myrtle Grove | 3.1% | 9.5%(-6.36)#89 | 8.8%(-5.65)#3,789 |
| 90. | Holly Springs | 3.2% | 9.5%(-6.26)#90 | 8.8%(-5.54)#3,942 |
| 91. | Topsail Beach | 3.3% | 9.5%(-6.23)#91 | 8.8%(-5.51)#3,999 |
| 92. | Foscoe | 3.3% | 9.5%(-6.22)#92 | 8.8%(-5.51)#4,006 |
| 93. | Middlesex | 3.3% | 9.5%(-6.21)#93 | 8.8%(-5.50)#4,023 |
| 94. | Mcadenville | 3.3% | 9.5%(-6.18)#94 | 8.8%(-5.47)#4,066 |
| 95. | Boiling Springs | 3.3% | 9.5%(-6.15)#95 | 8.8%(-5.43)#4,144 |
| 96. | Sugar Mountain | 3.4% | 9.5%(-6.14)#96 | 8.8%(-5.43)#4,154 |
| 97. | Moyock | 3.4% | 9.5%(-6.14)#97 | 8.8%(-5.42)#4,158 |
| 98. | Millingport | 3.4% | 9.5%(-6.13)#98 | 8.8%(-5.41)#4,175 |
| 99. | Weaverville | 3.4% | 9.5%(-6.12)#99 | 8.8%(-5.40)#4,187 |
| 100. | Unionville | 3.4% | 9.5%(-6.09)#100 | 8.8%(-5.37)#4,240 |
Common Questions
What are the Top 10 Cities with the Lowest Poverty Level Among Families in North Carolina?
Top 10 Cities with the Lowest Poverty Level Among Families in North Carolina are:
#1
0.18%
#2
0.53%
#3
0.58%
#4
0.71%
#5
0.77%
#6
0.78%
#7
0.85%
#8
0.88%
#9
0.91%
#10
1.1%
What city has the Lowest Poverty Level Among Families in North Carolina?
Newport has the Lowest Poverty Level Among Families in North Carolina with 0.18%.
What is the Poverty Level Among Families in the State of North Carolina?
Poverty Level Among Families in North Carolina is 9.5%.
What is the Poverty Level Among Families in the United States?
Poverty Level Among Families in the United States is 8.8%.