Cities with the Most Immigrants from Taiwan in New Jersey
RELATED REPORTS & OPTIONS
Taiwan
New Jersey
Compare Cities
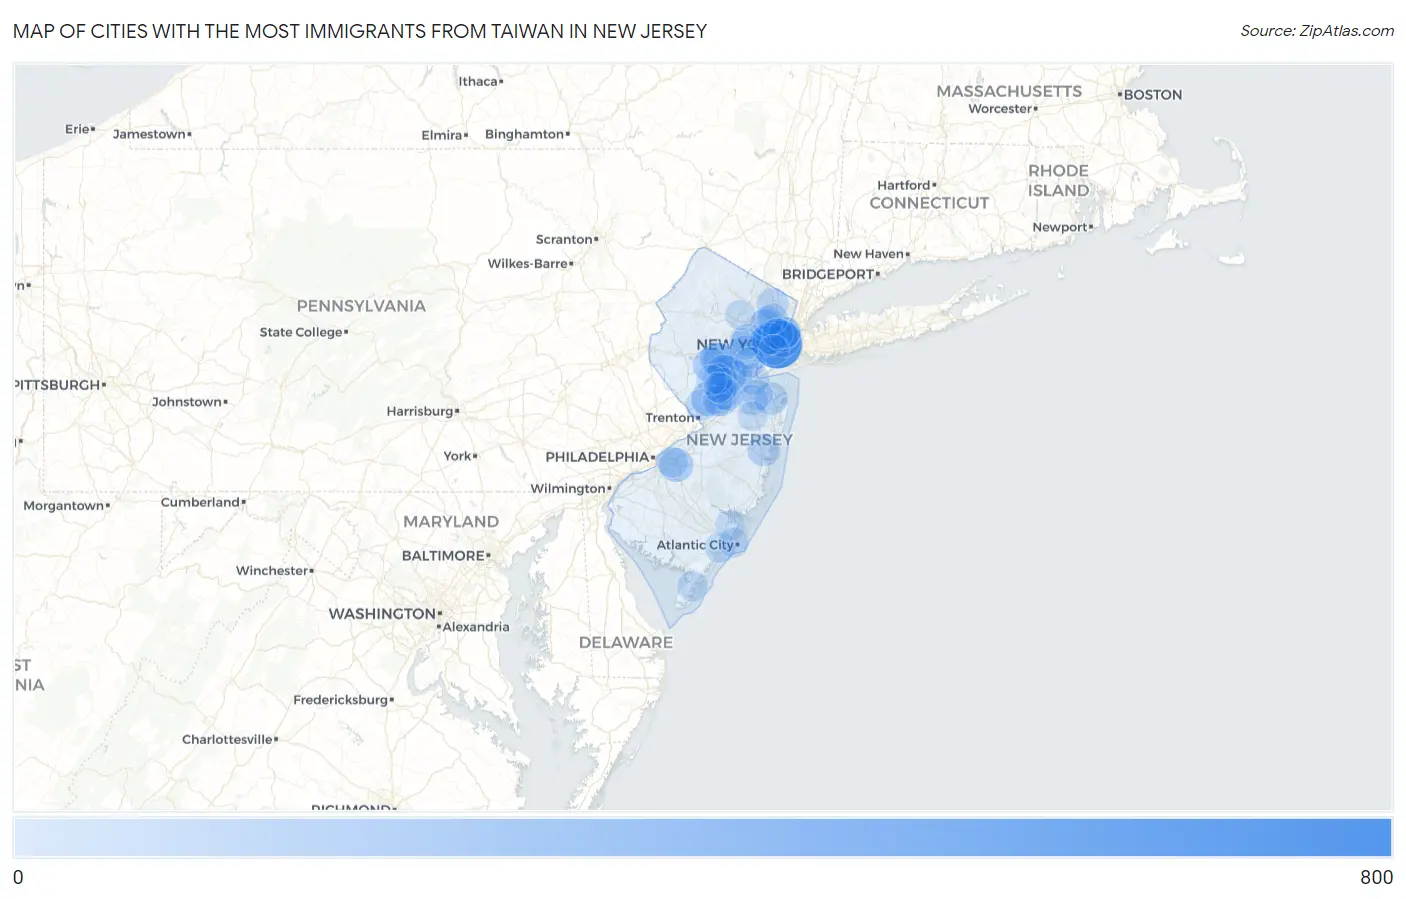
Map of Cities with the Most Immigrants from Taiwan in New Jersey
0
800
Cities with the Most Immigrants from Taiwan in New Jersey
| City | Taiwan | vs State | vs National | |
| 1. | Jersey City | 684 | 15,548(4.40%)#1 | 376,336(0.18%)#79 |
| 2. | Fort Lee Borough | 289 | 15,548(1.86%)#2 | 376,336(0.08%)#192 |
| 3. | Whippany | 279 | 15,548(1.79%)#3 | 376,336(0.07%)#198 |
| 4. | Hoboken | 244 | 15,548(1.57%)#4 | 376,336(0.06%)#220 |
| 5. | Parsippany | 225 | 15,548(1.45%)#5 | 376,336(0.06%)#242 |
| 6. | Somerset | 205 | 15,548(1.32%)#6 | 376,336(0.05%)#268 |
| 7. | Cedar Knolls | 196 | 15,548(1.26%)#7 | 376,336(0.05%)#278 |
| 8. | Princeton | 180 | 15,548(1.16%)#8 | 376,336(0.05%)#299 |
| 9. | Lake Hiawatha | 160 | 15,548(1.03%)#9 | 376,336(0.04%)#333 |
| 10. | Bradley Gardens | 151 | 15,548(0.97%)#10 | 376,336(0.04%)#347 |
| 11. | Edgewater Borough | 148 | 15,548(0.95%)#11 | 376,336(0.04%)#351 |
| 12. | Martinsville | 146 | 15,548(0.94%)#12 | 376,336(0.04%)#354 |
| 13. | Greentree | 146 | 15,548(0.94%)#13 | 376,336(0.04%)#355 |
| 14. | New Brunswick | 142 | 15,548(0.91%)#14 | 376,336(0.04%)#365 |
| 15. | Westfield | 141 | 15,548(0.91%)#15 | 376,336(0.04%)#370 |
| 16. | Englewood Cliffs Borough | 128 | 15,548(0.82%)#16 | 376,336(0.03%)#413 |
| 17. | Green Knoll | 123 | 15,548(0.79%)#17 | 376,336(0.03%)#423 |
| 18. | Franklin Center | 121 | 15,548(0.78%)#18 | 376,336(0.03%)#432 |
| 19. | Lincroft | 110 | 15,548(0.71%)#19 | 376,336(0.03%)#461 |
| 20. | Toms River | 100 | 15,548(0.64%)#20 | 376,336(0.03%)#496 |
| 21. | Palisades Park Borough | 100 | 15,548(0.64%)#21 | 376,336(0.03%)#499 |
| 22. | Florham Park Borough | 100 | 15,548(0.64%)#22 | 376,336(0.03%)#500 |
| 23. | Princeton Meadows | 96 | 15,548(0.62%)#23 | 376,336(0.03%)#511 |
| 24. | Monmouth Junction | 90 | 15,548(0.58%)#24 | 376,336(0.02%)#534 |
| 25. | Bergenfield Borough | 88 | 15,548(0.57%)#25 | 376,336(0.02%)#544 |
| 26. | Harrison | 88 | 15,548(0.57%)#26 | 376,336(0.02%)#545 |
| 27. | Short Hills | 88 | 15,548(0.57%)#27 | 376,336(0.02%)#546 |
| 28. | New Providence Borough | 82 | 15,548(0.53%)#28 | 376,336(0.02%)#584 |
| 29. | Ridgewood | 80 | 15,548(0.51%)#29 | 376,336(0.02%)#603 |
| 30. | Franklin Park | 77 | 15,548(0.50%)#30 | 376,336(0.02%)#624 |
| 31. | Montvale Borough | 77 | 15,548(0.50%)#31 | 376,336(0.02%)#626 |
| 32. | The Hills | 72 | 15,548(0.46%)#32 | 376,336(0.02%)#664 |
| 33. | Watchung Borough | 72 | 15,548(0.46%)#33 | 376,336(0.02%)#665 |
| 34. | Summit | 71 | 15,548(0.46%)#34 | 376,336(0.02%)#668 |
| 35. | Ridgefield Borough | 68 | 15,548(0.44%)#35 | 376,336(0.02%)#700 |
| 36. | Brookdale | 68 | 15,548(0.44%)#36 | 376,336(0.02%)#701 |
| 37. | Cliffside Park Borough | 67 | 15,548(0.43%)#37 | 376,336(0.02%)#707 |
| 38. | Highland Park Borough | 65 | 15,548(0.42%)#38 | 376,336(0.02%)#720 |
| 39. | Guttenberg | 65 | 15,548(0.42%)#39 | 376,336(0.02%)#721 |
| 40. | Paramus Borough | 63 | 15,548(0.41%)#40 | 376,336(0.02%)#745 |
| 41. | Chatham Borough | 63 | 15,548(0.41%)#41 | 376,336(0.02%)#750 |
| 42. | Dayton | 63 | 15,548(0.41%)#42 | 376,336(0.02%)#751 |
| 43. | South Amboy | 62 | 15,548(0.40%)#43 | 376,336(0.02%)#758 |
| 44. | Sicklerville | 61 | 15,548(0.39%)#44 | 376,336(0.02%)#761 |
| 45. | Roseland Borough | 60 | 15,548(0.39%)#45 | 376,336(0.02%)#771 |
| 46. | Franklin Lakes Borough | 59 | 15,548(0.38%)#46 | 376,336(0.02%)#783 |
| 47. | Oradell Borough | 55 | 15,548(0.35%)#47 | 376,336(0.01%)#825 |
| 48. | Hillsborough | 54 | 15,548(0.35%)#48 | 376,336(0.01%)#838 |
| 49. | Lawrenceville | 51 | 15,548(0.33%)#49 | 376,336(0.01%)#879 |
| 50. | Kingston Estates | 50 | 15,548(0.32%)#50 | 376,336(0.01%)#885 |
| 51. | Forsgate | 50 | 15,548(0.32%)#51 | 376,336(0.01%)#886 |
| 52. | Troy Hills | 49 | 15,548(0.32%)#52 | 376,336(0.01%)#894 |
| 53. | Newark | 48 | 15,548(0.31%)#53 | 376,336(0.01%)#895 |
| 54. | Raritan Borough | 48 | 15,548(0.31%)#54 | 376,336(0.01%)#904 |
| 55. | Haddon Heights Borough | 48 | 15,548(0.31%)#55 | 376,336(0.01%)#905 |
| 56. | West New York | 47 | 15,548(0.30%)#56 | 376,336(0.01%)#908 |
| 57. | Upper Saddle River Borough | 47 | 15,548(0.30%)#57 | 376,336(0.01%)#917 |
| 58. | Kearny | 46 | 15,548(0.30%)#58 | 376,336(0.01%)#922 |
| 59. | Union City | 45 | 15,548(0.29%)#59 | 376,336(0.01%)#933 |
| 60. | Lodi Borough | 44 | 15,548(0.28%)#60 | 376,336(0.01%)#951 |
| 61. | Matawan Borough | 44 | 15,548(0.28%)#61 | 376,336(0.01%)#957 |
| 62. | South Plainfield Borough | 42 | 15,548(0.27%)#62 | 376,336(0.01%)#971 |
| 63. | Clifton | 41 | 15,548(0.26%)#63 | 376,336(0.01%)#983 |
| 64. | Garfield | 41 | 15,548(0.26%)#64 | 376,336(0.01%)#991 |
| 65. | Robertsville | 41 | 15,548(0.26%)#65 | 376,336(0.01%)#1,000 |
| 66. | Bridgewater Center | 41 | 15,548(0.26%)#66 | 376,336(0.01%)#1,003 |
| 67. | Morganville | 41 | 15,548(0.26%)#67 | 376,336(0.01%)#1,004 |
| 68. | Metuchen Borough | 39 | 15,548(0.25%)#68 | 376,336(0.01%)#1,027 |
| 69. | Bound Brook Borough | 38 | 15,548(0.24%)#69 | 376,336(0.01%)#1,047 |
| 70. | Kendall Park | 37 | 15,548(0.24%)#70 | 376,336(0.01%)#1,070 |
| 71. | Leonia Borough | 35 | 15,548(0.23%)#71 | 376,336(0.01%)#1,109 |
| 72. | Carlstadt Borough | 35 | 15,548(0.23%)#72 | 376,336(0.01%)#1,110 |
| 73. | Mountain Lakes Borough | 35 | 15,548(0.23%)#73 | 376,336(0.01%)#1,111 |
| 74. | Great Notch | 34 | 15,548(0.22%)#74 | 376,336(0.01%)#1,132 |
| 75. | Secaucus | 33 | 15,548(0.21%)#75 | 376,336(0.01%)#1,149 |
| 76. | Colonia | 32 | 15,548(0.21%)#76 | 376,336(0.01%)#1,175 |
| 77. | Roselle Park Borough | 32 | 15,548(0.21%)#77 | 376,336(0.01%)#1,176 |
| 78. | Caldwell Borough | 32 | 15,548(0.21%)#78 | 376,336(0.01%)#1,177 |
| 79. | Linwood | 32 | 15,548(0.21%)#79 | 376,336(0.01%)#1,181 |
| 80. | Glen Rock Borough | 30 | 15,548(0.19%)#80 | 376,336(0.01%)#1,227 |
| 81. | Totowa Borough | 30 | 15,548(0.19%)#81 | 376,336(0.01%)#1,229 |
| 82. | Towaco | 30 | 15,548(0.19%)#82 | 376,336(0.01%)#1,233 |
| 83. | Cape May Court House | 29 | 15,548(0.19%)#83 | 376,336(0.01%)#1,251 |
| 84. | Smithville | 28 | 15,548(0.18%)#84 | 376,336(0.01%)#1,276 |
| 85. | Atco | 28 | 15,548(0.18%)#85 | 376,336(0.01%)#1,277 |
| 86. | Plainsboro Center | 27 | 15,548(0.17%)#86 | 376,336(0.01%)#1,311 |
| 87. | Blackwells Mills | 26 | 15,548(0.17%)#87 | 376,336(0.01%)#1,333 |
| 88. | Bayonne | 24 | 15,548(0.15%)#88 | 376,336(0.01%)#1,375 |
| 89. | Boonton | 24 | 15,548(0.15%)#89 | 376,336(0.01%)#1,385 |
| 90. | Morris Plains Borough | 24 | 15,548(0.15%)#90 | 376,336(0.01%)#1,388 |
| 91. | Atlantic City | 21 | 15,548(0.14%)#91 | 376,336(0.01%)#1,474 |
| 92. | Madison Borough | 21 | 15,548(0.14%)#92 | 376,336(0.01%)#1,479 |
| 93. | West Freehold | 21 | 15,548(0.14%)#93 | 376,336(0.01%)#1,480 |
| 94. | Belle Mead | 21 | 15,548(0.14%)#94 | 376,336(0.01%)#1,491 |
| 95. | Menlo Park Terrace | 21 | 15,548(0.14%)#95 | 376,336(0.01%)#1,495 |
| 96. | Ten Mile Run | 21 | 15,548(0.14%)#96 | 376,336(0.01%)#1,496 |
| 97. | Fair Lawn Borough | 20 | 15,548(0.13%)#97 | 376,336(0.01%)#1,507 |
| 98. | Tinton Falls Borough | 20 | 15,548(0.13%)#98 | 376,336(0.01%)#1,517 |
| 99. | Red Bank Borough | 20 | 15,548(0.13%)#99 | 376,336(0.01%)#1,524 |
| 100. | Bernardsville Borough | 20 | 15,548(0.13%)#100 | 376,336(0.01%)#1,533 |
Common Questions
What are the Top 10 Cities with the Most Immigrants from Taiwan in New Jersey?
Top 10 Cities with the Most Immigrants from Taiwan in New Jersey are:
#1
684
#2
244
#3
205
#4
180
#5
151
#6
146
#7
146
#8
142
#9
141
#10
123
What city has the Most Immigrants from Taiwan in New Jersey?
Jersey City has the Most Immigrants from Taiwan in New Jersey with 684.
What is the Total Immigrants from Taiwan in the State of New Jersey?
Total Immigrants from Taiwan in New Jersey is 15,548.
What is the Total Immigrants from Taiwan in the United States?
Total Immigrants from Taiwan in the United States is 376,336.