Cities with the Highest Percentage of Immigrants from Northern Africa in New Jersey
RELATED REPORTS & OPTIONS
Northern Africa
New Jersey
Compare Cities
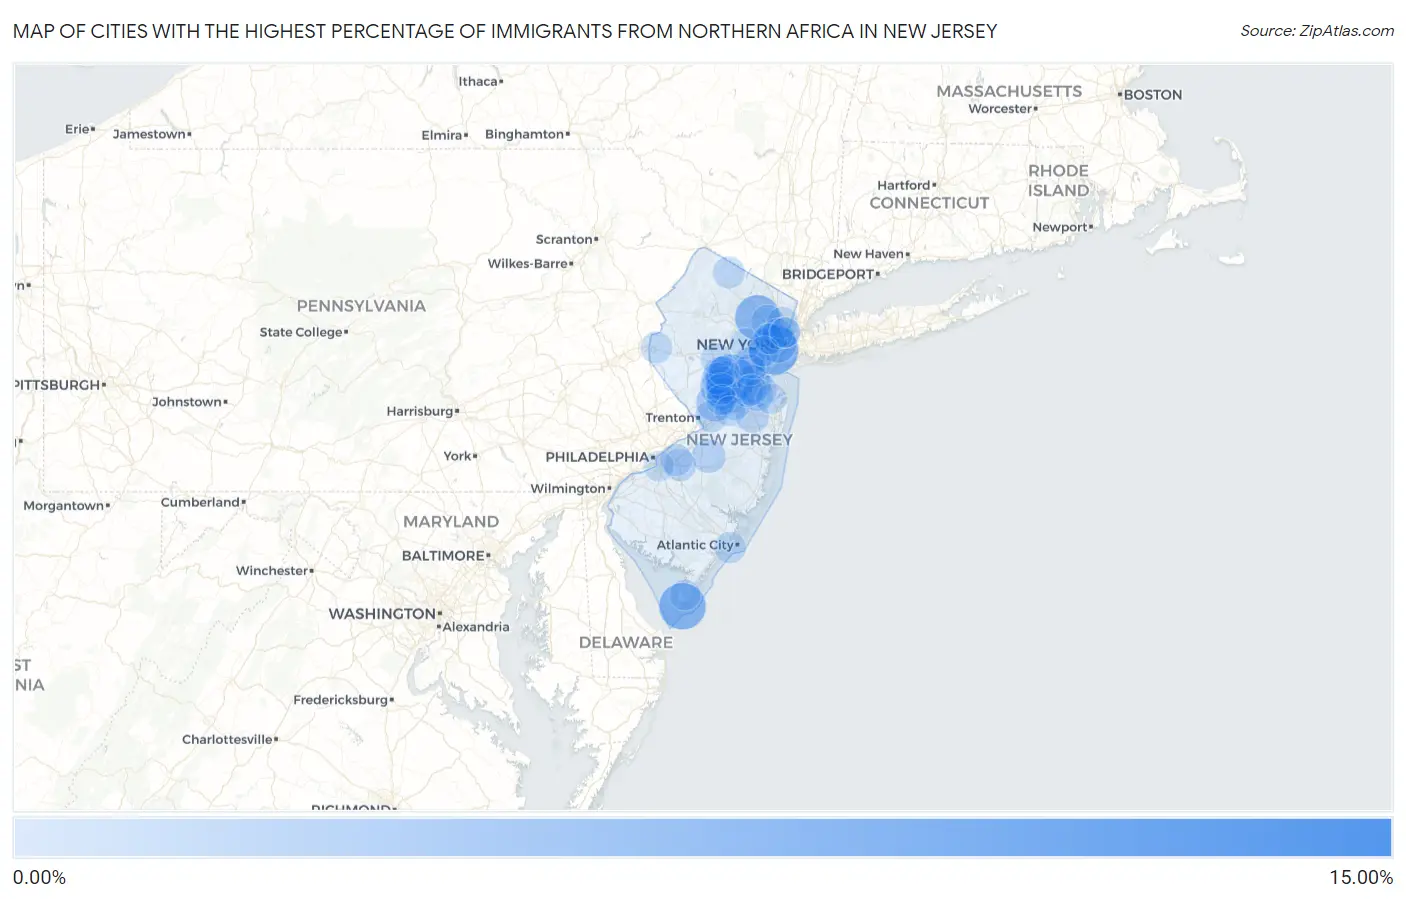
Map of Cities with the Highest Percentage of Immigrants from Northern Africa in New Jersey
0.00%
15.00%
Cities with the Highest Percentage of Immigrants from Northern Africa in New Jersey
| City | Northern Africa | vs State | vs National | |
| 1. | Union Beach Borough | 10.02% | 0.46%(+9.55)#-1 | 0.13%(+9.89)#0 |
| 2. | Bayonne | 6.32% | 0.46%(+5.86)#27 | 0.13%(+6.19)#746 |
| 3. | Milltown Borough | 6.24% | 0.46%(+5.78)#28 | 0.13%(+6.11)#747 |
| 4. | Voorhees | 6.12% | 0.46%(+5.66)#29 | 0.13%(+5.99)#748 |
| 5. | Andover Borough | 5.76% | 0.46%(+5.30)#30 | 0.13%(+5.63)#749 |
| 6. | Cape May | 5.40% | 0.46%(+4.94)#31 | 0.13%(+5.27)#750 |
| 7. | Singac | 4.91% | 0.46%(+4.45)#32 | 0.13%(+4.79)#751 |
| 8. | Six Mile Run | 2.94% | 0.46%(+2.48)#33 | 0.13%(+2.81)#752 |
| 9. | Encore At Monroe | 2.91% | 0.46%(+2.45)#34 | 0.13%(+2.78)#753 |
| 10. | Jersey City | 2.81% | 0.46%(+2.34)#35 | 0.13%(+2.68)#754 |
| 11. | Dayton | 2.73% | 0.46%(+2.27)#36 | 0.13%(+2.60)#755 |
| 12. | Princeton Junction | 2.67% | 0.46%(+2.21)#37 | 0.13%(+2.54)#756 |
| 13. | Madison Park | 2.54% | 0.46%(+2.08)#38 | 0.13%(+2.42)#757 |
| 14. | Helmetta Borough | 2.52% | 0.46%(+2.06)#39 | 0.13%(+2.39)#758 |
| 15. | Ten Mile Run | 2.45% | 0.46%(+1.99)#40 | 0.13%(+2.33)#759 |
| 16. | Tinton Falls Borough | 2.43% | 0.46%(+1.97)#41 | 0.13%(+2.30)#760 |
| 17. | Mount Arlington Borough | 2.32% | 0.46%(+1.86)#42 | 0.13%(+2.19)#761 |
| 18. | North Caldwell Borough | 2.31% | 0.46%(+1.85)#43 | 0.13%(+2.18)#762 |
| 19. | Monroe Manor | 2.28% | 0.46%(+1.81)#44 | 0.13%(+2.15)#763 |
| 20. | Moonachie Borough | 2.20% | 0.46%(+1.74)#45 | 0.13%(+2.07)#764 |
| 21. | Middlesex Borough | 1.99% | 0.46%(+1.53)#46 | 0.13%(+1.86)#765 |
| 22. | Carlstadt Borough | 1.91% | 0.46%(+1.45)#47 | 0.13%(+1.78)#766 |
| 23. | Saddle River Borough | 1.81% | 0.46%(+1.35)#48 | 0.13%(+1.69)#767 |
| 24. | Sayreville Borough | 1.80% | 0.46%(+1.34)#49 | 0.13%(+1.67)#768 |
| 25. | Franklin Park | 1.79% | 0.46%(+1.33)#50 | 0.13%(+1.66)#769 |
| 26. | East Newark Borough | 1.73% | 0.46%(+1.27)#51 | 0.13%(+1.60)#785 |
| 27. | Woodland Park Borough | 1.72% | 0.46%(+1.25)#52 | 0.13%(+1.59)#786 |
| 28. | Pemberton Heights | 1.55% | 0.46%(+1.09)#53 | 0.13%(+1.42)#787 |
| 29. | Preakness | 1.53% | 0.46%(+1.07)#54 | 0.13%(+1.40)#788 |
| 30. | Little Ferry Borough | 1.51% | 0.46%(+1.05)#55 | 0.13%(+1.38)#789 |
| 31. | Flemington Borough | 1.48% | 0.46%(+1.02)#56 | 0.13%(+1.35)#790 |
| 32. | North Arlington Borough | 1.48% | 0.46%(+1.02)#57 | 0.13%(+1.35)#791 |
| 33. | Englishtown Borough | 1.46% | 0.46%(+0.995)#58 | 0.13%(+1.33)#792 |
| 34. | Strathmore | 1.39% | 0.46%(+0.930)#59 | 0.13%(+1.26)#793 |
| 35. | South River Borough | 1.39% | 0.46%(+0.926)#60 | 0.13%(+1.26)#794 |
| 36. | Menlo Park Terrace | 1.38% | 0.46%(+0.919)#61 | 0.13%(+1.25)#795 |
| 37. | Jamesburg Borough | 1.37% | 0.46%(+0.905)#62 | 0.13%(+1.24)#796 |
| 38. | Fairview Borough | 1.31% | 0.46%(+0.852)#63 | 0.13%(+1.18)#797 |
| 39. | West Freehold | 1.29% | 0.46%(+0.833)#64 | 0.13%(+1.17)#798 |
| 40. | Wrightstown Borough | 1.28% | 0.46%(+0.824)#65 | 0.13%(+1.16)#799 |
| 41. | Allendale Borough | 1.28% | 0.46%(+0.815)#66 | 0.13%(+1.15)#800 |
| 42. | Mckee | 1.24% | 0.46%(+0.783)#67 | 0.13%(+1.12)#801 |
| 43. | Carlls Corner | 1.23% | 0.46%(+0.770)#68 | 0.13%(+1.10)#802 |
| 44. | Clifton | 1.18% | 0.46%(+0.716)#69 | 0.13%(+1.05)#994 |
| 45. | Monmouth Junction | 1.15% | 0.46%(+0.688)#70 | 0.13%(+1.02)#995 |
| 46. | Montvale Borough | 1.14% | 0.46%(+0.680)#71 | 0.13%(+1.01)#996 |
| 47. | Pleasantdale | 1.14% | 0.46%(+0.676)#72 | 0.13%(+1.01)#997 |
| 48. | Lodi Borough | 1.13% | 0.46%(+0.671)#73 | 0.13%(+1.00)#998 |
| 49. | Concordia | 1.11% | 0.46%(+0.646)#74 | 0.13%(+0.980)#999 |
| 50. | Avenel | 1.09% | 0.46%(+0.632)#75 | 0.13%(+0.965)#1,000 |
| 51. | Pine Beach Borough | 1.08% | 0.46%(+0.622)#76 | 0.13%(+0.955)#1,001 |
| 52. | Hamilton Square | 1.07% | 0.46%(+0.607)#77 | 0.13%(+0.940)#1,002 |
| 53. | Roselle Park Borough | 1.07% | 0.46%(+0.606)#78 | 0.13%(+0.940)#1,003 |
| 54. | Morganville | 1.05% | 0.46%(+0.587)#79 | 0.13%(+0.921)#1,004 |
| 55. | Marlton | 1.04% | 0.46%(+0.577)#80 | 0.13%(+0.911)#1,005 |
| 56. | Weston | 1.03% | 0.46%(+0.565)#81 | 0.13%(+0.899)#1,006 |
| 57. | Bridgewater Center | 1.02% | 0.46%(+0.555)#82 | 0.13%(+0.888)#1,007 |
| 58. | Ramblewood | 1.01% | 0.46%(+0.552)#83 | 0.13%(+0.885)#1,008 |
| 59. | Frenchtown Borough | 0.98% | 0.46%(+0.515)#84 | 0.13%(+0.849)#1,009 |
| 60. | Beach Haven Borough | 0.94% | 0.46%(+0.482)#85 | 0.13%(+0.815)#1,010 |
| 61. | Vernon Center | 0.94% | 0.46%(+0.477)#86 | 0.13%(+0.810)#1,011 |
| 62. | Blackwells Mills | 0.92% | 0.46%(+0.455)#87 | 0.13%(+0.788)#1,012 |
| 63. | Greenwich | 0.91% | 0.46%(+0.446)#88 | 0.13%(+0.780)#1,013 |
| 64. | Old Bridge | 0.88% | 0.46%(+0.418)#89 | 0.13%(+0.752)#1,014 |
| 65. | Ho Ho Kus Borough | 0.87% | 0.46%(+0.413)#90 | 0.13%(+0.746)#1,015 |
| 66. | Colonia | 0.87% | 0.46%(+0.406)#91 | 0.13%(+0.739)#1,044 |
| 67. | Macopin | 0.85% | 0.46%(+0.386)#92 | 0.13%(+0.719)#1,045 |
| 68. | Kearny | 0.83% | 0.46%(+0.370)#93 | 0.13%(+0.704)#1,046 |
| 69. | Ventnor City | 0.83% | 0.46%(+0.368)#94 | 0.13%(+0.702)#1,047 |
| 70. | Ridgefield Park | 0.80% | 0.46%(+0.337)#95 | 0.13%(+0.670)#1,048 |
| 71. | Fords | 0.79% | 0.46%(+0.329)#96 | 0.13%(+0.662)#1,049 |
| 72. | Monmouth Beach Borough | 0.78% | 0.46%(+0.321)#97 | 0.13%(+0.654)#1,050 |
| 73. | Wallington Borough | 0.78% | 0.46%(+0.316)#98 | 0.13%(+0.650)#1,051 |
| 74. | Green Knoll | 0.75% | 0.46%(+0.293)#99 | 0.13%(+0.626)#1,052 |
| 75. | Kendall Park | 0.75% | 0.46%(+0.292)#100 | 0.13%(+0.626)#1,053 |
| 76. | Summit | 0.75% | 0.46%(+0.288)#101 | 0.13%(+0.622)#1,054 |
| 77. | Brownville | 0.73% | 0.46%(+0.272)#102 | 0.13%(+0.606)#1,055 |
| 78. | Berlin Borough | 0.69% | 0.46%(+0.234)#103 | 0.13%(+0.567)#1,056 |
| 79. | Rio Grande | 0.68% | 0.46%(+0.223)#104 | 0.13%(+0.556)#1,057 |
| 80. | Pines Lake | 0.66% | 0.46%(+0.198)#105 | 0.13%(+0.532)#1,058 |
| 81. | Haworth Borough | 0.63% | 0.46%(+0.168)#106 | 0.13%(+0.501)#1,059 |
| 82. | River Edge Borough | 0.62% | 0.46%(+0.163)#107 | 0.13%(+0.496)#1,060 |
| 83. | Secaucus | 0.61% | 0.46%(+0.145)#108 | 0.13%(+0.478)#1,061 |
| 84. | Harrison | 0.59% | 0.46%(+0.132)#109 | 0.13%(+0.466)#1,062 |
| 85. | Hillsborough | 0.56% | 0.46%(+0.097)#110 | 0.13%(+0.431)#1,063 |
| 86. | Guttenberg | 0.55% | 0.46%(+0.092)#111 | 0.13%(+0.425)#1,064 |
| 87. | Gloucester City | 0.54% | 0.46%(+0.081)#112 | 0.13%(+0.415)#1,065 |
| 88. | Lincroft | 0.53% | 0.46%(+0.069)#113 | 0.13%(+0.403)#1,066 |
| 89. | Princeton Meadows | 0.53% | 0.46%(+0.065)#114 | 0.13%(+0.399)#1,067 |
| 90. | Twin Rivers | 0.52% | 0.46%(+0.055)#115 | 0.13%(+0.388)#1,068 |
| 91. | Spring Lake Heights Borough | 0.51% | 0.46%(+0.053)#116 | 0.13%(+0.387)#1,069 |
| 92. | Highland Park Borough | 0.51% | 0.46%(+0.053)#117 | 0.13%(+0.386)#1,070 |
| 93. | Basking Ridge | 0.51% | 0.46%(+0.045)#118 | 0.13%(+0.379)#1,071 |
| 94. | Franklin Lakes Borough | 0.49% | 0.46%(+0.030)#119 | 0.13%(+0.363)#1,072 |
| 95. | Woodstown Borough | 0.49% | 0.46%(+0.028)#120 | 0.13%(+0.362)#1,073 |
| 96. | Troy Hills | 0.48% | 0.46%(+0.019)#121 | 0.13%(+0.353)#1,074 |
| 97. | West New York | 0.48% | 0.46%(+0.016)#122 | 0.13%(+0.349)#1,075 |
| 98. | Spotswood Borough | 0.47% | 0.46%(+0.006)#123 | 0.13%(+0.340)#1,076 |
| 99. | Franklin Center | 0.47% | 0.46%(+0.005)#124 | 0.13%(+0.338)#1,077 |
| 100. | Elizabeth | 0.46% | 0.46%(+0.003)#125 | 0.13%(+0.336)#1,078 |
Common Questions
What are the Top 10 Cities with the Highest Percentage of Immigrants from Northern Africa in New Jersey?
Top 10 Cities with the Highest Percentage of Immigrants from Northern Africa in New Jersey are:
#1
6.32%
#2
6.12%
#3
5.40%
#4
4.91%
#5
2.94%
#6
2.81%
#7
2.73%
#8
2.67%
#9
2.54%
#10
2.45%
What city has the Highest Percentage of Immigrants from Northern Africa in New Jersey?
Bayonne has the Highest Percentage of Immigrants from Northern Africa in New Jersey with 6.32%.
What is the Percentage of Immigrants from Northern Africa in the State of New Jersey?
Percentage of Immigrants from Northern Africa in New Jersey is 0.46%.
What is the Percentage of Immigrants from Northern Africa in the United States?
Percentage of Immigrants from Northern Africa in the United States is 0.13%.