Cities with the Most Immigrants from France in New Jersey
RELATED REPORTS & OPTIONS
France
New Jersey
Compare Cities
Map of Cities with the Most Immigrants from France in New Jersey
0
800
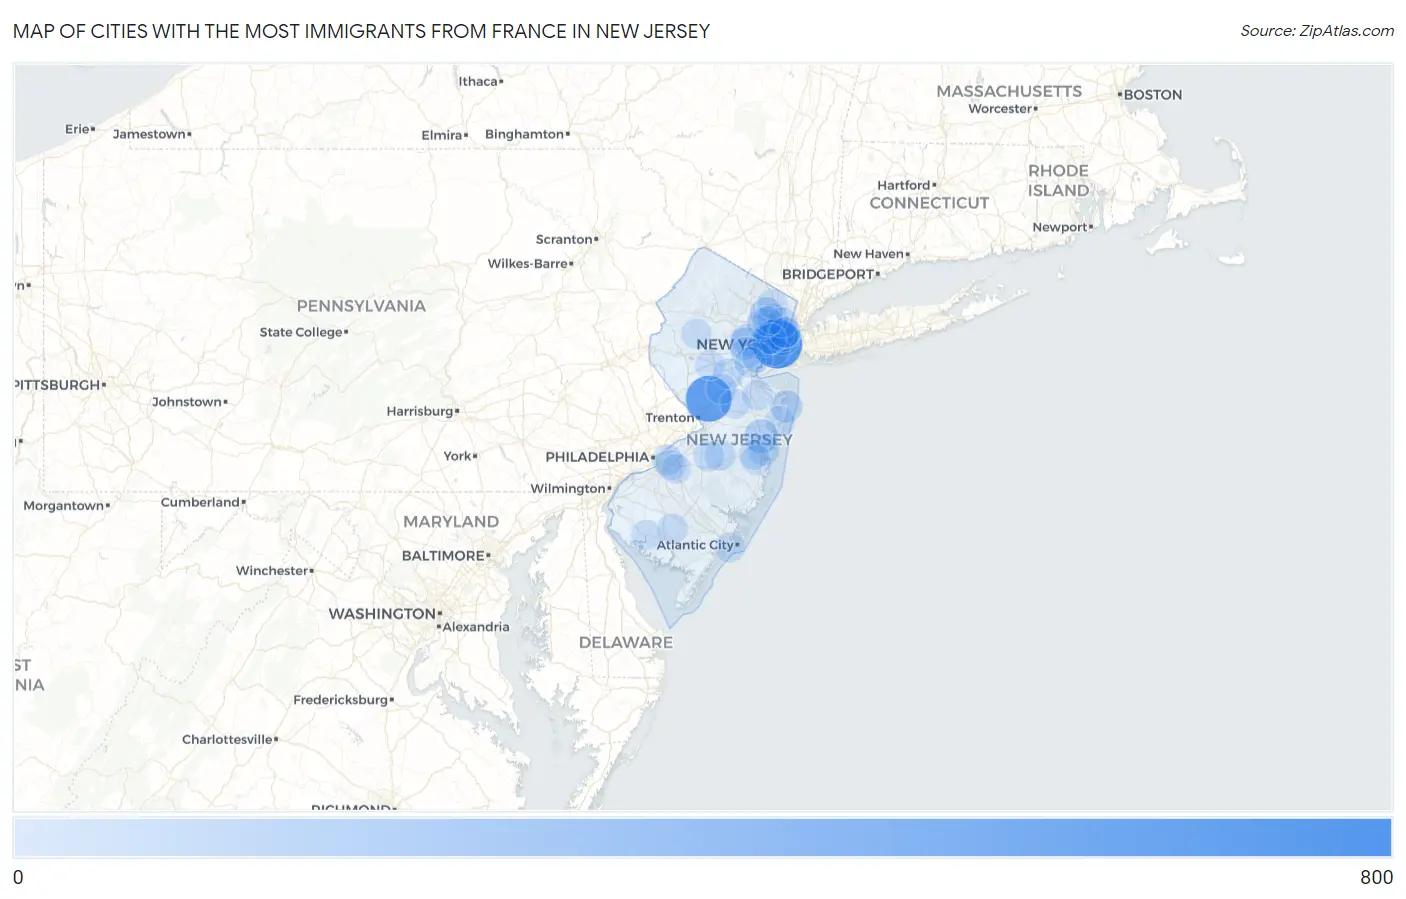
Cities with the Most Immigrants from France in New Jersey
| City | France | vs State | vs National | |
| 1. | Jersey City | 728 | 6,882(10.58%)#1 | 184,998(0.39%)#21 |
| 2. | Princeton | 592 | 6,882(8.60%)#2 | 184,998(0.32%)#27 |
| 3. | Cliffside Park Borough | 178 | 6,882(2.59%)#3 | 184,998(0.10%)#139 |
| 4. | Highlands Borough | 171 | 6,882(2.48%)#4 | 184,998(0.09%)#148 |
| 5. | Lakewood | 135 | 6,882(1.96%)#5 | 184,998(0.07%)#197 |
| 6. | Hoboken | 123 | 6,882(1.79%)#6 | 184,998(0.07%)#214 |
| 7. | Paterson | 104 | 6,882(1.51%)#7 | 184,998(0.06%)#251 |
| 8. | Long Branch | 90 | 6,882(1.31%)#8 | 184,998(0.05%)#288 |
| 9. | Secaucus | 82 | 6,882(1.19%)#9 | 184,998(0.04%)#329 |
| 10. | Summit | 79 | 6,882(1.15%)#10 | 184,998(0.04%)#339 |
| 11. | Madison Borough | 79 | 6,882(1.15%)#11 | 184,998(0.04%)#341 |
| 12. | Short Hills | 76 | 6,882(1.10%)#12 | 184,998(0.04%)#352 |
| 13. | Kenilworth Borough | 68 | 6,882(0.99%)#13 | 184,998(0.04%)#404 |
| 14. | Bayonne | 66 | 6,882(0.96%)#14 | 184,998(0.04%)#412 |
| 15. | Rocky Hill Borough | 66 | 6,882(0.96%)#15 | 184,998(0.04%)#416 |
| 16. | Ledgewood | 61 | 6,882(0.89%)#16 | 184,998(0.03%)#447 |
| 17. | Newark | 59 | 6,882(0.86%)#17 | 184,998(0.03%)#458 |
| 18. | Harrison | 56 | 6,882(0.81%)#18 | 184,998(0.03%)#493 |
| 19. | New Providence Borough | 55 | 6,882(0.80%)#19 | 184,998(0.03%)#509 |
| 20. | Glen Ridge Borough | 55 | 6,882(0.80%)#20 | 184,998(0.03%)#511 |
| 21. | Upper Montclair | 51 | 6,882(0.74%)#21 | 184,998(0.03%)#543 |
| 22. | Toms River | 47 | 6,882(0.68%)#22 | 184,998(0.03%)#575 |
| 23. | Rutherford Borough | 47 | 6,882(0.68%)#23 | 184,998(0.03%)#582 |
| 24. | Cresskill Borough | 47 | 6,882(0.68%)#24 | 184,998(0.03%)#584 |
| 25. | Ridgefield Borough | 46 | 6,882(0.67%)#25 | 184,998(0.02%)#593 |
| 26. | West New York | 45 | 6,882(0.65%)#26 | 184,998(0.02%)#604 |
| 27. | The Hills | 44 | 6,882(0.64%)#27 | 184,998(0.02%)#621 |
| 28. | Allendale Borough | 44 | 6,882(0.64%)#28 | 184,998(0.02%)#622 |
| 29. | Union City | 42 | 6,882(0.61%)#29 | 184,998(0.02%)#636 |
| 30. | Westfield | 42 | 6,882(0.61%)#30 | 184,998(0.02%)#641 |
| 31. | Browns Mills | 42 | 6,882(0.61%)#31 | 184,998(0.02%)#646 |
| 32. | Little Ferry Borough | 41 | 6,882(0.60%)#32 | 184,998(0.02%)#666 |
| 33. | Morris Plains Borough | 38 | 6,882(0.55%)#33 | 184,998(0.02%)#705 |
| 34. | Fort Lee Borough | 37 | 6,882(0.54%)#34 | 184,998(0.02%)#718 |
| 35. | Golden Triangle | 37 | 6,882(0.54%)#35 | 184,998(0.02%)#731 |
| 36. | Union Beach Borough | 36 | 6,882(0.52%)#36 | 184,998(0.02%)#754 |
| 37. | Westmont | 34 | 6,882(0.49%)#37 | 184,998(0.02%)#786 |
| 38. | Garfield | 33 | 6,882(0.48%)#38 | 184,998(0.02%)#797 |
| 39. | Somerset | 33 | 6,882(0.48%)#39 | 184,998(0.02%)#800 |
| 40. | Glassboro Borough | 33 | 6,882(0.48%)#40 | 184,998(0.02%)#801 |
| 41. | Pemberton Heights | 33 | 6,882(0.48%)#41 | 184,998(0.02%)#813 |
| 42. | Colonia | 31 | 6,882(0.45%)#42 | 184,998(0.02%)#841 |
| 43. | Mountainside Borough | 31 | 6,882(0.45%)#43 | 184,998(0.02%)#846 |
| 44. | Parsippany | 30 | 6,882(0.44%)#44 | 184,998(0.02%)#863 |
| 45. | Paramus Borough | 28 | 6,882(0.41%)#45 | 184,998(0.02%)#903 |
| 46. | Morganville | 27 | 6,882(0.39%)#46 | 184,998(0.01%)#941 |
| 47. | Hillsborough | 26 | 6,882(0.38%)#47 | 184,998(0.01%)#962 |
| 48. | Kendall Park | 26 | 6,882(0.38%)#48 | 184,998(0.01%)#966 |
| 49. | Caldwell Borough | 26 | 6,882(0.38%)#49 | 184,998(0.01%)#968 |
| 50. | Little Silver Borough | 26 | 6,882(0.38%)#50 | 184,998(0.01%)#970 |
| 51. | Vineland | 25 | 6,882(0.36%)#51 | 184,998(0.01%)#982 |
| 52. | Carlstadt Borough | 24 | 6,882(0.35%)#52 | 184,998(0.01%)#1,040 |
| 53. | Sayreville Borough | 22 | 6,882(0.32%)#53 | 184,998(0.01%)#1,092 |
| 54. | Matawan Borough | 22 | 6,882(0.32%)#54 | 184,998(0.01%)#1,104 |
| 55. | Haddon Heights Borough | 22 | 6,882(0.32%)#55 | 184,998(0.01%)#1,107 |
| 56. | Towaco | 22 | 6,882(0.32%)#56 | 184,998(0.01%)#1,109 |
| 57. | Guttenberg | 21 | 6,882(0.31%)#57 | 184,998(0.01%)#1,143 |
| 58. | Hillsdale Borough | 20 | 6,882(0.29%)#58 | 184,998(0.01%)#1,184 |
| 59. | Linden | 19 | 6,882(0.28%)#59 | 184,998(0.01%)#1,206 |
| 60. | Edgewater Borough | 19 | 6,882(0.28%)#60 | 184,998(0.01%)#1,224 |
| 61. | Collingswood Borough | 19 | 6,882(0.28%)#61 | 184,998(0.01%)#1,225 |
| 62. | Lincoln Park Borough | 18 | 6,882(0.26%)#62 | 184,998(0.01%)#1,273 |
| 63. | Closter Borough | 18 | 6,882(0.26%)#63 | 184,998(0.01%)#1,279 |
| 64. | Shark River Hills | 18 | 6,882(0.26%)#64 | 184,998(0.01%)#1,289 |
| 65. | Ridgewood | 17 | 6,882(0.25%)#65 | 184,998(0.01%)#1,317 |
| 66. | North Arlington Borough | 16 | 6,882(0.23%)#66 | 184,998(0.01%)#1,402 |
| 67. | Bridgeton | 15 | 6,882(0.22%)#67 | 184,998(0.01%)#1,454 |
| 68. | Metuchen Borough | 15 | 6,882(0.22%)#68 | 184,998(0.01%)#1,467 |
| 69. | Ridgefield Park | 15 | 6,882(0.22%)#69 | 184,998(0.01%)#1,469 |
| 70. | Ringwood Borough | 15 | 6,882(0.22%)#70 | 184,998(0.01%)#1,474 |
| 71. | Neshanic Station | 15 | 6,882(0.22%)#71 | 184,998(0.01%)#1,484 |
| 72. | Kearny | 14 | 6,882(0.20%)#72 | 184,998(0.01%)#1,515 |
| 73. | Englewood Cliffs Borough | 14 | 6,882(0.20%)#73 | 184,998(0.01%)#1,548 |
| 74. | Pompton Lakes Borough | 13 | 6,882(0.19%)#74 | 184,998(0.01%)#1,614 |
| 75. | Concordia | 13 | 6,882(0.19%)#75 | 184,998(0.01%)#1,633 |
| 76. | Hawthorne Borough | 12 | 6,882(0.17%)#76 | 184,998(0.01%)#1,668 |
| 77. | Franklin Borough | 12 | 6,882(0.17%)#77 | 184,998(0.01%)#1,703 |
| 78. | Holiday Heights | 12 | 6,882(0.17%)#78 | 184,998(0.01%)#1,710 |
| 79. | Wallington Borough | 11 | 6,882(0.16%)#79 | 184,998(0.01%)#1,756 |
| 80. | Great Notch | 11 | 6,882(0.16%)#80 | 184,998(0.01%)#1,784 |
| 81. | Haworth Borough | 11 | 6,882(0.16%)#81 | 184,998(0.01%)#1,787 |
| 82. | Pleasantdale | 11 | 6,882(0.16%)#82 | 184,998(0.01%)#1,792 |
| 83. | Sussex Borough | 11 | 6,882(0.16%)#83 | 184,998(0.01%)#1,796 |
| 84. | Clifton | 10 | 6,882(0.15%)#84 | 184,998(0.01%)#1,814 |
| 85. | Elmwood Park Borough | 10 | 6,882(0.15%)#85 | 184,998(0.01%)#1,847 |
| 86. | South River Borough | 10 | 6,882(0.15%)#86 | 184,998(0.01%)#1,853 |
| 87. | Bradley Gardens | 10 | 6,882(0.15%)#87 | 184,998(0.01%)#1,858 |
| 88. | Holiday City Berkeley | 10 | 6,882(0.15%)#88 | 184,998(0.01%)#1,867 |
| 89. | Basking Ridge | 10 | 6,882(0.15%)#89 | 184,998(0.01%)#1,878 |
| 90. | Barclay | 10 | 6,882(0.15%)#90 | 184,998(0.01%)#1,890 |
| 91. | Bradley Beach Borough | 10 | 6,882(0.15%)#91 | 184,998(0.01%)#1,893 |
| 92. | Springdale | 9 | 6,882(0.13%)#92 | 184,998(0.00%)#1,957 |
| 93. | Haddonfield Borough | 9 | 6,882(0.13%)#93 | 184,998(0.00%)#1,961 |
| 94. | River Edge Borough | 9 | 6,882(0.13%)#94 | 184,998(0.00%)#1,963 |
| 95. | Kinnelon Borough | 9 | 6,882(0.13%)#95 | 184,998(0.00%)#1,968 |
| 96. | Shrewsbury Borough | 9 | 6,882(0.13%)#96 | 184,998(0.00%)#1,983 |
| 97. | Long Valley | 9 | 6,882(0.13%)#97 | 184,998(0.00%)#1,993 |
| 98. | Eatontown Borough | 8 | 6,882(0.12%)#98 | 184,998(0.00%)#2,058 |
| 99. | Ventnor City | 8 | 6,882(0.12%)#99 | 184,998(0.00%)#2,068 |
| 100. | Fair Haven Borough | 8 | 6,882(0.12%)#100 | 184,998(0.00%)#2,080 |
Common Questions
What are the Top 10 Cities with the Most Immigrants from France in New Jersey?
Top 10 Cities with the Most Immigrants from France in New Jersey are:
#1
728
#2
592
#3
135
#4
123
#5
104
#6
90
#7
82
#8
79
#9
76
#10
66
What city has the Most Immigrants from France in New Jersey?
Jersey City has the Most Immigrants from France in New Jersey with 728.
What is the Total Immigrants from France in the State of New Jersey?
Total Immigrants from France in New Jersey is 6,882.
What is the Total Immigrants from France in the United States?
Total Immigrants from France in the United States is 184,998.