Cities with the Highest Percentage of Greek Population in New Jersey
RELATED REPORTS & OPTIONS
Greek
New Jersey
Compare Cities
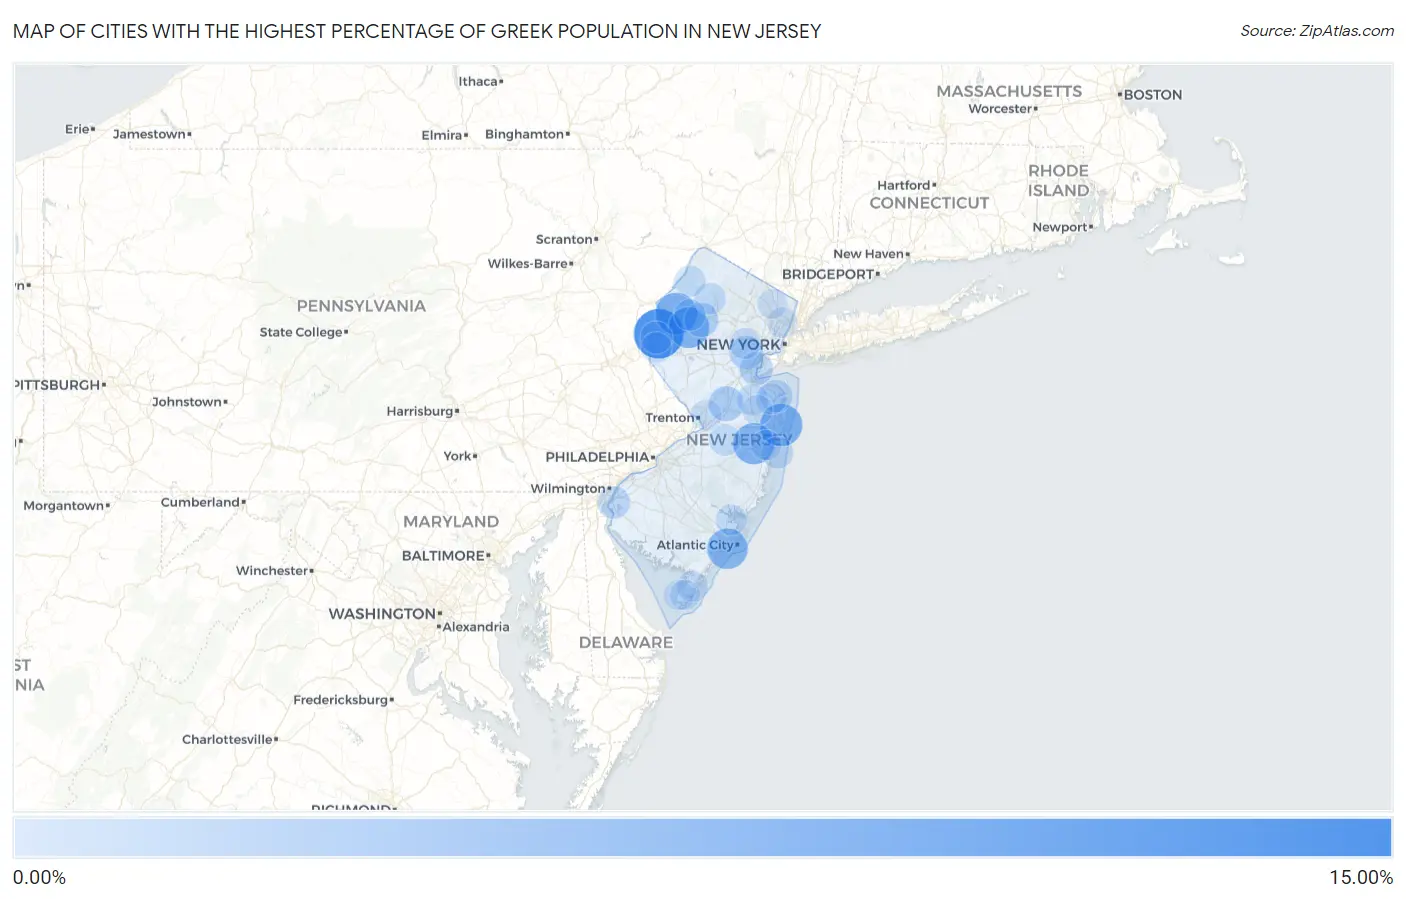
Map of Cities with the Highest Percentage of Greek Population in New Jersey
0.00%
15.00%
Cities with the Highest Percentage of Greek Population in New Jersey
| City | Greek | vs State | vs National | |
| 1. | Sweetwater | 10.48% | 0.64%(+9.84)#1 | 0.37%(+10.1)#41 |
| 2. | Hutchinson | 10.43% | 0.64%(+9.79)#2 | 0.37%(+10.1)#42 |
| 3. | Saddle River Borough | 10.17% | 0.64%(+9.53)#3 | 0.37%(+9.80)#43 |
| 4. | South Seaville | 7.74% | 0.64%(+7.10)#4 | 0.37%(+7.37)#67 |
| 5. | Seaside Heights Borough | 7.20% | 0.64%(+6.56)#5 | 0.37%(+6.83)#75 |
| 6. | West Belmar | 6.98% | 0.64%(+6.34)#6 | 0.37%(+6.61)#82 |
| 7. | Hope | 6.85% | 0.64%(+6.21)#7 | 0.37%(+6.48)#84 |
| 8. | Connecticut Farms | 6.76% | 0.64%(+6.12)#8 | 0.37%(+6.39)#87 |
| 9. | Cedar Glen West | 6.58% | 0.64%(+5.94)#9 | 0.37%(+6.21)#94 |
| 10. | Beattystown | 6.41% | 0.64%(+5.77)#10 | 0.37%(+6.04)#97 |
| 11. | Margate City | 6.23% | 0.64%(+5.59)#11 | 0.37%(+5.86)#107 |
| 12. | Glen Ridge Borough | 5.99% | 0.64%(+5.35)#12 | 0.37%(+5.62)#118 |
| 13. | Clearbrook | 5.11% | 0.64%(+4.47)#13 | 0.37%(+4.74)#178 |
| 14. | Jobstown | 4.90% | 0.64%(+4.25)#14 | 0.37%(+4.52)#192 |
| 15. | Brookside | 4.76% | 0.64%(+4.12)#15 | 0.37%(+4.39)#203 |
| 16. | Emerson Borough | 4.50% | 0.64%(+3.86)#16 | 0.37%(+4.13)#219 |
| 17. | Englewood Cliffs Borough | 4.45% | 0.64%(+3.81)#17 | 0.37%(+4.08)#225 |
| 18. | Oceanport Borough | 4.35% | 0.64%(+3.71)#18 | 0.37%(+3.98)#231 |
| 19. | Bay Head Borough | 4.29% | 0.64%(+3.65)#19 | 0.37%(+3.92)#233 |
| 20. | Cranford | 4.28% | 0.64%(+3.64)#20 | 0.37%(+3.91)#234 |
| 21. | Flanders | 3.80% | 0.64%(+3.16)#21 | 0.37%(+3.43)#295 |
| 22. | Allendale Borough | 3.67% | 0.64%(+3.03)#22 | 0.37%(+3.30)#315 |
| 23. | Cranbury | 3.66% | 0.64%(+3.02)#23 | 0.37%(+3.29)#317 |
| 24. | South River Borough | 3.49% | 0.64%(+2.85)#24 | 0.37%(+3.12)#342 |
| 25. | Roosevelt Borough | 3.47% | 0.64%(+2.83)#25 | 0.37%(+3.10)#350 |
| 26. | Little Silver Borough | 3.46% | 0.64%(+2.82)#26 | 0.37%(+3.09)#352 |
| 27. | Rainbow Lakes | 3.45% | 0.64%(+2.81)#27 | 0.37%(+3.08)#353 |
| 28. | Gillette | 3.41% | 0.64%(+2.77)#28 | 0.37%(+3.04)#358 |
| 29. | Wildwood Crest Borough | 3.32% | 0.64%(+2.68)#29 | 0.37%(+2.95)#379 |
| 30. | Budd Lake | 3.31% | 0.64%(+2.66)#30 | 0.37%(+2.93)#381 |
| 31. | Milltown Borough | 3.11% | 0.64%(+2.47)#31 | 0.37%(+2.74)#418 |
| 32. | Westfield | 3.07% | 0.64%(+2.43)#32 | 0.37%(+2.70)#429 |
| 33. | Harrington Park Borough | 3.03% | 0.64%(+2.38)#33 | 0.37%(+2.65)#437 |
| 34. | Sewaren | 2.97% | 0.64%(+2.33)#34 | 0.37%(+2.60)#449 |
| 35. | Wenonah Borough | 2.89% | 0.64%(+2.25)#35 | 0.37%(+2.52)#470 |
| 36. | Maywood Borough | 2.89% | 0.64%(+2.25)#36 | 0.37%(+2.52)#472 |
| 37. | Mickleton | 2.88% | 0.64%(+2.24)#37 | 0.37%(+2.51)#475 |
| 38. | Whippany | 2.87% | 0.64%(+2.23)#38 | 0.37%(+2.50)#480 |
| 39. | Rockleigh Borough | 2.82% | 0.64%(+2.18)#39 | 0.37%(+2.45)#500 |
| 40. | Spotswood Borough | 2.73% | 0.64%(+2.09)#40 | 0.37%(+2.36)#531 |
| 41. | Brielle Borough | 2.72% | 0.64%(+2.08)#41 | 0.37%(+2.35)#535 |
| 42. | Franklin Lakes Borough | 2.66% | 0.64%(+2.02)#42 | 0.37%(+2.29)#553 |
| 43. | Fairview | 2.60% | 0.64%(+1.96)#43 | 0.37%(+2.23)#575 |
| 44. | Pennsville | 2.58% | 0.64%(+1.94)#44 | 0.37%(+2.21)#580 |
| 45. | Old Tappan Borough | 2.47% | 0.64%(+1.83)#45 | 0.37%(+2.10)#620 |
| 46. | Harmony | 2.43% | 0.64%(+1.79)#46 | 0.37%(+2.06)#635 |
| 47. | Allentown Borough | 2.42% | 0.64%(+1.78)#47 | 0.37%(+2.05)#638 |
| 48. | Silver Lake | 2.37% | 0.64%(+1.73)#48 | 0.37%(+2.00)#659 |
| 49. | Bernardsville Borough | 2.35% | 0.64%(+1.70)#49 | 0.37%(+1.97)#675 |
| 50. | Dover Beaches North | 2.30% | 0.64%(+1.66)#50 | 0.37%(+1.93)#700 |
| 51. | Alpine Borough | 2.28% | 0.64%(+1.64)#51 | 0.37%(+1.91)#711 |
| 52. | Roseland Borough | 2.27% | 0.64%(+1.63)#52 | 0.37%(+1.89)#712 |
| 53. | Millstone Borough | 2.23% | 0.64%(+1.59)#53 | 0.37%(+1.85)#725 |
| 54. | Lake Mohawk | 2.20% | 0.64%(+1.55)#54 | 0.37%(+1.82)#738 |
| 55. | Macopin | 2.16% | 0.64%(+1.52)#55 | 0.37%(+1.79)#758 |
| 56. | New Milford Borough | 2.16% | 0.64%(+1.51)#56 | 0.37%(+1.78)#760 |
| 57. | Panther Valley | 2.13% | 0.64%(+1.49)#57 | 0.37%(+1.75)#779 |
| 58. | Branchville Borough | 2.12% | 0.64%(+1.48)#58 | 0.37%(+1.75)#783 |
| 59. | Shrewsbury Borough | 2.08% | 0.64%(+1.44)#59 | 0.37%(+1.71)#809 |
| 60. | New Egypt | 2.06% | 0.64%(+1.42)#60 | 0.37%(+1.69)#821 |
| 61. | Tinton Falls Borough | 2.06% | 0.64%(+1.42)#61 | 0.37%(+1.69)#824 |
| 62. | Ramsey Borough | 2.06% | 0.64%(+1.41)#62 | 0.37%(+1.68)#829 |
| 63. | Totowa Borough | 2.04% | 0.64%(+1.40)#63 | 0.37%(+1.67)#840 |
| 64. | Riverton Borough | 2.03% | 0.64%(+1.39)#64 | 0.37%(+1.65)#850 |
| 65. | Layton | 2.00% | 0.64%(+1.36)#65 | 0.37%(+1.63)#869 |
| 66. | Robertsville | 2.00% | 0.64%(+1.36)#66 | 0.37%(+1.63)#872 |
| 67. | Ridgefield Borough | 2.00% | 0.64%(+1.36)#67 | 0.37%(+1.63)#875 |
| 68. | Port Republic | 1.94% | 0.64%(+1.30)#68 | 0.37%(+1.57)#911 |
| 69. | Crandon Lakes | 1.93% | 0.64%(+1.29)#69 | 0.37%(+1.56)#917 |
| 70. | Summit | 1.92% | 0.64%(+1.28)#70 | 0.37%(+1.55)#922 |
| 71. | Lincroft | 1.87% | 0.64%(+1.23)#71 | 0.37%(+1.50)#955 |
| 72. | Regency At Monroe | 1.87% | 0.64%(+1.23)#72 | 0.37%(+1.50)#956 |
| 73. | Somerdale Borough | 1.86% | 0.64%(+1.22)#73 | 0.37%(+1.49)#959 |
| 74. | New Providence Borough | 1.85% | 0.64%(+1.21)#74 | 0.37%(+1.47)#975 |
| 75. | Interlaken Borough | 1.84% | 0.64%(+1.20)#75 | 0.37%(+1.47)#982 |
| 76. | Park Ridge Borough | 1.84% | 0.64%(+1.19)#76 | 0.37%(+1.46)#983 |
| 77. | Cape May Court House | 1.84% | 0.64%(+1.19)#77 | 0.37%(+1.46)#984 |
| 78. | Ramapo College Of New Jersey | 1.83% | 0.64%(+1.19)#78 | 0.37%(+1.46)#995 |
| 79. | Hopelawn | 1.79% | 0.64%(+1.15)#79 | 0.37%(+1.42)#1,031 |
| 80. | Malaga | 1.78% | 0.64%(+1.14)#80 | 0.37%(+1.41)#1,039 |
| 81. | Mercerville | 1.78% | 0.64%(+1.14)#81 | 0.37%(+1.41)#1,040 |
| 82. | Greenwich | 1.74% | 0.64%(+1.10)#82 | 0.37%(+1.37)#1,068 |
| 83. | Fort Lee Borough | 1.74% | 0.64%(+1.10)#83 | 0.37%(+1.37)#1,072 |
| 84. | Stonebridge | 1.73% | 0.64%(+1.09)#84 | 0.37%(+1.36)#1,082 |
| 85. | Oradell Borough | 1.73% | 0.64%(+1.09)#85 | 0.37%(+1.36)#1,084 |
| 86. | East Freehold | 1.71% | 0.64%(+1.07)#86 | 0.37%(+1.34)#1,105 |
| 87. | Haddon Heights Borough | 1.70% | 0.64%(+1.06)#87 | 0.37%(+1.33)#1,112 |
| 88. | Oakland Borough | 1.68% | 0.64%(+1.04)#88 | 0.37%(+1.31)#1,124 |
| 89. | Mantoloking Borough | 1.68% | 0.64%(+1.04)#89 | 0.37%(+1.31)#1,125 |
| 90. | Haworth Borough | 1.68% | 0.64%(+1.03)#90 | 0.37%(+1.30)#1,129 |
| 91. | Ridgefield Park | 1.62% | 0.64%(+0.977)#91 | 0.37%(+1.25)#1,177 |
| 92. | Midland Park Borough | 1.61% | 0.64%(+0.968)#92 | 0.37%(+1.24)#1,188 |
| 93. | Barnegat Light Borough | 1.61% | 0.64%(+0.968)#93 | 0.37%(+1.24)#1,189 |
| 94. | Andover Borough | 1.61% | 0.64%(+0.965)#94 | 0.37%(+1.23)#1,191 |
| 95. | Northvale Borough | 1.57% | 0.64%(+0.932)#95 | 0.37%(+1.20)#1,222 |
| 96. | Leisure Village East | 1.57% | 0.64%(+0.928)#96 | 0.37%(+1.20)#1,226 |
| 97. | Pitman Borough | 1.56% | 0.64%(+0.915)#97 | 0.37%(+1.18)#1,241 |
| 98. | Villas | 1.55% | 0.64%(+0.911)#98 | 0.37%(+1.18)#1,247 |
| 99. | Rio Grande | 1.55% | 0.64%(+0.905)#99 | 0.37%(+1.17)#1,253 |
| 100. | Ridgewood | 1.53% | 0.64%(+0.891)#100 | 0.37%(+1.16)#1,271 |
Common Questions
What are the Top 10 Cities with the Highest Percentage of Greek Population in New Jersey?
Top 10 Cities with the Highest Percentage of Greek Population in New Jersey are:
#1
10.43%
#2
6.98%
#3
6.85%
#4
6.58%
#5
6.41%
#6
6.23%
#7
3.66%
#8
3.31%
#9
3.07%
#10
2.97%
What city has the Highest Percentage of Greek Population in New Jersey?
Hutchinson has the Highest Percentage of Greek Population in New Jersey with 10.43%.
What is the Percentage of Greek Population in the State of New Jersey?
Percentage of Greek Population in New Jersey is 0.64%.
What is the Percentage of Greek Population in the United States?
Percentage of Greek Population in the United States is 0.37%.