Cities with the Highest Percentage of Ethiopian Population in New Jersey
RELATED REPORTS & OPTIONS
Ethiopian
New Jersey
Compare Cities
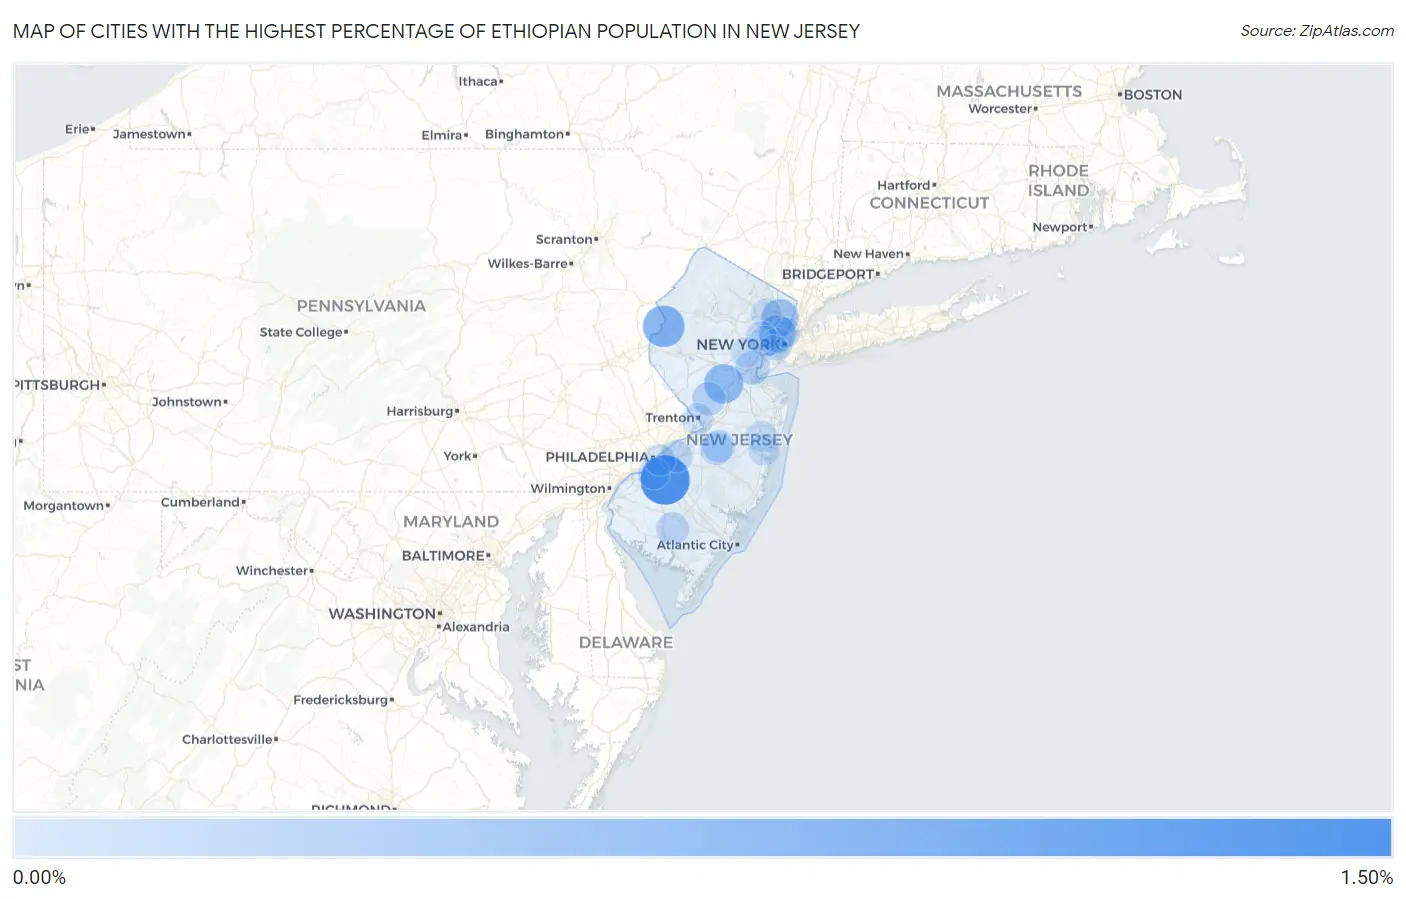
Map of Cities with the Highest Percentage of Ethiopian Population in New Jersey
0.00%
1.50%
Cities with the Highest Percentage of Ethiopian Population in New Jersey
| City | Ethiopian | vs State | vs National | |
| 1. | Blackwood | 1.29% | 0.036%(+1.25)#1 | 0.11%(+1.18)#188 |
| 2. | Collingswood Borough | 1.11% | 0.036%(+1.07)#2 | 0.11%(+1.00)#215 |
| 3. | Edgewater Borough | 1.05% | 0.036%(+1.01)#3 | 0.11%(+0.942)#229 |
| 4. | Belvidere | 0.75% | 0.036%(+0.714)#4 | 0.11%(+0.643)#302 |
| 5. | Franklin Park | 0.59% | 0.036%(+0.553)#5 | 0.11%(+0.481)#359 |
| 6. | Hackensack | 0.46% | 0.036%(+0.421)#6 | 0.11%(+0.349)#427 |
| 7. | Secaucus | 0.46% | 0.036%(+0.421)#7 | 0.11%(+0.349)#428 |
| 8. | Ridgefield Borough | 0.31% | 0.036%(+0.269)#8 | 0.11%(+0.198)#563 |
| 9. | Parsippany | 0.27% | 0.036%(+0.235)#9 | 0.11%(+0.163)#612 |
| 10. | Woodbridge | 0.27% | 0.036%(+0.232)#10 | 0.11%(+0.160)#614 |
| 11. | Woodlynne Borough | 0.24% | 0.036%(+0.205)#11 | 0.11%(+0.134)#649 |
| 12. | Princeton | 0.20% | 0.036%(+0.168)#12 | 0.11%(+0.096)#724 |
| 13. | Vineland | 0.18% | 0.036%(+0.140)#13 | 0.11%(+0.069)#779 |
| 14. | Victory Gardens Borough | 0.17% | 0.036%(+0.134)#14 | 0.11%(+0.063)#791 |
| 15. | Fort Dix | 0.15% | 0.036%(+0.118)#15 | 0.11%(+0.047)#830 |
| 16. | Mcguire Afb | 0.14% | 0.036%(+0.107)#16 | 0.11%(+0.036)#859 |
| 17. | The College Of New Jersey | 0.14% | 0.036%(+0.104)#17 | 0.11%(+0.032)#872 |
| 18. | Moorestown Lenola | 0.14% | 0.036%(+0.103)#18 | 0.11%(+0.032)#875 |
| 19. | New Milford Borough | 0.12% | 0.036%(+0.088)#19 | 0.11%(+0.017)#919 |
| 20. | Bellmawr Borough | 0.11% | 0.036%(+0.075)#20 | 0.11%(+0.004)#957 |
| 21. | Trenton | 0.091% | 0.036%(+0.055)#21 | 0.11%(-0.016)#1,031 |
| 22. | Woodbury | 0.090% | 0.036%(+0.054)#22 | 0.11%(-0.017)#1,036 |
| 23. | Camden | 0.082% | 0.036%(+0.046)#23 | 0.11%(-0.025)#1,067 |
| 24. | Jersey City | 0.081% | 0.036%(+0.045)#24 | 0.11%(-0.026)#1,078 |
| 25. | Rutherford Borough | 0.064% | 0.036%(+0.028)#25 | 0.11%(-0.043)#1,140 |
| 26. | Lakewood | 0.063% | 0.036%(+0.027)#26 | 0.11%(-0.045)#1,149 |
| 27. | Florham Park Borough | 0.063% | 0.036%(+0.027)#27 | 0.11%(-0.045)#1,152 |
| 28. | Toms River | 0.059% | 0.036%(+0.023)#28 | 0.11%(-0.048)#1,173 |
| 29. | Paterson | 0.049% | 0.036%(+0.013)#29 | 0.11%(-0.058)#1,233 |
| 30. | West New York | 0.048% | 0.036%(+0.012)#30 | 0.11%(-0.060)#1,238 |
| 31. | Newark | 0.046% | 0.036%(+0.010)#31 | 0.11%(-0.061)#1,252 |
| 32. | Haddonfield Borough | 0.040% | 0.036%(+0.004)#32 | 0.11%(-0.067)#1,287 |
| 33. | Dumont Borough | 0.039% | 0.036%(+0.003)#33 | 0.11%(-0.068)#1,294 |
| 34. | Glassboro Borough | 0.030% | 0.036%(-0.006)#34 | 0.11%(-0.077)#1,366 |
| 35. | South Plainfield Borough | 0.029% | 0.036%(-0.007)#35 | 0.11%(-0.078)#1,376 |
| 36. | East Orange | 0.025% | 0.036%(-0.011)#36 | 0.11%(-0.083)#1,410 |
| 37. | Westfield | 0.023% | 0.036%(-0.013)#37 | 0.11%(-0.085)#1,427 |
| 38. | Bayonne | 0.0028% | 0.036%(-0.033)#38 | 0.11%(-0.104)#1,616 |
Common Questions
What are the Top 10 Cities with the Highest Percentage of Ethiopian Population in New Jersey?
Top 10 Cities with the Highest Percentage of Ethiopian Population in New Jersey are:
#1
1.29%
#2
0.75%
#3
0.59%
#4
0.46%
#5
0.46%
#6
0.27%
#7
0.20%
#8
0.18%
#9
0.15%
#10
0.14%
What city has the Highest Percentage of Ethiopian Population in New Jersey?
Blackwood has the Highest Percentage of Ethiopian Population in New Jersey with 1.29%.
What is the Percentage of Ethiopian Population in the State of New Jersey?
Percentage of Ethiopian Population in New Jersey is 0.036%.
What is the Percentage of Ethiopian Population in the United States?
Percentage of Ethiopian Population in the United States is 0.11%.