Cities with the Lowest Child Poverty Level Among Girls Under the Age of 16 in New Jersey
RELATED REPORTS & OPTIONS
Lowest Poverty | Girls 0-16
New Jersey
Compare Cities
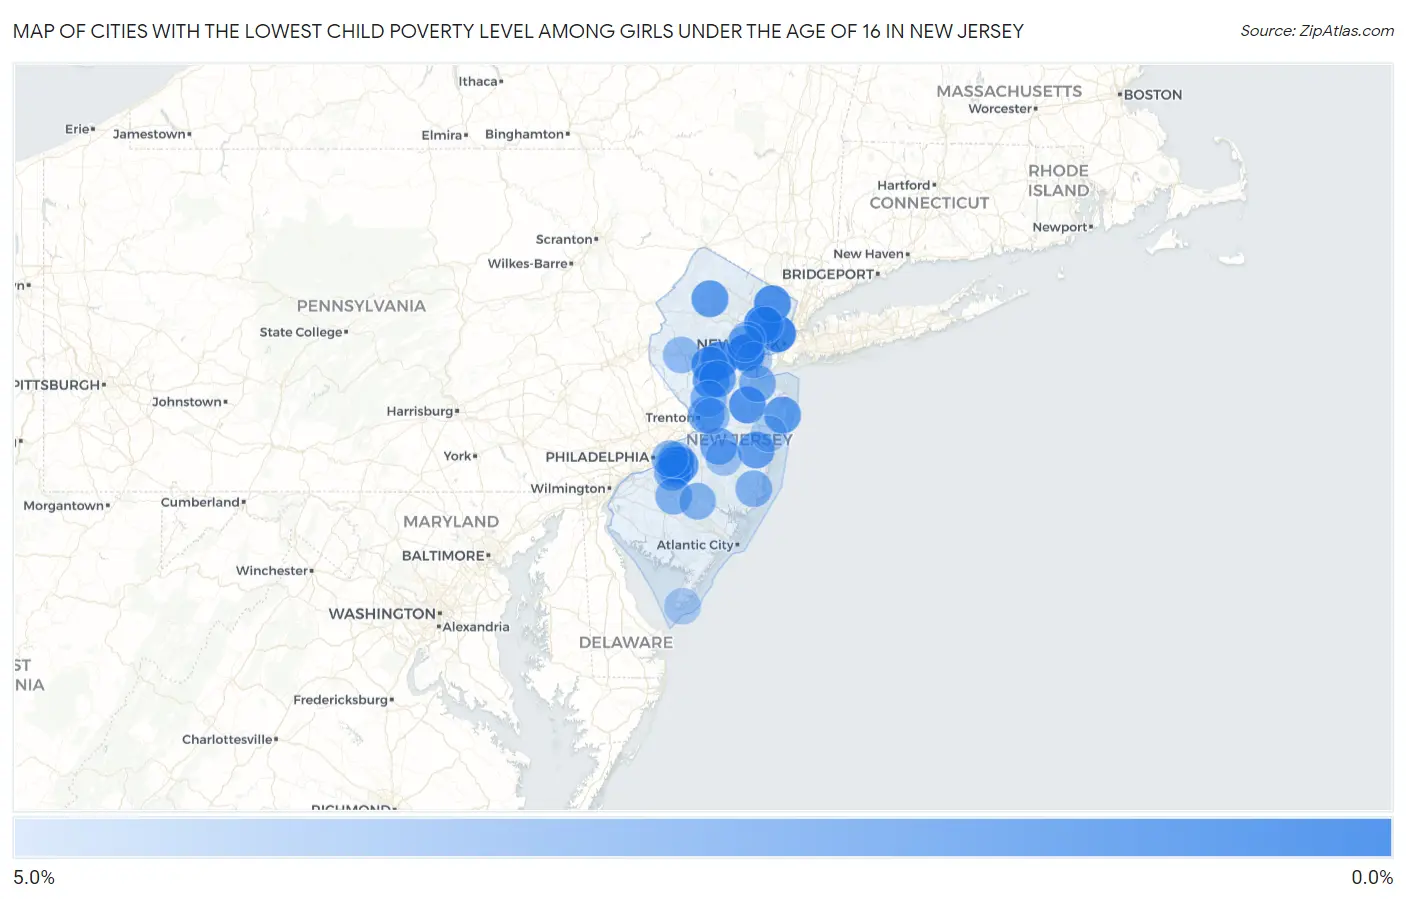
Map of Cities with the Lowest Child Poverty Level Among Girls Under the Age of 16 in New Jersey
5.0%
0.0%
Cities with the Lowest Child Poverty Level Among Girls Under the Age of 16 in New Jersey
| City | Child Poverty (Girls) | vs State | vs National | |
| 1. | Westfield | 0.35% | 13.6%(-13.3)#1 | 17.0%(-16.6)#18 |
| 2. | Woodcliff Lake Borough | 0.40% | 13.6%(-13.2)#2 | 17.0%(-16.6)#28 |
| 3. | Secaucus | 0.49% | 13.6%(-13.1)#3 | 17.0%(-16.5)#38 |
| 4. | Chatham Borough | 0.58% | 13.6%(-13.1)#4 | 17.0%(-16.4)#57 |
| 5. | Upper Montclair | 0.61% | 13.6%(-13.0)#5 | 17.0%(-16.4)#59 |
| 6. | Metuchen Borough | 0.72% | 13.6%(-12.9)#6 | 17.0%(-16.3)#78 |
| 7. | Martinsville | 0.76% | 13.6%(-12.9)#7 | 17.0%(-16.2)#89 |
| 8. | Haddon Heights Borough | 0.76% | 13.6%(-12.9)#8 | 17.0%(-16.2)#90 |
| 9. | Greentree | 0.78% | 13.6%(-12.8)#9 | 17.0%(-16.2)#97 |
| 10. | Oak Ridge | 0.86% | 13.6%(-12.8)#10 | 17.0%(-16.1)#115 |
| 11. | Glen Rock Borough | 0.87% | 13.6%(-12.8)#11 | 17.0%(-16.1)#122 |
| 12. | Stanhope Borough | 0.92% | 13.6%(-12.7)#12 | 17.0%(-16.1)#140 |
| 13. | Bradley Gardens | 0.96% | 13.6%(-12.7)#13 | 17.0%(-16.0)#149 |
| 14. | Buena Borough | 0.97% | 13.6%(-12.7)#14 | 17.0%(-16.0)#152 |
| 15. | Roosevelt Borough | 1.0% | 13.6%(-12.6)#15 | 17.0%(-15.9)#176 |
| 16. | Ridgewood | 1.1% | 13.6%(-12.6)#16 | 17.0%(-15.9)#183 |
| 17. | Eatontown Borough | 1.1% | 13.6%(-12.5)#17 | 17.0%(-15.9)#194 |
| 18. | Manasquan Borough | 1.1% | 13.6%(-12.5)#18 | 17.0%(-15.9)#205 |
| 19. | Tenafly Borough | 1.2% | 13.6%(-12.4)#19 | 17.0%(-15.8)#229 |
| 20. | Dumont Borough | 1.3% | 13.6%(-12.4)#20 | 17.0%(-15.7)#248 |
| 21. | Old Tappan Borough | 1.3% | 13.6%(-12.3)#21 | 17.0%(-15.7)#280 |
| 22. | Fanwood Borough | 1.4% | 13.6%(-12.3)#22 | 17.0%(-15.6)#299 |
| 23. | Yorketown | 1.4% | 13.6%(-12.2)#23 | 17.0%(-15.6)#315 |
| 24. | Gibbsboro Borough | 1.4% | 13.6%(-12.2)#24 | 17.0%(-15.6)#317 |
| 25. | Marlton | 1.4% | 13.6%(-12.2)#25 | 17.0%(-15.6)#323 |
| 26. | Waldwick Borough | 1.5% | 13.6%(-12.1)#26 | 17.0%(-15.4)#361 |
| 27. | Oradell Borough | 1.6% | 13.6%(-12.0)#27 | 17.0%(-15.4)#401 |
| 28. | Point Pleasant Borough | 1.7% | 13.6%(-12.0)#28 | 17.0%(-15.3)#416 |
| 29. | Oakland Borough | 1.7% | 13.6%(-12.0)#29 | 17.0%(-15.3)#420 |
| 30. | Belle Mead | 1.7% | 13.6%(-11.9)#30 | 17.0%(-15.3)#443 |
| 31. | Lake Mohawk | 1.7% | 13.6%(-11.9)#31 | 17.0%(-15.3)#444 |
| 32. | Westmont | 1.8% | 13.6%(-11.9)#32 | 17.0%(-15.2)#472 |
| 33. | Wanamassa | 1.8% | 13.6%(-11.9)#33 | 17.0%(-15.2)#480 |
| 34. | Lake Hiawatha | 1.8% | 13.6%(-11.8)#34 | 17.0%(-15.2)#487 |
| 35. | Pine Lake Park | 1.8% | 13.6%(-11.8)#35 | 17.0%(-15.1)#511 |
| 36. | Rutherford Borough | 1.9% | 13.6%(-11.8)#36 | 17.0%(-15.1)#533 |
| 37. | River Edge Borough | 2.0% | 13.6%(-11.7)#37 | 17.0%(-15.0)#565 |
| 38. | Closter Borough | 2.0% | 13.6%(-11.6)#38 | 17.0%(-15.0)#595 |
| 39. | Blackwells Mills | 2.0% | 13.6%(-11.6)#39 | 17.0%(-14.9)#613 |
| 40. | Mendham Borough | 2.1% | 13.6%(-11.6)#40 | 17.0%(-14.9)#636 |
| 41. | Lebanon Borough | 2.1% | 13.6%(-11.5)#41 | 17.0%(-14.9)#658 |
| 42. | Lincoln Park Borough | 2.1% | 13.6%(-11.5)#42 | 17.0%(-14.9)#660 |
| 43. | Preakness | 2.1% | 13.6%(-11.5)#43 | 17.0%(-14.8)#678 |
| 44. | Haddonfield Borough | 2.2% | 13.6%(-11.5)#44 | 17.0%(-14.8)#700 |
| 45. | New Providence Borough | 2.2% | 13.6%(-11.4)#45 | 17.0%(-14.8)#703 |
| 46. | Maywood Borough | 2.2% | 13.6%(-11.4)#46 | 17.0%(-14.8)#710 |
| 47. | Riverton Borough | 2.2% | 13.6%(-11.4)#47 | 17.0%(-14.7)#732 |
| 48. | Florham Park Borough | 2.3% | 13.6%(-11.4)#48 | 17.0%(-14.7)#739 |
| 49. | Mcguire Afb | 2.3% | 13.6%(-11.4)#49 | 17.0%(-14.7)#748 |
| 50. | Hillsborough | 2.3% | 13.6%(-11.4)#50 | 17.0%(-14.7)#749 |
| 51. | Cedar Knolls | 2.3% | 13.6%(-11.4)#51 | 17.0%(-14.7)#753 |
| 52. | Runnemede Borough | 2.3% | 13.6%(-11.4)#52 | 17.0%(-14.7)#759 |
| 53. | Oceanport Borough | 2.3% | 13.6%(-11.4)#53 | 17.0%(-14.7)#760 |
| 54. | Franklin Lakes Borough | 2.3% | 13.6%(-11.3)#54 | 17.0%(-14.7)#773 |
| 55. | Troy Hills | 2.3% | 13.6%(-11.3)#55 | 17.0%(-14.7)#774 |
| 56. | Pennington Borough | 2.3% | 13.6%(-11.3)#56 | 17.0%(-14.7)#779 |
| 57. | Keyport Borough | 2.4% | 13.6%(-11.3)#57 | 17.0%(-14.6)#797 |
| 58. | Ramsey Borough | 2.4% | 13.6%(-11.3)#58 | 17.0%(-14.6)#806 |
| 59. | Mercerville | 2.4% | 13.6%(-11.2)#59 | 17.0%(-14.5)#836 |
| 60. | Laurel Springs Borough | 2.4% | 13.6%(-11.2)#60 | 17.0%(-14.5)#841 |
| 61. | Oaklyn Borough | 2.5% | 13.6%(-11.2)#61 | 17.0%(-14.5)#856 |
| 62. | The Hills | 2.5% | 13.6%(-11.1)#62 | 17.0%(-14.5)#873 |
| 63. | Springdale | 2.5% | 13.6%(-11.1)#63 | 17.0%(-14.5)#889 |
| 64. | Brookdale | 2.6% | 13.6%(-11.1)#64 | 17.0%(-14.4)#925 |
| 65. | Laurence Harbor | 2.6% | 13.6%(-11.0)#65 | 17.0%(-14.3)#953 |
| 66. | Echelon | 2.7% | 13.6%(-10.9)#66 | 17.0%(-14.3)#985 |
| 67. | Middlesex Borough | 2.8% | 13.6%(-10.9)#67 | 17.0%(-14.2)#1,033 |
| 68. | Parsippany | 2.9% | 13.6%(-10.8)#68 | 17.0%(-14.1)#1,096 |
| 69. | Princeton | 2.9% | 13.6%(-10.7)#69 | 17.0%(-14.1)#1,123 |
| 70. | Ocean Acres | 2.9% | 13.6%(-10.7)#70 | 17.0%(-14.0)#1,151 |
| 71. | Williamstown | 3.0% | 13.6%(-10.7)#71 | 17.0%(-14.0)#1,168 |
| 72. | Woodbury Heights Borough | 3.0% | 13.6%(-10.6)#72 | 17.0%(-14.0)#1,180 |
| 73. | Little Ferry Borough | 3.1% | 13.6%(-10.6)#73 | 17.0%(-13.9)#1,211 |
| 74. | Totowa Borough | 3.1% | 13.6%(-10.6)#74 | 17.0%(-13.9)#1,214 |
| 75. | Hammonton | 3.1% | 13.6%(-10.6)#75 | 17.0%(-13.9)#1,226 |
| 76. | Short Hills | 3.1% | 13.6%(-10.5)#76 | 17.0%(-13.9)#1,243 |
| 77. | Ramblewood | 3.1% | 13.6%(-10.5)#77 | 17.0%(-13.9)#1,245 |
| 78. | Cherry Hill Mall | 3.1% | 13.6%(-10.5)#78 | 17.0%(-13.8)#1,261 |
| 79. | Lake Hopatcong | 3.2% | 13.6%(-10.5)#79 | 17.0%(-13.8)#1,274 |
| 80. | Madison Borough | 3.4% | 13.6%(-10.3)#80 | 17.0%(-13.6)#1,410 |
| 81. | Clinton | 3.4% | 13.6%(-10.2)#81 | 17.0%(-13.6)#1,431 |
| 82. | Hamilton Square | 3.5% | 13.6%(-10.1)#82 | 17.0%(-13.4)#1,511 |
| 83. | Swedesboro Borough | 3.6% | 13.6%(-10.1)#83 | 17.0%(-13.4)#1,522 |
| 84. | Mount Arlington Borough | 3.6% | 13.6%(-10.0)#84 | 17.0%(-13.4)#1,558 |
| 85. | Shrewsbury Borough | 3.7% | 13.6%(-9.89)#85 | 17.0%(-13.2)#1,621 |
| 86. | Collingswood Borough | 3.8% | 13.6%(-9.81)#86 | 17.0%(-13.2)#1,676 |
| 87. | Bargaintown | 3.8% | 13.6%(-9.79)#87 | 17.0%(-13.1)#1,687 |
| 88. | Rahway | 3.9% | 13.6%(-9.77)#88 | 17.0%(-13.1)#1,714 |
| 89. | Country Lake Estates | 3.9% | 13.6%(-9.76)#89 | 17.0%(-13.1)#1,716 |
| 90. | Summit | 3.9% | 13.6%(-9.72)#90 | 17.0%(-13.1)#1,738 |
| 91. | Merchantville Borough | 4.2% | 13.6%(-9.44)#91 | 17.0%(-12.8)#1,917 |
| 92. | Cape May | 4.3% | 13.6%(-9.38)#92 | 17.0%(-12.7)#1,959 |
| 93. | Hopatcong Borough | 4.3% | 13.6%(-9.33)#93 | 17.0%(-12.7)#1,990 |
| 94. | Beachwood Borough | 4.3% | 13.6%(-9.29)#94 | 17.0%(-12.6)#2,005 |
| 95. | Ramtown | 4.4% | 13.6%(-9.28)#95 | 17.0%(-12.6)#2,034 |
| 96. | Ledgewood | 4.4% | 13.6%(-9.19)#96 | 17.0%(-12.5)#2,077 |
| 97. | Cresskill Borough | 4.5% | 13.6%(-9.09)#97 | 17.0%(-12.4)#2,141 |
| 98. | Rockleigh Borough | 4.5% | 13.6%(-9.09)#98 | 17.0%(-12.4)#2,154 |
| 99. | Lake Como Borough | 4.6% | 13.6%(-9.02)#99 | 17.0%(-12.4)#2,197 |
| 100. | Jamesburg Borough | 4.7% | 13.6%(-8.97)#100 | 17.0%(-12.3)#2,233 |
Common Questions
What are the Top 10 Cities with the Lowest Child Poverty Level Among Girls Under the Age of 16 in New Jersey?
Top 10 Cities with the Lowest Child Poverty Level Among Girls Under the Age of 16 in New Jersey are:
#1
0.35%
#2
0.49%
#3
0.61%
#4
0.76%
#5
0.78%
#6
0.96%
#7
1.1%
#8
1.4%
#9
1.4%
#10
1.7%
What city has the Lowest Child Poverty Level Among Girls Under the Age of 16 in New Jersey?
Westfield has the Lowest Child Poverty Level Among Girls Under the Age of 16 in New Jersey with 0.35%.
What is the Poverty Level Among Girls Under the Age of 16 in the State of New Jersey?
Poverty Level Among Girls Under the Age of 16 in New Jersey is 13.6%.
What is the Poverty Level Among Girls Under the Age of 16 in the United States?
Poverty Level Among Girls Under the Age of 16 in the United States is 17.0%.