Cities with the Most Immigrants from Asia in New Jersey
RELATED REPORTS & OPTIONS
Asia
New Jersey
Compare Cities
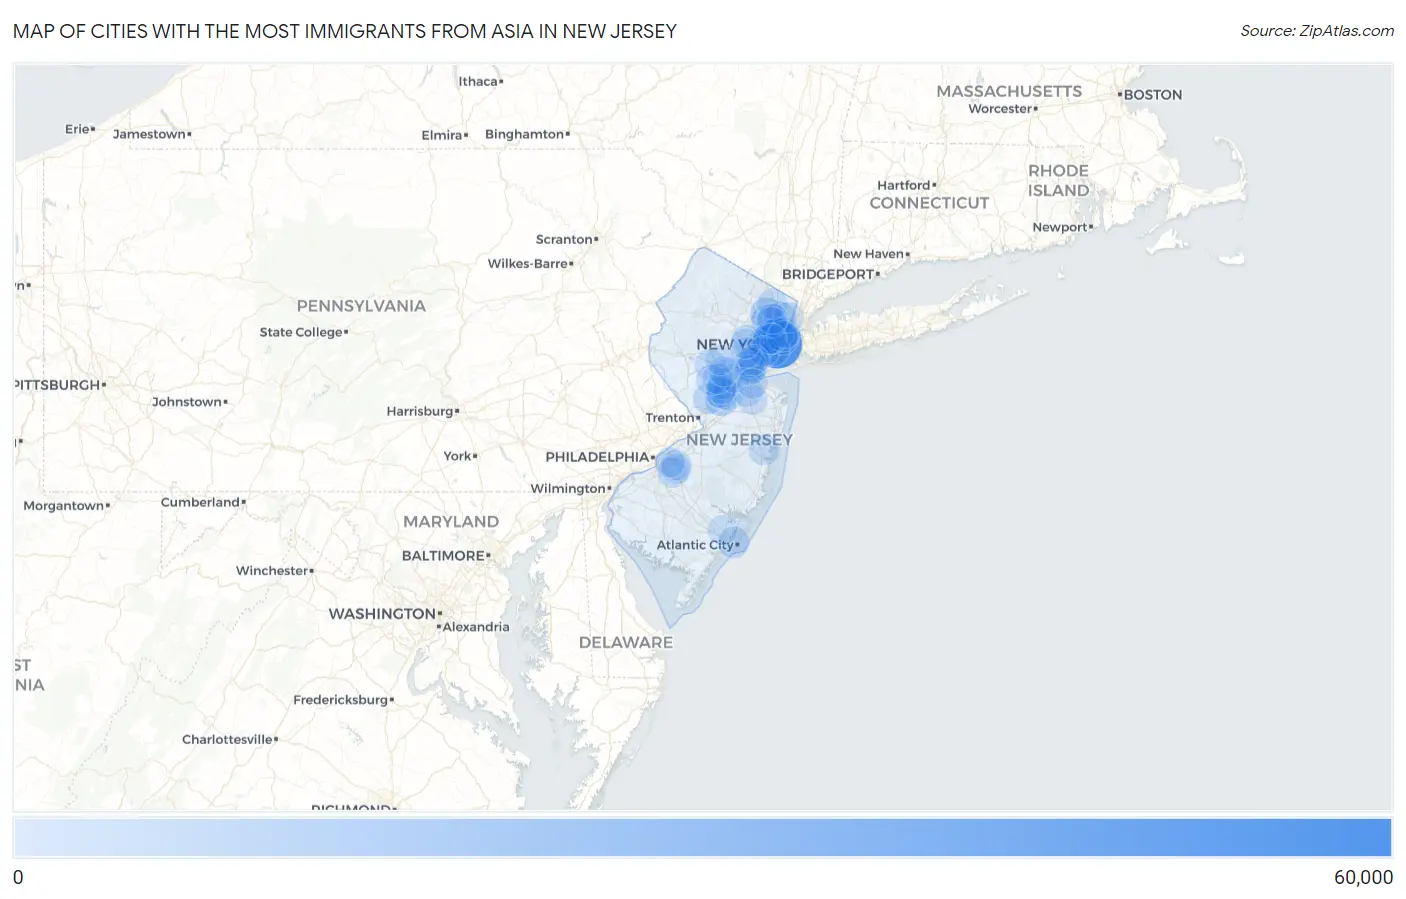
Map of Cities with the Most Immigrants from Asia in New Jersey
0
60,000
Cities with the Most Immigrants from Asia in New Jersey
| City | Asia | vs State | vs National | |
| 1. | Jersey City | 57,863 | 691,805(8.36%)#1 | 14,105,933(0.41%)#16 |
| 2. | Fort Lee Borough | 14,460 | 691,805(2.09%)#2 | 14,105,933(0.10%)#132 |
| 3. | Palisades Park Borough | 9,340 | 691,805(1.35%)#3 | 14,105,933(0.07%)#211 |
| 4. | Clifton | 8,571 | 691,805(1.24%)#4 | 14,105,933(0.06%)#241 |
| 5. | Iselin | 7,877 | 691,805(1.14%)#5 | 14,105,933(0.06%)#261 |
| 6. | Paterson | 7,606 | 691,805(1.10%)#6 | 14,105,933(0.05%)#269 |
| 7. | Parsippany | 7,341 | 691,805(1.06%)#7 | 14,105,933(0.05%)#282 |
| 8. | Princeton Meadows | 7,253 | 691,805(1.05%)#8 | 14,105,933(0.05%)#287 |
| 9. | Hackensack | 5,951 | 691,805(0.86%)#9 | 14,105,933(0.04%)#358 |
| 10. | Sayreville Borough | 5,907 | 691,805(0.85%)#10 | 14,105,933(0.04%)#361 |
| 11. | Secaucus | 5,692 | 691,805(0.82%)#11 | 14,105,933(0.04%)#373 |
| 12. | Bergenfield Borough | 5,469 | 691,805(0.79%)#12 | 14,105,933(0.04%)#385 |
| 13. | Hoboken | 5,320 | 691,805(0.77%)#13 | 14,105,933(0.04%)#397 |
| 14. | Paramus Borough | 5,178 | 691,805(0.75%)#14 | 14,105,933(0.04%)#408 |
| 15. | Bayonne | 5,139 | 691,805(0.74%)#15 | 14,105,933(0.04%)#417 |
| 16. | Newark | 4,965 | 691,805(0.72%)#16 | 14,105,933(0.04%)#433 |
| 17. | Carteret Borough | 4,955 | 691,805(0.72%)#17 | 14,105,933(0.04%)#435 |
| 18. | Edgewater Borough | 4,829 | 691,805(0.70%)#18 | 14,105,933(0.03%)#448 |
| 19. | Princeton | 4,709 | 691,805(0.68%)#19 | 14,105,933(0.03%)#459 |
| 20. | Atlantic City | 4,636 | 691,805(0.67%)#20 | 14,105,933(0.03%)#467 |
| 21. | Monmouth Junction | 3,917 | 691,805(0.57%)#21 | 14,105,933(0.03%)#539 |
| 22. | Bradley Gardens | 3,865 | 691,805(0.56%)#22 | 14,105,933(0.03%)#543 |
| 23. | Somerset | 3,819 | 691,805(0.55%)#23 | 14,105,933(0.03%)#553 |
| 24. | Fair Lawn Borough | 3,709 | 691,805(0.54%)#24 | 14,105,933(0.03%)#572 |
| 25. | Tenafly Borough | 3,662 | 691,805(0.53%)#25 | 14,105,933(0.03%)#579 |
| 26. | Short Hills | 3,606 | 691,805(0.52%)#26 | 14,105,933(0.03%)#590 |
| 27. | Franklin Park | 3,455 | 691,805(0.50%)#27 | 14,105,933(0.02%)#610 |
| 28. | Harrison | 3,286 | 691,805(0.47%)#28 | 14,105,933(0.02%)#636 |
| 29. | West New York | 3,206 | 691,805(0.46%)#29 | 14,105,933(0.02%)#648 |
| 30. | Dayton | 3,167 | 691,805(0.46%)#30 | 14,105,933(0.02%)#655 |
| 31. | South Plainfield Borough | 3,093 | 691,805(0.45%)#31 | 14,105,933(0.02%)#670 |
| 32. | Avenel | 3,066 | 691,805(0.44%)#32 | 14,105,933(0.02%)#674 |
| 33. | Ridgefield Borough | 3,050 | 691,805(0.44%)#33 | 14,105,933(0.02%)#678 |
| 34. | Cliffside Park Borough | 3,016 | 691,805(0.44%)#34 | 14,105,933(0.02%)#683 |
| 35. | Hillsborough | 3,015 | 691,805(0.44%)#35 | 14,105,933(0.02%)#685 |
| 36. | Lake Hiawatha | 2,981 | 691,805(0.43%)#36 | 14,105,933(0.02%)#689 |
| 37. | Highland Park Borough | 2,905 | 691,805(0.42%)#37 | 14,105,933(0.02%)#703 |
| 38. | Woodbridge | 2,842 | 691,805(0.41%)#38 | 14,105,933(0.02%)#718 |
| 39. | New Milford Borough | 2,762 | 691,805(0.40%)#39 | 14,105,933(0.02%)#740 |
| 40. | Ridgewood | 2,761 | 691,805(0.40%)#40 | 14,105,933(0.02%)#741 |
| 41. | Old Bridge | 2,748 | 691,805(0.40%)#41 | 14,105,933(0.02%)#744 |
| 42. | Echelon | 2,703 | 691,805(0.39%)#42 | 14,105,933(0.02%)#754 |
| 43. | Dumont Borough | 2,693 | 691,805(0.39%)#43 | 14,105,933(0.02%)#759 |
| 44. | Cresskill Borough | 2,678 | 691,805(0.39%)#44 | 14,105,933(0.02%)#765 |
| 45. | Toms River | 2,670 | 691,805(0.39%)#45 | 14,105,933(0.02%)#769 |
| 46. | Heathcote | 2,637 | 691,805(0.38%)#46 | 14,105,933(0.02%)#774 |
| 47. | Leonia Borough | 2,598 | 691,805(0.38%)#47 | 14,105,933(0.02%)#778 |
| 48. | Englewood | 2,483 | 691,805(0.36%)#48 | 14,105,933(0.02%)#806 |
| 49. | New Brunswick | 2,421 | 691,805(0.35%)#49 | 14,105,933(0.02%)#821 |
| 50. | The Hills | 2,318 | 691,805(0.34%)#50 | 14,105,933(0.02%)#852 |
| 51. | Belle Mead | 2,309 | 691,805(0.33%)#51 | 14,105,933(0.02%)#859 |
| 52. | River Edge Borough | 2,169 | 691,805(0.31%)#52 | 14,105,933(0.02%)#903 |
| 53. | Preakness | 2,152 | 691,805(0.31%)#53 | 14,105,933(0.02%)#909 |
| 54. | Passaic | 2,092 | 691,805(0.30%)#54 | 14,105,933(0.01%)#931 |
| 55. | Kendall Park | 2,076 | 691,805(0.30%)#55 | 14,105,933(0.01%)#939 |
| 56. | Rutherford Borough | 2,072 | 691,805(0.30%)#56 | 14,105,933(0.01%)#940 |
| 57. | East Rutherford Borough | 2,043 | 691,805(0.30%)#57 | 14,105,933(0.01%)#952 |
| 58. | Closter Borough | 2,013 | 691,805(0.29%)#58 | 14,105,933(0.01%)#958 |
| 59. | Colonia | 2,001 | 691,805(0.29%)#59 | 14,105,933(0.01%)#965 |
| 60. | Elizabeth | 1,990 | 691,805(0.29%)#60 | 14,105,933(0.01%)#978 |
| 61. | Elmwood Park Borough | 1,983 | 691,805(0.29%)#61 | 14,105,933(0.01%)#981 |
| 62. | Englewood Cliffs Borough | 1,799 | 691,805(0.26%)#62 | 14,105,933(0.01%)#1,056 |
| 63. | Union City | 1,791 | 691,805(0.26%)#63 | 14,105,933(0.01%)#1,060 |
| 64. | Greentree | 1,786 | 691,805(0.26%)#64 | 14,105,933(0.01%)#1,067 |
| 65. | Lodi Borough | 1,759 | 691,805(0.25%)#65 | 14,105,933(0.01%)#1,082 |
| 66. | Little Ferry Borough | 1,695 | 691,805(0.25%)#66 | 14,105,933(0.01%)#1,110 |
| 67. | Fords | 1,641 | 691,805(0.24%)#67 | 14,105,933(0.01%)#1,141 |
| 68. | Springdale | 1,632 | 691,805(0.24%)#68 | 14,105,933(0.01%)#1,147 |
| 69. | Troy Hills | 1,602 | 691,805(0.23%)#69 | 14,105,933(0.01%)#1,172 |
| 70. | Blackwells Mills | 1,568 | 691,805(0.23%)#70 | 14,105,933(0.01%)#1,189 |
| 71. | Metuchen Borough | 1,497 | 691,805(0.22%)#71 | 14,105,933(0.01%)#1,221 |
| 72. | Woodland Park Borough | 1,491 | 691,805(0.22%)#72 | 14,105,933(0.01%)#1,226 |
| 73. | Westfield | 1,460 | 691,805(0.21%)#73 | 14,105,933(0.01%)#1,245 |
| 74. | Somerville Borough | 1,449 | 691,805(0.21%)#74 | 14,105,933(0.01%)#1,252 |
| 75. | New Providence Borough | 1,431 | 691,805(0.21%)#75 | 14,105,933(0.01%)#1,265 |
| 76. | Maywood Borough | 1,429 | 691,805(0.21%)#76 | 14,105,933(0.01%)#1,266 |
| 77. | Sicklerville | 1,421 | 691,805(0.21%)#77 | 14,105,933(0.01%)#1,271 |
| 78. | Rahway | 1,420 | 691,805(0.21%)#78 | 14,105,933(0.01%)#1,272 |
| 79. | Roselle Park Borough | 1,415 | 691,805(0.20%)#79 | 14,105,933(0.01%)#1,275 |
| 80. | Pomona | 1,415 | 691,805(0.20%)#80 | 14,105,933(0.01%)#1,276 |
| 81. | Norwood Borough | 1,372 | 691,805(0.20%)#81 | 14,105,933(0.01%)#1,299 |
| 82. | Franklin Center | 1,339 | 691,805(0.19%)#82 | 14,105,933(0.01%)#1,324 |
| 83. | Old Tappan Borough | 1,336 | 691,805(0.19%)#83 | 14,105,933(0.01%)#1,326 |
| 84. | Robertsville | 1,317 | 691,805(0.19%)#84 | 14,105,933(0.01%)#1,334 |
| 85. | Summit | 1,309 | 691,805(0.19%)#85 | 14,105,933(0.01%)#1,339 |
| 86. | Eatontown Borough | 1,264 | 691,805(0.18%)#86 | 14,105,933(0.01%)#1,364 |
| 87. | Raritan Borough | 1,259 | 691,805(0.18%)#87 | 14,105,933(0.01%)#1,367 |
| 88. | Wood Ridge Borough | 1,243 | 691,805(0.18%)#88 | 14,105,933(0.01%)#1,376 |
| 89. | Glen Rock Borough | 1,230 | 691,805(0.18%)#89 | 14,105,933(0.01%)#1,391 |
| 90. | Middlesex Borough | 1,208 | 691,805(0.17%)#90 | 14,105,933(0.01%)#1,411 |
| 91. | Martinsville | 1,199 | 691,805(0.17%)#91 | 14,105,933(0.01%)#1,416 |
| 92. | Demarest Borough | 1,179 | 691,805(0.17%)#92 | 14,105,933(0.01%)#1,433 |
| 93. | Monroe Manor | 1,163 | 691,805(0.17%)#93 | 14,105,933(0.01%)#1,444 |
| 94. | Garfield | 1,127 | 691,805(0.16%)#94 | 14,105,933(0.01%)#1,472 |
| 95. | Madison Park | 1,115 | 691,805(0.16%)#95 | 14,105,933(0.01%)#1,485 |
| 96. | Ellisburg | 1,110 | 691,805(0.16%)#96 | 14,105,933(0.01%)#1,489 |
| 97. | Kearny | 1,107 | 691,805(0.16%)#97 | 14,105,933(0.01%)#1,492 |
| 98. | Northvale Borough | 1,102 | 691,805(0.16%)#98 | 14,105,933(0.01%)#1,499 |
| 99. | Forsgate | 1,100 | 691,805(0.16%)#99 | 14,105,933(0.01%)#1,500 |
| 100. | North Arlington Borough | 1,038 | 691,805(0.15%)#100 | 14,105,933(0.01%)#1,557 |
Common Questions
What are the Top 10 Cities with the Most Immigrants from Asia in New Jersey?
Top 10 Cities with the Most Immigrants from Asia in New Jersey are:
#1
57,863
#2
8,571
#3
7,877
#4
7,606
#5
7,253
#6
5,951
#7
5,692
#8
5,320
#9
5,139
#10
4,965
What city has the Most Immigrants from Asia in New Jersey?
Jersey City has the Most Immigrants from Asia in New Jersey with 57,863.
What is the Total Immigrants from Asia in the State of New Jersey?
Total Immigrants from Asia in New Jersey is 691,805.
What is the Total Immigrants from Asia in the United States?
Total Immigrants from Asia in the United States is 14,105,933.