Cities with the Largest French Canadian Community in New Jersey
RELATED REPORTS & OPTIONS
French Canadian
New Jersey
Compare Cities
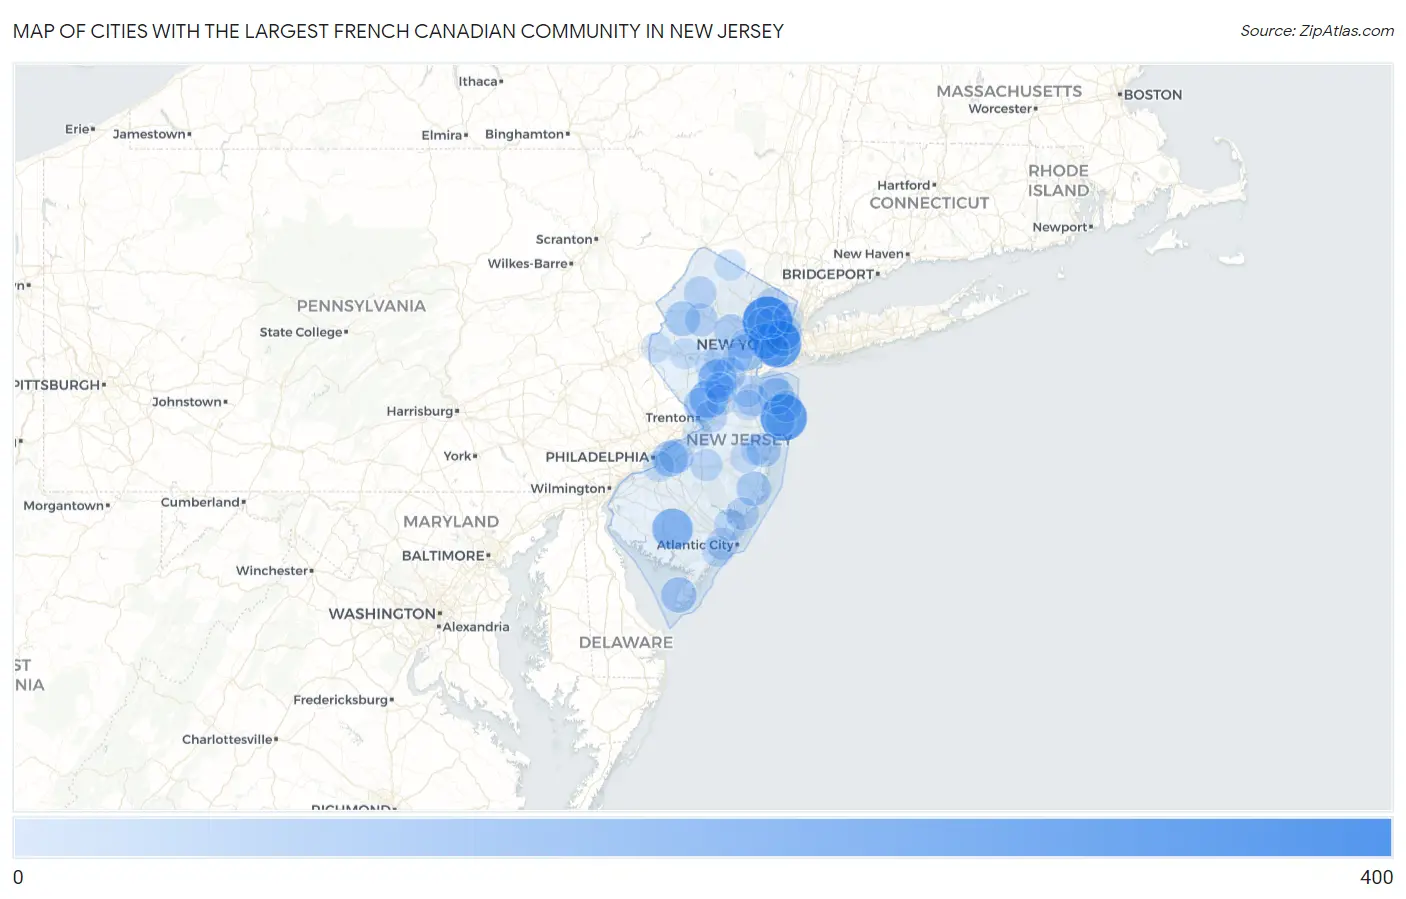
Map of Cities with the Largest French Canadian Community in New Jersey
0
400
Cities with the Largest French Canadian Community in New Jersey
| City | French Canadian | vs State | vs National | |
| 1. | Clifton | 308 | 18,454(1.67%)#1 | 1,802,745(0.02%)#763 |
| 2. | Jersey City | 278 | 18,454(1.51%)#2 | 1,802,745(0.02%)#836 |
| 3. | Asbury Park | 264 | 18,454(1.43%)#3 | 1,802,745(0.01%)#888 |
| 4. | Haddonfield Borough | 253 | 18,454(1.37%)#4 | 1,802,745(0.01%)#945 |
| 5. | Glen Ridge Borough | 186 | 18,454(1.01%)#5 | 1,802,745(0.01%)#1,306 |
| 6. | Vineland | 180 | 18,454(0.98%)#6 | 1,802,745(0.01%)#1,355 |
| 7. | Tuckerton Borough | 157 | 18,454(0.85%)#7 | 1,802,745(0.01%)#1,544 |
| 8. | Blackwells Mills | 152 | 18,454(0.82%)#8 | 1,802,745(0.01%)#1,574 |
| 9. | Princeton | 149 | 18,454(0.81%)#9 | 1,802,745(0.01%)#1,600 |
| 10. | Metuchen Borough | 143 | 18,454(0.77%)#10 | 1,802,745(0.01%)#1,678 |
| 11. | Lyons | 130 | 18,454(0.70%)#11 | 1,802,745(0.01%)#1,812 |
| 12. | Glen Rock Borough | 129 | 18,454(0.70%)#12 | 1,802,745(0.01%)#1,819 |
| 13. | Bradley Beach Borough | 125 | 18,454(0.68%)#13 | 1,802,745(0.01%)#1,864 |
| 14. | Westfield | 123 | 18,454(0.67%)#14 | 1,802,745(0.01%)#1,883 |
| 15. | Fairview | 122 | 18,454(0.66%)#15 | 1,802,745(0.01%)#1,907 |
| 16. | Cherry Hill Mall | 114 | 18,454(0.62%)#16 | 1,802,745(0.01%)#2,002 |
| 17. | Newark | 112 | 18,454(0.61%)#17 | 1,802,745(0.01%)#2,026 |
| 18. | Kinnelon Borough | 110 | 18,454(0.60%)#18 | 1,802,745(0.01%)#2,064 |
| 19. | Collingswood Borough | 106 | 18,454(0.57%)#19 | 1,802,745(0.01%)#2,125 |
| 20. | Pompton Lakes Borough | 106 | 18,454(0.57%)#20 | 1,802,745(0.01%)#2,128 |
| 21. | Villas | 106 | 18,454(0.57%)#21 | 1,802,745(0.01%)#2,129 |
| 22. | Lawrenceville | 101 | 18,454(0.55%)#22 | 1,802,745(0.01%)#2,233 |
| 23. | Hoboken | 100 | 18,454(0.54%)#23 | 1,802,745(0.01%)#2,237 |
| 24. | Great Meadows | 100 | 18,454(0.54%)#24 | 1,802,745(0.01%)#2,260 |
| 25. | Ocean Acres | 98 | 18,454(0.53%)#25 | 1,802,745(0.01%)#2,281 |
| 26. | Moorestown Lenola | 92 | 18,454(0.50%)#26 | 1,802,745(0.01%)#2,415 |
| 27. | Toms River | 91 | 18,454(0.49%)#27 | 1,802,745(0.01%)#2,428 |
| 28. | Morristown | 90 | 18,454(0.49%)#28 | 1,802,745(0.00%)#2,452 |
| 29. | Somerville Borough | 88 | 18,454(0.48%)#29 | 1,802,745(0.00%)#2,501 |
| 30. | Bellmawr Borough | 87 | 18,454(0.47%)#30 | 1,802,745(0.00%)#2,522 |
| 31. | West New York | 86 | 18,454(0.47%)#31 | 1,802,745(0.00%)#2,537 |
| 32. | Hillsborough | 84 | 18,454(0.46%)#32 | 1,802,745(0.00%)#2,584 |
| 33. | Paramus Borough | 83 | 18,454(0.45%)#33 | 1,802,745(0.00%)#2,601 |
| 34. | Somerset | 78 | 18,454(0.42%)#34 | 1,802,745(0.00%)#2,727 |
| 35. | Seaside Heights Borough | 78 | 18,454(0.42%)#35 | 1,802,745(0.00%)#2,740 |
| 36. | River Edge Borough | 76 | 18,454(0.41%)#36 | 1,802,745(0.00%)#2,784 |
| 37. | Budd Lake | 74 | 18,454(0.40%)#37 | 1,802,745(0.00%)#2,831 |
| 38. | Parsippany | 72 | 18,454(0.39%)#38 | 1,802,745(0.00%)#2,884 |
| 39. | Newton | 70 | 18,454(0.38%)#39 | 1,802,745(0.00%)#2,939 |
| 40. | Oceanport Borough | 70 | 18,454(0.38%)#40 | 1,802,745(0.00%)#2,942 |
| 41. | Ridgewood | 69 | 18,454(0.37%)#41 | 1,802,745(0.00%)#2,954 |
| 42. | Mystic Island | 69 | 18,454(0.37%)#42 | 1,802,745(0.00%)#2,965 |
| 43. | Highland Park Borough | 68 | 18,454(0.37%)#43 | 1,802,745(0.00%)#2,995 |
| 44. | Robertsville | 68 | 18,454(0.37%)#44 | 1,802,745(0.00%)#2,996 |
| 45. | Chatham Borough | 66 | 18,454(0.36%)#45 | 1,802,745(0.00%)#3,059 |
| 46. | Leisuretowne | 66 | 18,454(0.36%)#46 | 1,802,745(0.00%)#3,072 |
| 47. | Eatontown Borough | 65 | 18,454(0.35%)#47 | 1,802,745(0.00%)#3,091 |
| 48. | Hamilton Square | 64 | 18,454(0.35%)#48 | 1,802,745(0.00%)#3,132 |
| 49. | Northfield | 63 | 18,454(0.34%)#49 | 1,802,745(0.00%)#3,162 |
| 50. | Landing | 63 | 18,454(0.34%)#50 | 1,802,745(0.00%)#3,166 |
| 51. | Smithville | 62 | 18,454(0.34%)#51 | 1,802,745(0.00%)#3,199 |
| 52. | Old Bridge | 59 | 18,454(0.32%)#52 | 1,802,745(0.00%)#3,292 |
| 53. | Long Branch | 58 | 18,454(0.31%)#53 | 1,802,745(0.00%)#3,326 |
| 54. | Middlesex Borough | 58 | 18,454(0.31%)#54 | 1,802,745(0.00%)#3,330 |
| 55. | Seaville | 58 | 18,454(0.31%)#55 | 1,802,745(0.00%)#3,347 |
| 56. | Kendall Park | 55 | 18,454(0.30%)#56 | 1,802,745(0.00%)#3,456 |
| 57. | Pine Hill Borough | 54 | 18,454(0.29%)#57 | 1,802,745(0.00%)#3,498 |
| 58. | Bayonne | 53 | 18,454(0.29%)#58 | 1,802,745(0.00%)#3,523 |
| 59. | Gloucester City | 52 | 18,454(0.28%)#59 | 1,802,745(0.00%)#3,571 |
| 60. | Somers Point | 51 | 18,454(0.28%)#60 | 1,802,745(0.00%)#3,628 |
| 61. | Point Pleasant Borough | 50 | 18,454(0.27%)#61 | 1,802,745(0.00%)#3,659 |
| 62. | Madison Borough | 50 | 18,454(0.27%)#62 | 1,802,745(0.00%)#3,662 |
| 63. | Upper Montclair | 50 | 18,454(0.27%)#63 | 1,802,745(0.00%)#3,670 |
| 64. | Martinsville | 49 | 18,454(0.27%)#64 | 1,802,745(0.00%)#3,726 |
| 65. | Annandale | 49 | 18,454(0.27%)#65 | 1,802,745(0.00%)#3,752 |
| 66. | Vernon Valley | 49 | 18,454(0.27%)#66 | 1,802,745(0.00%)#3,756 |
| 67. | Passaic | 48 | 18,454(0.26%)#67 | 1,802,745(0.00%)#3,763 |
| 68. | Hasbrouck Heights Borough | 48 | 18,454(0.26%)#68 | 1,802,745(0.00%)#3,780 |
| 69. | Raritan Borough | 48 | 18,454(0.26%)#69 | 1,802,745(0.00%)#3,786 |
| 70. | Hopatcong Borough | 47 | 18,454(0.25%)#70 | 1,802,745(0.00%)#3,832 |
| 71. | Princeton Meadows | 45 | 18,454(0.24%)#71 | 1,802,745(0.00%)#3,933 |
| 72. | Pine Lake Park | 45 | 18,454(0.24%)#72 | 1,802,745(0.00%)#3,938 |
| 73. | Jamesburg Borough | 45 | 18,454(0.24%)#73 | 1,802,745(0.00%)#3,947 |
| 74. | Yorketown | 44 | 18,454(0.24%)#74 | 1,802,745(0.00%)#3,996 |
| 75. | Port Monmouth | 44 | 18,454(0.24%)#75 | 1,802,745(0.00%)#4,009 |
| 76. | Midland Park Borough | 43 | 18,454(0.23%)#76 | 1,802,745(0.00%)#4,055 |
| 77. | Bradley Gardens | 42 | 18,454(0.23%)#77 | 1,802,745(0.00%)#4,090 |
| 78. | Emerson Borough | 42 | 18,454(0.23%)#78 | 1,802,745(0.00%)#4,100 |
| 79. | Layton | 41 | 18,454(0.22%)#79 | 1,802,745(0.00%)#4,185 |
| 80. | Englewood | 40 | 18,454(0.22%)#80 | 1,802,745(0.00%)#4,196 |
| 81. | Summit | 40 | 18,454(0.22%)#81 | 1,802,745(0.00%)#4,199 |
| 82. | Crestwood Village | 40 | 18,454(0.22%)#82 | 1,802,745(0.00%)#4,217 |
| 83. | Upper Greenwood Lake | 40 | 18,454(0.22%)#83 | 1,802,745(0.00%)#4,227 |
| 84. | Greenwich | 40 | 18,454(0.22%)#84 | 1,802,745(0.00%)#4,234 |
| 85. | Cranford | 40 | 18,454(0.22%)#85 | 1,802,745(0.00%)#4,239 |
| 86. | Hopewell Borough | 39 | 18,454(0.21%)#86 | 1,802,745(0.00%)#4,308 |
| 87. | New Providence Borough | 38 | 18,454(0.21%)#87 | 1,802,745(0.00%)#4,339 |
| 88. | Oak Ridge | 38 | 18,454(0.21%)#88 | 1,802,745(0.00%)#4,342 |
| 89. | Roebling | 38 | 18,454(0.21%)#89 | 1,802,745(0.00%)#4,368 |
| 90. | Ten Mile Run | 38 | 18,454(0.21%)#90 | 1,802,745(0.00%)#4,378 |
| 91. | Cologne | 38 | 18,454(0.21%)#91 | 1,802,745(0.00%)#4,384 |
| 92. | Plainfield | 37 | 18,454(0.20%)#92 | 1,802,745(0.00%)#4,394 |
| 93. | Rockaway Borough | 37 | 18,454(0.20%)#93 | 1,802,745(0.00%)#4,427 |
| 94. | Glassboro Borough | 36 | 18,454(0.20%)#94 | 1,802,745(0.00%)#4,473 |
| 95. | Point Pleasant Beach Borough | 36 | 18,454(0.20%)#95 | 1,802,745(0.00%)#4,504 |
| 96. | Hawthorne Borough | 35 | 18,454(0.19%)#96 | 1,802,745(0.00%)#4,543 |
| 97. | Florham Park Borough | 35 | 18,454(0.19%)#97 | 1,802,745(0.00%)#4,554 |
| 98. | Ringwood Borough | 35 | 18,454(0.19%)#98 | 1,802,745(0.00%)#4,556 |
| 99. | Shark River Hills | 35 | 18,454(0.19%)#99 | 1,802,745(0.00%)#4,576 |
| 100. | Freehold Borough | 34 | 18,454(0.18%)#100 | 1,802,745(0.00%)#4,621 |
Common Questions
What are the Top 10 Cities with the Largest French Canadian Community in New Jersey?
Top 10 Cities with the Largest French Canadian Community in New Jersey are:
#1
308
#2
278
#3
264
#4
180
#5
152
#6
149
#7
123
#8
122
#9
114
#10
112
What city has the Largest French Canadian Community in New Jersey?
Clifton has the Largest French Canadian Community in New Jersey with 308.
What is the Total French Canadian Population in the State of New Jersey?
Total French Canadian Population in New Jersey is 18,454.
What is the Total French Canadian Population in the United States?
Total French Canadian Population in the United States is 1,802,745.