Cities with the Most Immigrants from Guyana in New Jersey
RELATED REPORTS & OPTIONS
Guyana
New Jersey
Compare Cities
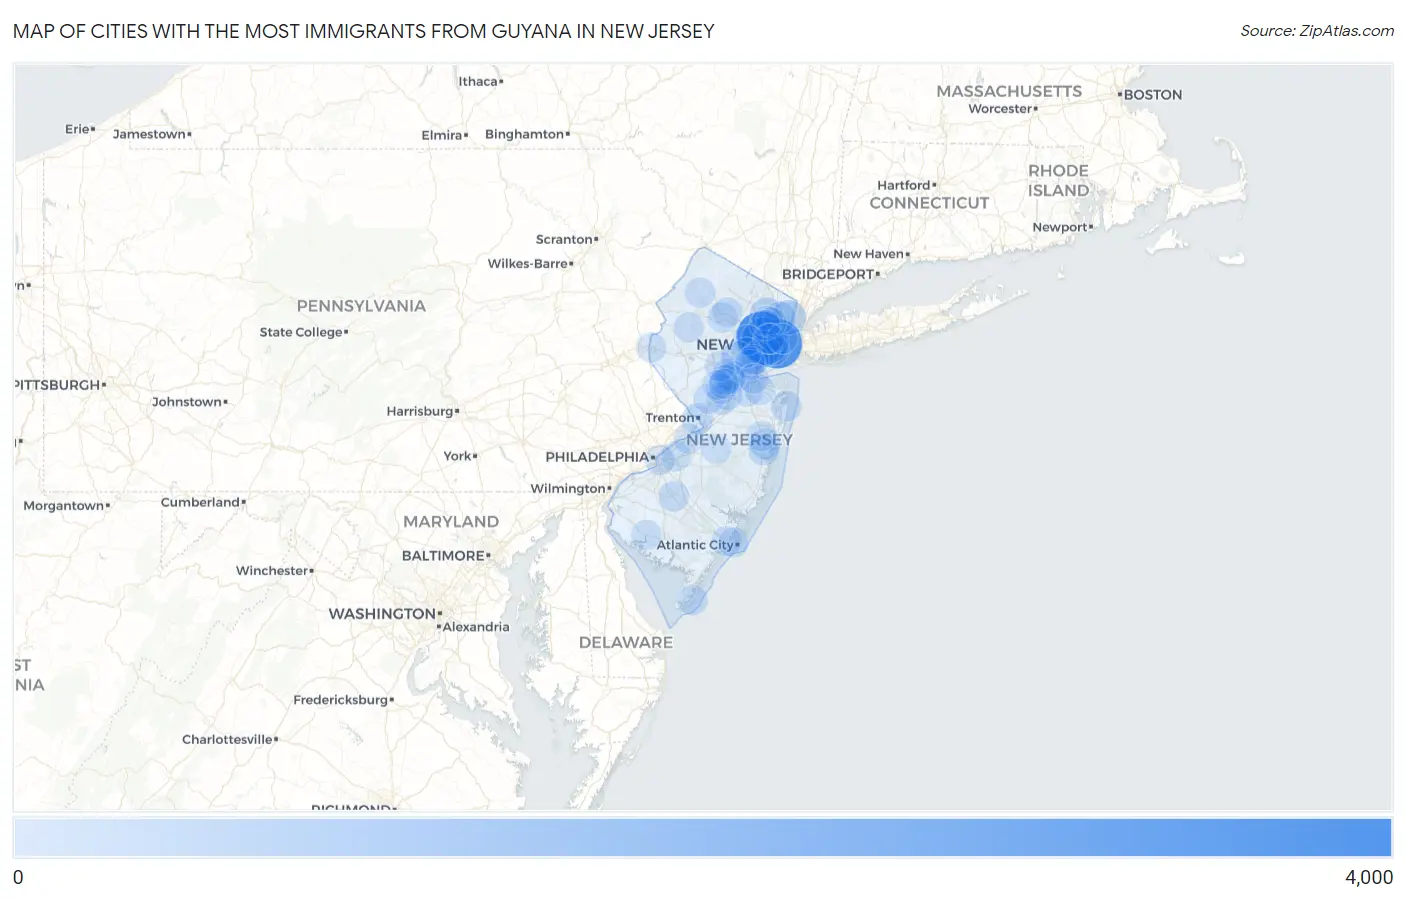
Map of Cities with the Most Immigrants from Guyana in New Jersey
0
4,000
Cities with the Most Immigrants from Guyana in New Jersey
| City | Guyana | vs State | vs National | |
| 1. | East Orange | 3,225 | 26,173(12.32%)#1 | 287,198(1.12%)#3 |
| 2. | Jersey City | 3,194 | 26,173(12.20%)#2 | 287,198(1.11%)#4 |
| 3. | Newark | 2,898 | 26,173(11.07%)#3 | 287,198(1.01%)#5 |
| 4. | Englewood | 680 | 26,173(2.60%)#4 | 287,198(0.24%)#20 |
| 5. | Plainfield | 403 | 26,173(1.54%)#5 | 287,198(0.14%)#42 |
| 6. | Paterson | 391 | 26,173(1.49%)#6 | 287,198(0.14%)#44 |
| 7. | Linden | 349 | 26,173(1.33%)#7 | 287,198(0.12%)#58 |
| 8. | Elizabeth | 300 | 26,173(1.15%)#8 | 287,198(0.10%)#67 |
| 9. | North Plainfield Borough | 298 | 26,173(1.14%)#9 | 287,198(0.10%)#68 |
| 10. | Hackensack | 264 | 26,173(1.01%)#10 | 287,198(0.09%)#80 |
| 11. | New Brunswick | 249 | 26,173(0.95%)#11 | 287,198(0.09%)#87 |
| 12. | Roselle Borough | 234 | 26,173(0.89%)#12 | 287,198(0.08%)#95 |
| 13. | South Plainfield Borough | 232 | 26,173(0.89%)#13 | 287,198(0.08%)#96 |
| 14. | Ampere North | 212 | 26,173(0.81%)#14 | 287,198(0.07%)#106 |
| 15. | Trenton | 204 | 26,173(0.78%)#15 | 287,198(0.07%)#109 |
| 16. | Sayreville Borough | 180 | 26,173(0.69%)#16 | 287,198(0.06%)#128 |
| 17. | Bergenfield Borough | 169 | 26,173(0.65%)#17 | 287,198(0.06%)#138 |
| 18. | Leisure Village | 154 | 26,173(0.59%)#18 | 287,198(0.05%)#161 |
| 19. | Toms River | 150 | 26,173(0.57%)#19 | 287,198(0.05%)#164 |
| 20. | Menlo Park Terrace | 146 | 26,173(0.56%)#20 | 287,198(0.05%)#170 |
| 21. | Clifton | 126 | 26,173(0.48%)#21 | 287,198(0.04%)#200 |
| 22. | Long Branch | 113 | 26,173(0.43%)#22 | 287,198(0.04%)#230 |
| 23. | Old Bridge | 111 | 26,173(0.42%)#23 | 287,198(0.04%)#234 |
| 24. | New Milford Borough | 110 | 26,173(0.42%)#24 | 287,198(0.04%)#239 |
| 25. | Wildwood | 110 | 26,173(0.42%)#25 | 287,198(0.04%)#240 |
| 26. | Lindenwold Borough | 104 | 26,173(0.40%)#26 | 287,198(0.04%)#252 |
| 27. | Somerset | 101 | 26,173(0.39%)#27 | 287,198(0.04%)#260 |
| 28. | Colonia | 98 | 26,173(0.37%)#28 | 287,198(0.03%)#262 |
| 29. | Williamstown | 95 | 26,173(0.36%)#29 | 287,198(0.03%)#270 |
| 30. | Midland Park Borough | 93 | 26,173(0.36%)#30 | 287,198(0.03%)#274 |
| 31. | South Bound Brook Borough | 82 | 26,173(0.31%)#31 | 287,198(0.03%)#302 |
| 32. | Carteret Borough | 80 | 26,173(0.31%)#32 | 287,198(0.03%)#308 |
| 33. | Passaic | 74 | 26,173(0.28%)#33 | 287,198(0.03%)#326 |
| 34. | Middlesex Borough | 74 | 26,173(0.28%)#34 | 287,198(0.03%)#332 |
| 35. | Bayonne | 73 | 26,173(0.28%)#35 | 287,198(0.03%)#337 |
| 36. | Union | 70 | 26,173(0.27%)#36 | 287,198(0.02%)#361 |
| 37. | Bogota Borough | 67 | 26,173(0.26%)#37 | 287,198(0.02%)#375 |
| 38. | East Franklin | 58 | 26,173(0.22%)#38 | 287,198(0.02%)#411 |
| 39. | Whippany | 58 | 26,173(0.22%)#39 | 287,198(0.02%)#412 |
| 40. | Kearny | 57 | 26,173(0.22%)#40 | 287,198(0.02%)#413 |
| 41. | Palisades Park Borough | 56 | 26,173(0.21%)#41 | 287,198(0.02%)#424 |
| 42. | Bridgeton | 54 | 26,173(0.21%)#42 | 287,198(0.02%)#434 |
| 43. | Westmont | 54 | 26,173(0.21%)#43 | 287,198(0.02%)#437 |
| 44. | Ridgefield Borough | 52 | 26,173(0.20%)#44 | 287,198(0.02%)#455 |
| 45. | Magnolia Borough | 51 | 26,173(0.19%)#45 | 287,198(0.02%)#460 |
| 46. | Lodi Borough | 49 | 26,173(0.19%)#46 | 287,198(0.02%)#475 |
| 47. | Brookdale | 48 | 26,173(0.18%)#47 | 287,198(0.02%)#485 |
| 48. | Dayton | 48 | 26,173(0.18%)#48 | 287,198(0.02%)#486 |
| 49. | Princeton | 47 | 26,173(0.18%)#49 | 287,198(0.02%)#490 |
| 50. | Princeton Meadows | 46 | 26,173(0.18%)#50 | 287,198(0.02%)#503 |
| 51. | Watsessing | 46 | 26,173(0.18%)#51 | 287,198(0.02%)#505 |
| 52. | Wharton Borough | 45 | 26,173(0.17%)#52 | 287,198(0.02%)#516 |
| 53. | Strathmore | 45 | 26,173(0.17%)#53 | 287,198(0.02%)#517 |
| 54. | Oak Ridge | 44 | 26,173(0.17%)#54 | 287,198(0.02%)#525 |
| 55. | Parsippany | 43 | 26,173(0.16%)#55 | 287,198(0.01%)#536 |
| 56. | South River Borough | 43 | 26,173(0.16%)#56 | 287,198(0.01%)#537 |
| 57. | Voorhees | 43 | 26,173(0.16%)#57 | 287,198(0.01%)#543 |
| 58. | Phillipsburg | 41 | 26,173(0.16%)#58 | 287,198(0.01%)#554 |
| 59. | Matawan Borough | 40 | 26,173(0.15%)#59 | 287,198(0.01%)#567 |
| 60. | Riverdale Borough | 40 | 26,173(0.15%)#60 | 287,198(0.01%)#569 |
| 61. | Newton | 39 | 26,173(0.15%)#61 | 287,198(0.01%)#576 |
| 62. | Kendall Park | 37 | 26,173(0.14%)#62 | 287,198(0.01%)#588 |
| 63. | Six Mile Run | 37 | 26,173(0.14%)#63 | 287,198(0.01%)#590 |
| 64. | Cliffside Park Borough | 36 | 26,173(0.14%)#64 | 287,198(0.01%)#595 |
| 65. | Dorothy | 36 | 26,173(0.14%)#65 | 287,198(0.01%)#601 |
| 66. | Finderne | 35 | 26,173(0.13%)#66 | 287,198(0.01%)#617 |
| 67. | Clementon Borough | 35 | 26,173(0.13%)#67 | 287,198(0.01%)#618 |
| 68. | Pleasantville | 34 | 26,173(0.13%)#68 | 287,198(0.01%)#623 |
| 69. | Moorestown Lenola | 34 | 26,173(0.13%)#69 | 287,198(0.01%)#624 |
| 70. | Rutgers University-Busch Campus | 34 | 26,173(0.13%)#70 | 287,198(0.01%)#628 |
| 71. | Iselin | 32 | 26,173(0.12%)#71 | 287,198(0.01%)#648 |
| 72. | Burlington | 32 | 26,173(0.12%)#72 | 287,198(0.01%)#650 |
| 73. | Dover | 31 | 26,173(0.12%)#73 | 287,198(0.01%)#657 |
| 74. | Camden | 30 | 26,173(0.11%)#74 | 287,198(0.01%)#664 |
| 75. | Beattystown | 30 | 26,173(0.11%)#75 | 287,198(0.01%)#674 |
| 76. | Dumont Borough | 28 | 26,173(0.11%)#76 | 287,198(0.01%)#696 |
| 77. | White Meadow Lake | 27 | 26,173(0.10%)#77 | 287,198(0.01%)#717 |
| 78. | Griggstown | 27 | 26,173(0.10%)#78 | 287,198(0.01%)#720 |
| 79. | Ramsey Borough | 26 | 26,173(0.10%)#79 | 287,198(0.01%)#731 |
| 80. | Short Hills | 26 | 26,173(0.10%)#80 | 287,198(0.01%)#732 |
| 81. | Somerville Borough | 25 | 26,173(0.10%)#81 | 287,198(0.01%)#748 |
| 82. | Sicklerville | 24 | 26,173(0.09%)#82 | 287,198(0.01%)#756 |
| 83. | Rahway | 24 | 26,173(0.09%)#83 | 287,198(0.01%)#761 |
| 84. | Manville Borough | 24 | 26,173(0.09%)#84 | 287,198(0.01%)#770 |
| 85. | Lakewood | 23 | 26,173(0.09%)#85 | 287,198(0.01%)#781 |
| 86. | Hoboken | 22 | 26,173(0.08%)#86 | 287,198(0.01%)#795 |
| 87. | Atlantic City | 22 | 26,173(0.08%)#87 | 287,198(0.01%)#799 |
| 88. | River Edge Borough | 22 | 26,173(0.08%)#88 | 287,198(0.01%)#806 |
| 89. | Paramus Borough | 21 | 26,173(0.08%)#89 | 287,198(0.01%)#820 |
| 90. | Ringwood Borough | 21 | 26,173(0.08%)#90 | 287,198(0.01%)#827 |
| 91. | Pine Brook | 21 | 26,173(0.08%)#91 | 287,198(0.01%)#831 |
| 92. | Dunellen Borough | 20 | 26,173(0.08%)#92 | 287,198(0.01%)#860 |
| 93. | Westfield | 19 | 26,173(0.07%)#93 | 287,198(0.01%)#875 |
| 94. | Harrison | 19 | 26,173(0.07%)#94 | 287,198(0.01%)#877 |
| 95. | Franklin Park | 19 | 26,173(0.07%)#95 | 287,198(0.01%)#880 |
| 96. | South Amboy | 19 | 26,173(0.07%)#96 | 287,198(0.01%)#884 |
| 97. | Spring Lake Borough | 19 | 26,173(0.07%)#97 | 287,198(0.01%)#894 |
| 98. | Hawthorne Borough | 18 | 26,173(0.07%)#98 | 287,198(0.01%)#908 |
| 99. | Raritan Borough | 18 | 26,173(0.07%)#99 | 287,198(0.01%)#912 |
| 100. | Fort Dix | 18 | 26,173(0.07%)#100 | 287,198(0.01%)#913 |
Common Questions
What are the Top 10 Cities with the Most Immigrants from Guyana in New Jersey?
Top 10 Cities with the Most Immigrants from Guyana in New Jersey are:
#1
3,225
#2
3,194
#3
2,898
#4
680
#5
403
#6
391
#7
349
#8
300
#9
264
#10
249
What city has the Most Immigrants from Guyana in New Jersey?
East Orange has the Most Immigrants from Guyana in New Jersey with 3,225.
What is the Total Immigrants from Guyana in the State of New Jersey?
Total Immigrants from Guyana in New Jersey is 26,173.
What is the Total Immigrants from Guyana in the United States?
Total Immigrants from Guyana in the United States is 287,198.