Greenwich, NJ Map & Demographics
Greenwich Map
Greenwich Overview
$52,314
PER CAPITA INCOME
$167,121
AVG FAMILY INCOME
$162,000
AVG HOUSEHOLD INCOME
29.0%
WAGE / INCOME GAP [ % ]
71.0¢/ $1
WAGE / INCOME GAP [ $ ]
0.25
INEQUALITY / GINI INDEX
2,866
TOTAL POPULATION
1,507
MALE POPULATION
1,359
FEMALE POPULATION
110.89
MALES / 100 FEMALES
90.18
FEMALES / 100 MALES
38.2
MEDIAN AGE
3.5
AVG FAMILY SIZE
3.3
AVG HOUSEHOLD SIZE
1,697
LABOR FORCE [ PEOPLE ]
76.7%
PERCENT IN LABOR FORCE
7.2%
UNEMPLOYMENT RATE
Greenwich Zip Codes
Greenwich Area Codes
Income in Greenwich
Income Overview in Greenwich
Per Capita Income in Greenwich is $52,314, while median incomes of families and households are $167,121 and $162,000 respectively.
| Characteristic | Number | Measure |
| Per Capita Income | 2,866 | $52,314 |
| Median Family Income | 752 | $167,121 |
| Mean Family Income | 752 | $179,827 |
| Median Household Income | 866 | $162,000 |
| Mean Household Income | 866 | $175,773 |
| Income Deficit | 752 | $0 |
| Wage / Income Gap (%) | 2,866 | 28.95% |
| Wage / Income Gap ($) | 2,866 | 71.05¢ per $1 |
| Gini / Inequality Index | 2,866 | 0.25 |
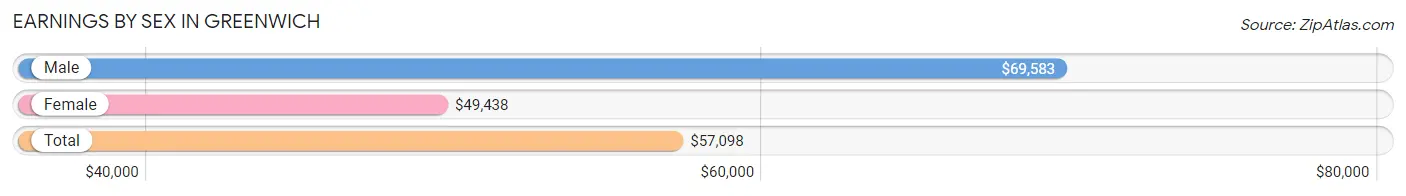
Earnings by Sex in Greenwich
Average Earnings in Greenwich are $57,098, $69,583 for men and $49,438 for women, a difference of 28.9%.
| Sex | Number | Average Earnings |
| Male | 904 (52.5%) | $69,583 |
| Female | 817 (47.5%) | $49,438 |
| Total | 1,721 (100.0%) | $57,098 |
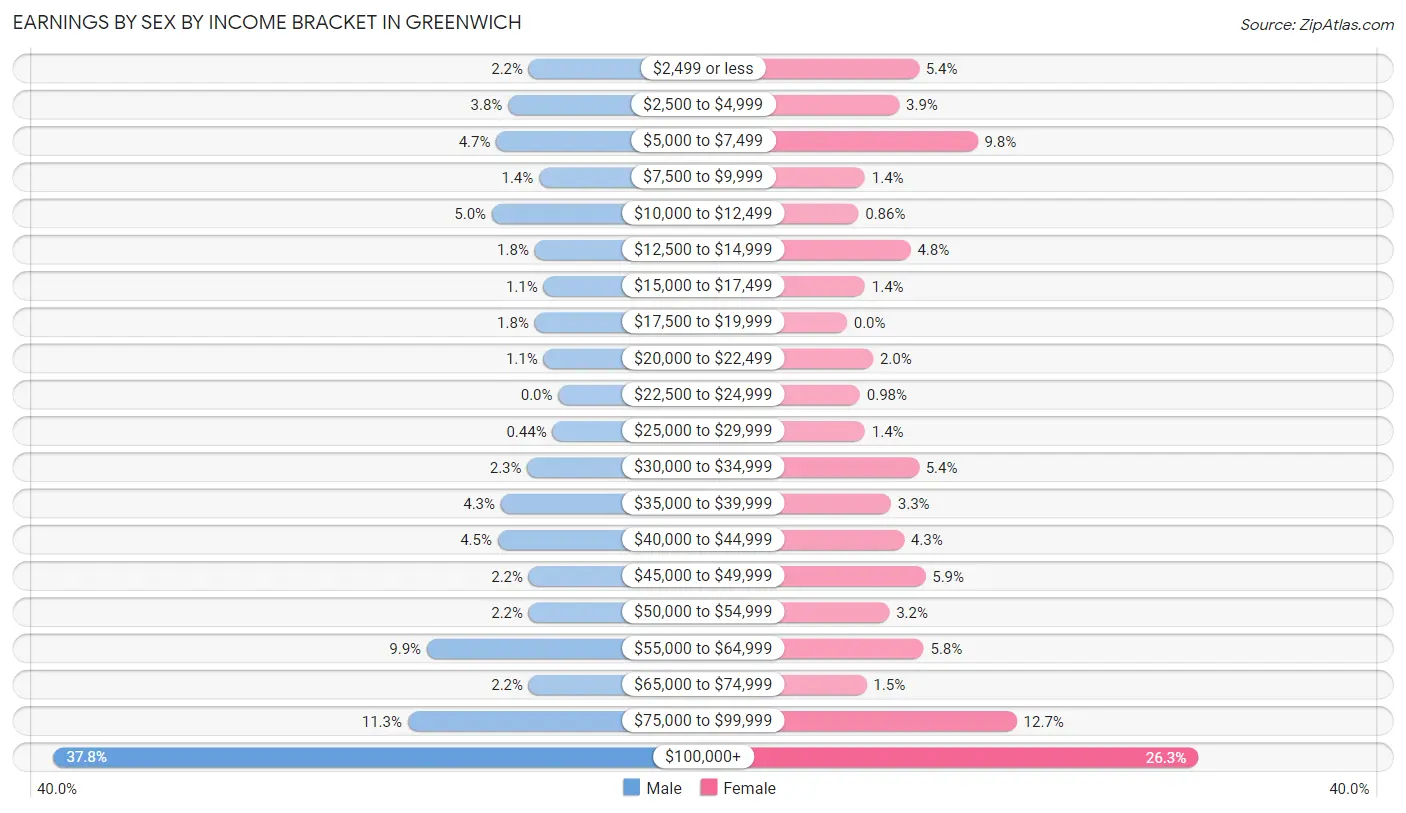
Earnings by Sex by Income Bracket in Greenwich
The most common earnings brackets in Greenwich are $100,000+ for men (342 | 37.8%) and $100,000+ for women (215 | 26.3%).
| Income | Male | Female |
| $2,499 or less | 20 (2.2%) | 44 (5.4%) |
| $2,500 to $4,999 | 34 (3.8%) | 32 (3.9%) |
| $5,000 to $7,499 | 42 (4.6%) | 80 (9.8%) |
| $7,500 to $9,999 | 13 (1.4%) | 11 (1.3%) |
| $10,000 to $12,499 | 45 (5.0%) | 7 (0.9%) |
| $12,500 to $14,999 | 16 (1.8%) | 39 (4.8%) |
| $15,000 to $17,499 | 10 (1.1%) | 11 (1.3%) |
| $17,500 to $19,999 | 16 (1.8%) | 0 (0.0%) |
| $20,000 to $22,499 | 10 (1.1%) | 16 (2.0%) |
| $22,500 to $24,999 | 0 (0.0%) | 8 (1.0%) |
| $25,000 to $29,999 | 4 (0.4%) | 11 (1.3%) |
| $30,000 to $34,999 | 21 (2.3%) | 44 (5.4%) |
| $35,000 to $39,999 | 39 (4.3%) | 27 (3.3%) |
| $40,000 to $44,999 | 41 (4.5%) | 35 (4.3%) |
| $45,000 to $49,999 | 20 (2.2%) | 48 (5.9%) |
| $50,000 to $54,999 | 20 (2.2%) | 26 (3.2%) |
| $55,000 to $64,999 | 89 (9.9%) | 47 (5.8%) |
| $65,000 to $74,999 | 20 (2.2%) | 12 (1.5%) |
| $75,000 to $99,999 | 102 (11.3%) | 104 (12.7%) |
| $100,000+ | 342 (37.8%) | 215 (26.3%) |
| Total | 904 (100.0%) | 817 (100.0%) |
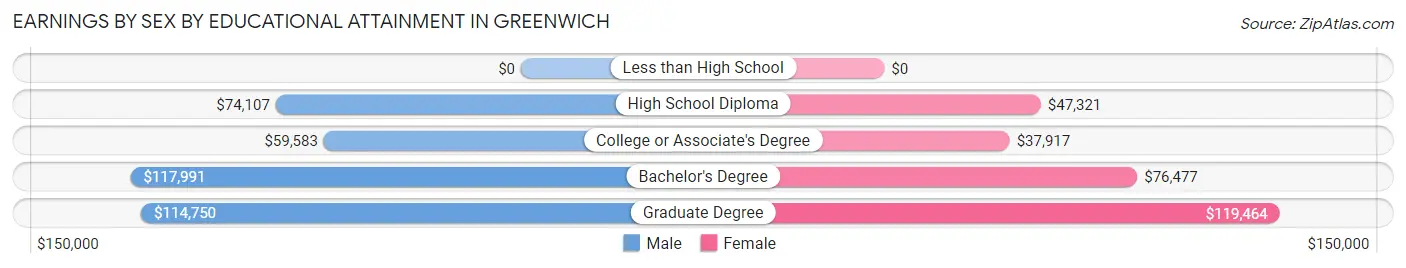
Earnings by Sex by Educational Attainment in Greenwich
Average earnings in Greenwich are $91,375 for men and $57,059 for women, a difference of 37.6%. Men with an educational attainment of bachelor's degree enjoy the highest average annual earnings of $117,991, while those with college or associate's degree education earn the least with $59,583. Women with an educational attainment of graduate degree earn the most with the average annual earnings of $119,464, while those with college or associate's degree education have the smallest earnings of $37,917.
| Educational Attainment | Male Income | Female Income |
| Less than High School | - | - |
| High School Diploma | $74,107 | $47,321 |
| College or Associate's Degree | $59,583 | $37,917 |
| Bachelor's Degree | $117,991 | $76,477 |
| Graduate Degree | $114,750 | $119,464 |
| Total | $91,375 | $57,059 |
Family Income in Greenwich
Family Income Brackets in Greenwich
According to the Greenwich family income data, there are 310 families falling into the $150,000 to $199,999 income range, which is the most common income bracket and makes up 41.2% of all families.
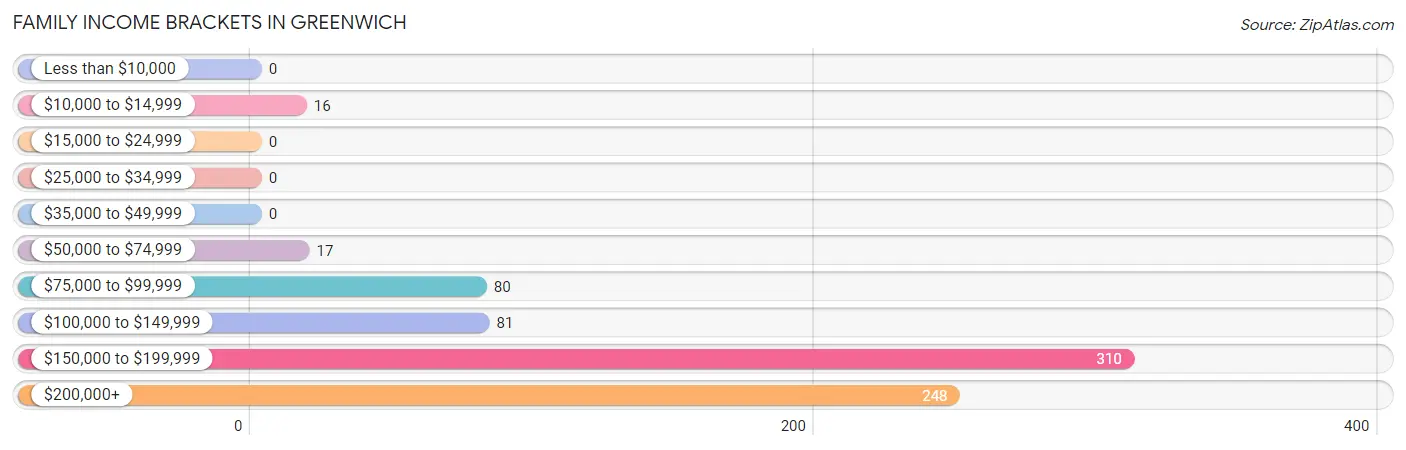
| Income Bracket | # Families | % Families |
| Less than $10,000 | 0 | 0.0% |
| $10,000 to $14,999 | 16 | 2.1% |
| $15,000 to $24,999 | 0 | 0.0% |
| $25,000 to $34,999 | 0 | 0.0% |
| $35,000 to $49,999 | 0 | 0.0% |
| $50,000 to $74,999 | 17 | 2.3% |
| $75,000 to $99,999 | 80 | 10.6% |
| $100,000 to $149,999 | 81 | 10.8% |
| $150,000 to $199,999 | 310 | 41.2% |
| $200,000+ | 248 | 33.0% |
Family Income by Famaliy Size in Greenwich
4-person families (273 | 36.3%) account for the highest median family income in Greenwich with $196,641 per family, while 2-person families (145 | 19.3%) have the highest median income of $82,527 per family member.
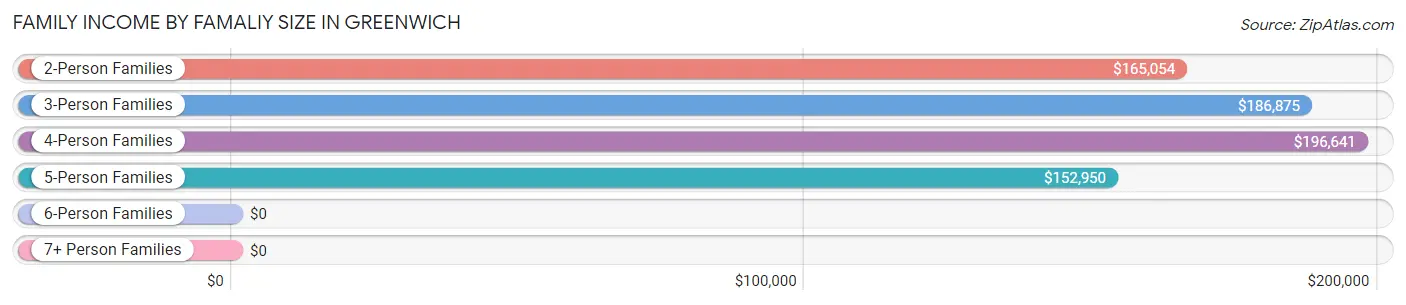
| Income Bracket | # Families | Median Income |
| 2-Person Families | 145 (19.3%) | $165,054 |
| 3-Person Families | 220 (29.3%) | $186,875 |
| 4-Person Families | 273 (36.3%) | $196,641 |
| 5-Person Families | 104 (13.8%) | $152,950 |
| 6-Person Families | 0 (0.0%) | $0 |
| 7+ Person Families | 10 (1.3%) | $0 |
| Total | 752 (100.0%) | $167,121 |
Family Income by Number of Earners in Greenwich
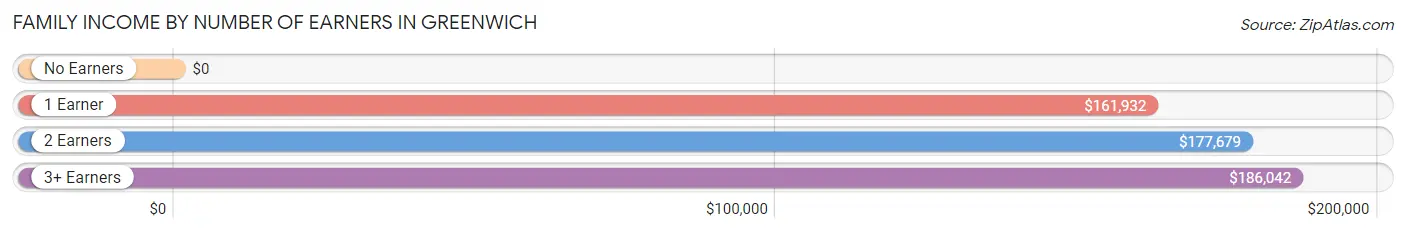
| Number of Earners | # Families | Median Income |
| No Earners | 24 (3.2%) | $0 |
| 1 Earner | 177 (23.5%) | $161,932 |
| 2 Earners | 309 (41.1%) | $177,679 |
| 3+ Earners | 242 (32.2%) | $186,042 |
| Total | 752 (100.0%) | $167,121 |
Household Income in Greenwich
Household Income Brackets in Greenwich
With 320 households falling in the category, the $150,000 to $199,999 income range is the most frequent in Greenwich, accounting for 36.9% of all households.
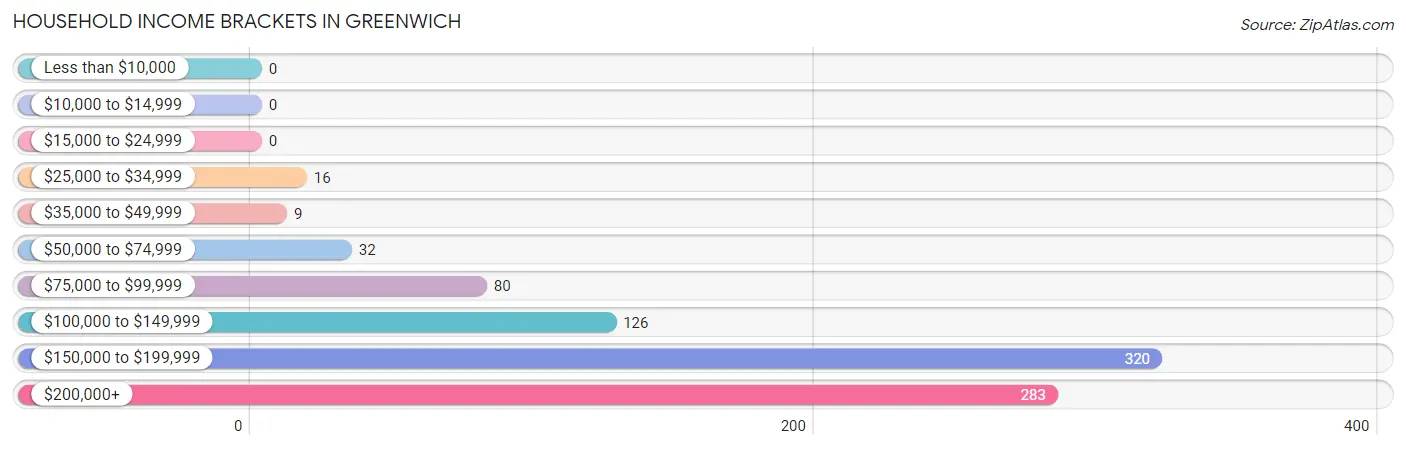
| Income Bracket | # Households | % Households |
| Less than $10,000 | 0 | 0.0% |
| $10,000 to $14,999 | 0 | 0.0% |
| $15,000 to $24,999 | 0 | 0.0% |
| $25,000 to $34,999 | 16 | 1.8% |
| $35,000 to $49,999 | 9 | 1.0% |
| $50,000 to $74,999 | 32 | 3.7% |
| $75,000 to $99,999 | 80 | 9.2% |
| $100,000 to $149,999 | 126 | 14.5% |
| $150,000 to $199,999 | 320 | 37.0% |
| $200,000+ | 283 | 32.7% |
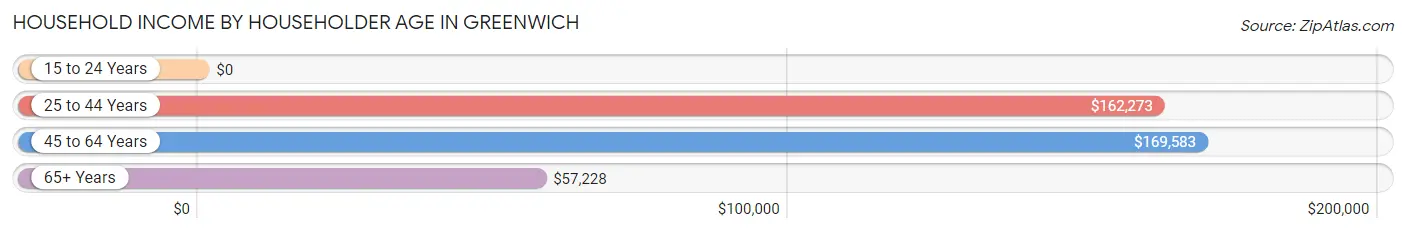
Household Income by Householder Age in Greenwich
The median household income in Greenwich is $162,000, with the highest median household income of $169,583 found in the 45 to 64 years age bracket for the primary householder. A total of 573 households (66.2%) fall into this category.
| Income Bracket | # Households | Median Income |
| 15 to 24 Years | 0 (0.0%) | $0 |
| 25 to 44 Years | 234 (27.0%) | $162,273 |
| 45 to 64 Years | 573 (66.2%) | $169,583 |
| 65+ Years | 59 (6.8%) | $57,228 |
| Total | 866 (100.0%) | $162,000 |
Poverty in Greenwich
Income Below Poverty by Sex and Age in Greenwich
With 0.9% poverty level for males and 5.1% for females among the residents of Greenwich, 18 to 24 year old males and under 5 year old females are the most vulnerable to poverty, with 13 males (5.3%) and 39 females (61.9%) in their respective age groups living below the poverty level.
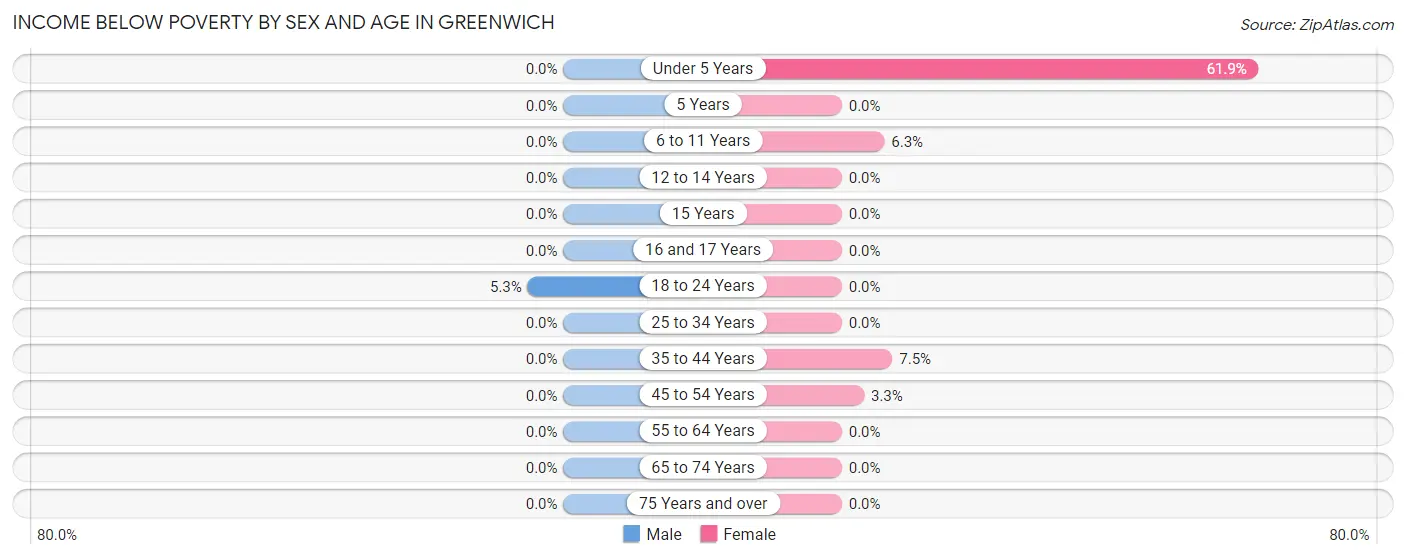
| Age Bracket | Male | Female |
| Under 5 Years | 0 (0.0%) | 39 (61.9%) |
| 5 Years | 0 (0.0%) | 0 (0.0%) |
| 6 to 11 Years | 0 (0.0%) | 6 (6.3%) |
| 12 to 14 Years | 0 (0.0%) | 0 (0.0%) |
| 15 Years | 0 (0.0%) | 0 (0.0%) |
| 16 and 17 Years | 0 (0.0%) | 0 (0.0%) |
| 18 to 24 Years | 13 (5.3%) | 0 (0.0%) |
| 25 to 34 Years | 0 (0.0%) | 0 (0.0%) |
| 35 to 44 Years | 0 (0.0%) | 16 (7.5%) |
| 45 to 54 Years | 0 (0.0%) | 9 (3.3%) |
| 55 to 64 Years | 0 (0.0%) | 0 (0.0%) |
| 65 to 74 Years | 0 (0.0%) | 0 (0.0%) |
| 75 Years and over | 0 (0.0%) | 0 (0.0%) |
| Total | 13 (0.9%) | 70 (5.1%) |
Income Above Poverty by Sex and Age in Greenwich
According to the poverty statistics in Greenwich, males aged under 5 years and females aged 5 years are the age groups that are most secure financially, with 100.0% of males and 100.0% of females in these age groups living above the poverty line.
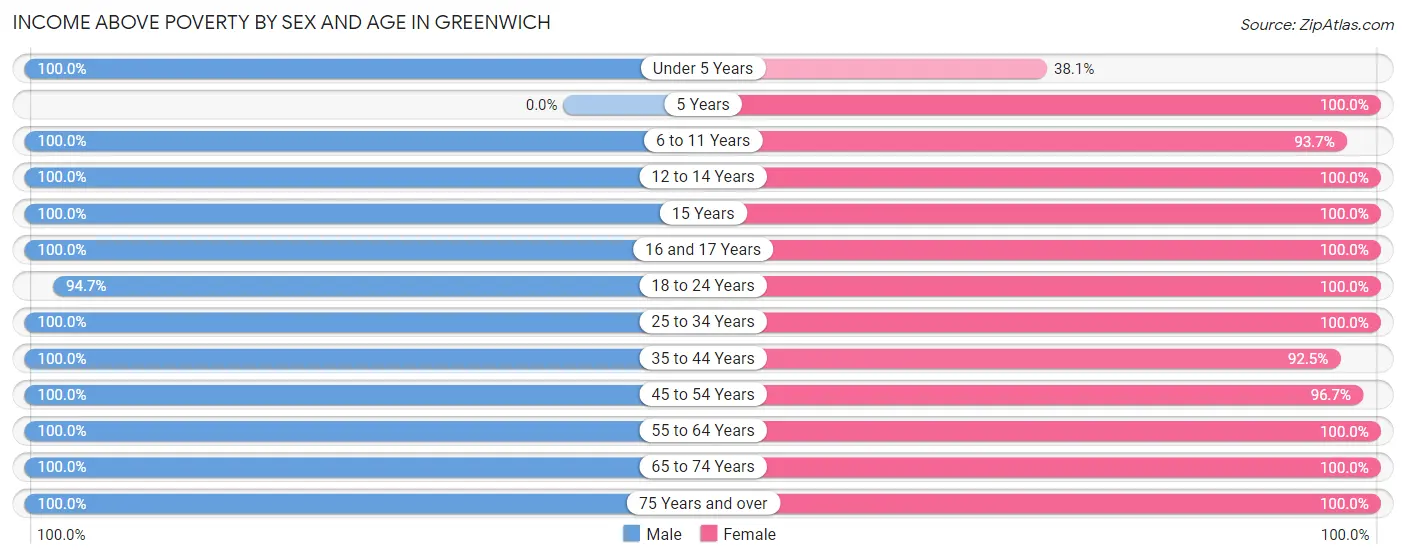
| Age Bracket | Male | Female |
| Under 5 Years | 49 (100.0%) | 24 (38.1%) |
| 5 Years | 0 (0.0%) | 13 (100.0%) |
| 6 to 11 Years | 99 (100.0%) | 89 (93.7%) |
| 12 to 14 Years | 198 (100.0%) | 44 (100.0%) |
| 15 Years | 42 (100.0%) | 51 (100.0%) |
| 16 and 17 Years | 29 (100.0%) | 117 (100.0%) |
| 18 to 24 Years | 232 (94.7%) | 63 (100.0%) |
| 25 to 34 Years | 93 (100.0%) | 170 (100.0%) |
| 35 to 44 Years | 106 (100.0%) | 197 (92.5%) |
| 45 to 54 Years | 309 (100.0%) | 264 (96.7%) |
| 55 to 64 Years | 290 (100.0%) | 203 (100.0%) |
| 65 to 74 Years | 29 (100.0%) | 33 (100.0%) |
| 75 Years and over | 18 (100.0%) | 21 (100.0%) |
| Total | 1,494 (99.1%) | 1,289 (94.9%) |
Income Below Poverty Among Married-Couple Families in Greenwich
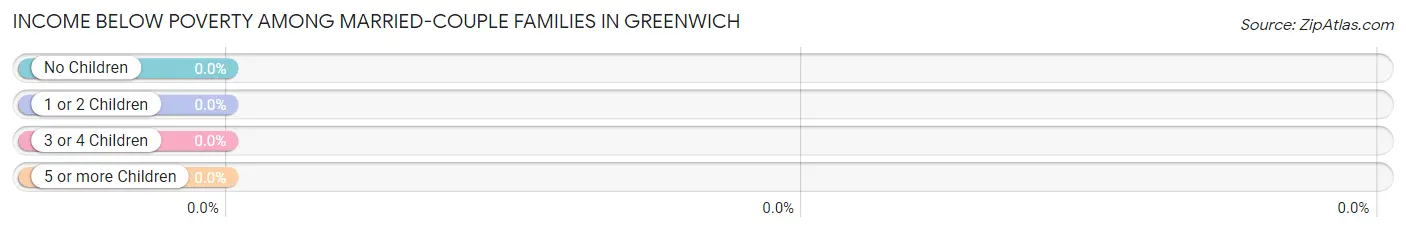
| Children | Above Poverty | Below Poverty |
| No Children | 177 (100.0%) | 0 (0.0%) |
| 1 or 2 Children | 444 (100.0%) | 0 (0.0%) |
| 3 or 4 Children | 24 (100.0%) | 0 (0.0%) |
| 5 or more Children | 0 (0.0%) | 0 (0.0%) |
| Total | 645 (100.0%) | 0 (0.0%) |
Income Below Poverty Among Single-Parent Households in Greenwich
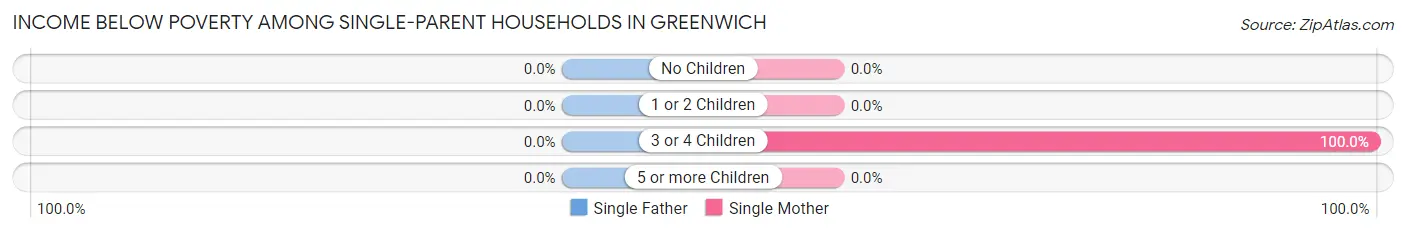
| Children | Single Father | Single Mother |
| No Children | 0 (0.0%) | 0 (0.0%) |
| 1 or 2 Children | 0 (0.0%) | 0 (0.0%) |
| 3 or 4 Children | 0 (0.0%) | 16 (100.0%) |
| 5 or more Children | 0 (0.0%) | 0 (0.0%) |
| Total | 0 (0.0%) | 16 (17.2%) |
Income Below Poverty Among Married-Couple vs Single-Parent Households in Greenwich
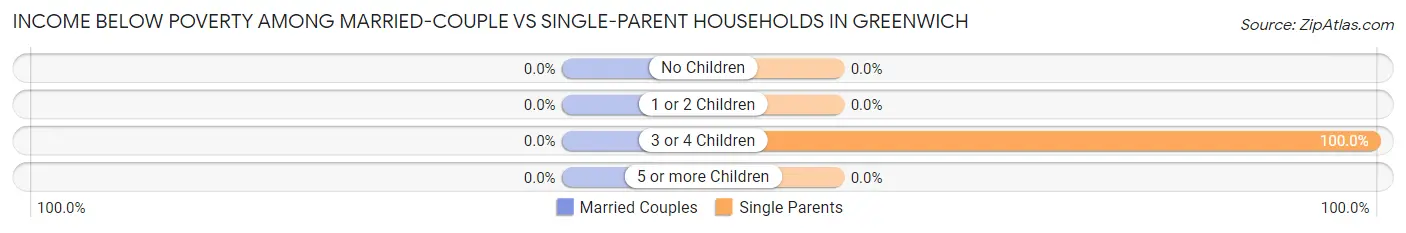
| Children | Married-Couple Families | Single-Parent Households |
| No Children | 0 (0.0%) | 0 (0.0%) |
| 1 or 2 Children | 0 (0.0%) | 0 (0.0%) |
| 3 or 4 Children | 0 (0.0%) | 16 (100.0%) |
| 5 or more Children | 0 (0.0%) | 0 (0.0%) |
| Total | 0 (0.0%) | 16 (14.9%) |
Race in Greenwich
The most populous races in Greenwich are White / Caucasian (1,585 | 55.3%), Asian (566 | 19.8%), and Black / African American (354 | 12.3%).
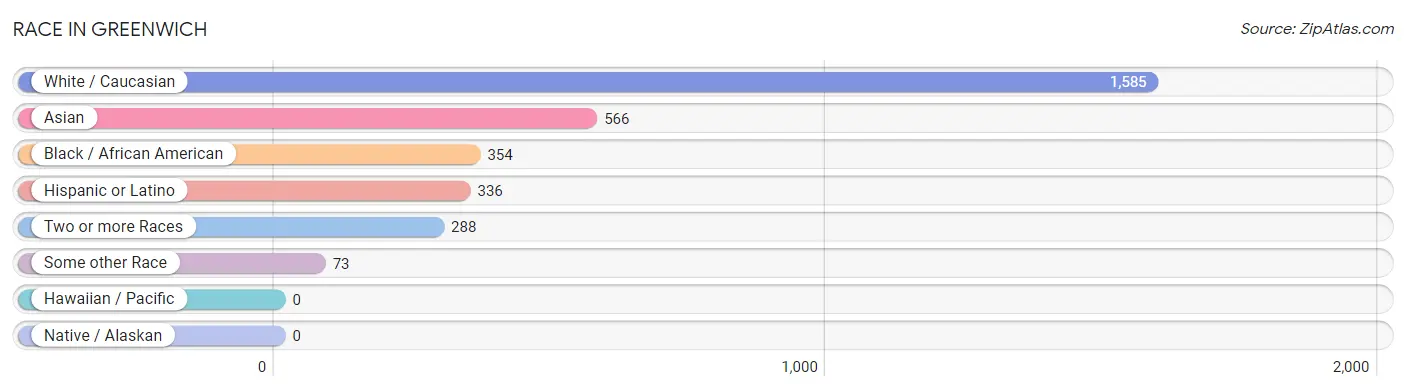
| Race | # Population | % Population |
| Asian | 566 | 19.8% |
| Black / African American | 354 | 12.3% |
| Hawaiian / Pacific | 0 | 0.0% |
| Hispanic or Latino | 336 | 11.7% |
| Native / Alaskan | 0 | 0.0% |
| White / Caucasian | 1,585 | 55.3% |
| Two or more Races | 288 | 10.1% |
| Some other Race | 73 | 2.5% |
| Total | 2,866 | 100.0% |
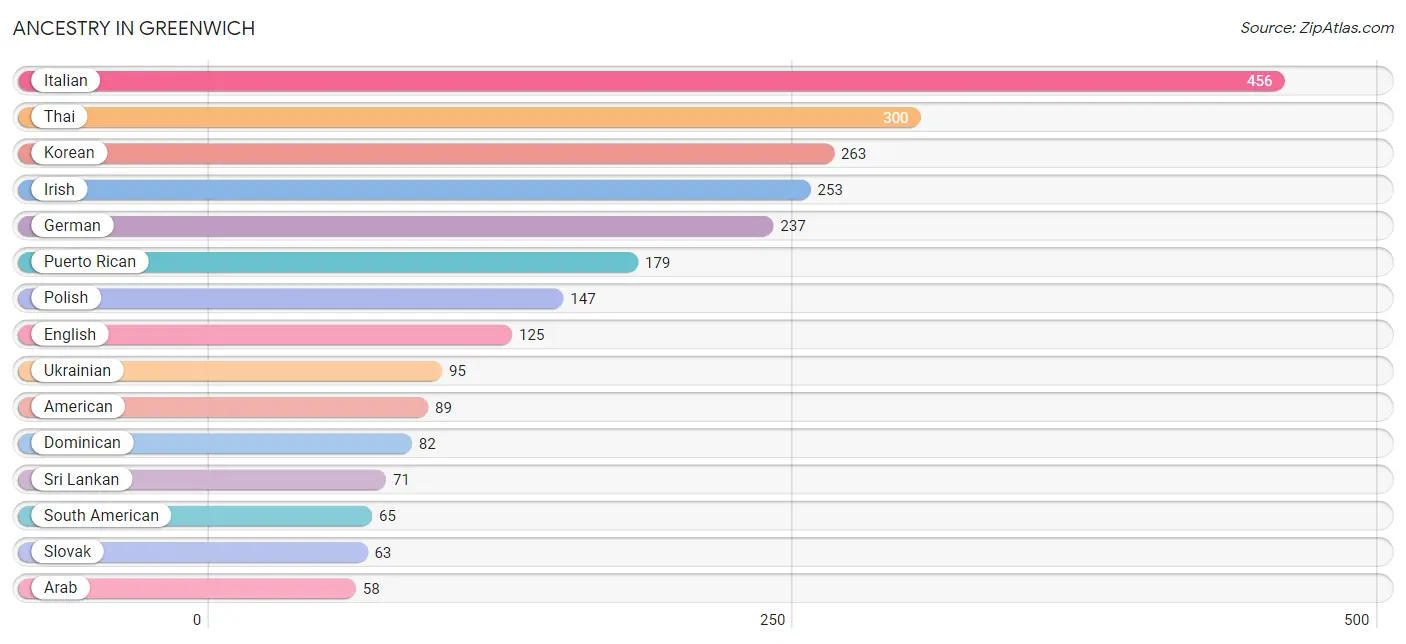
Ancestry in Greenwich
The most populous ancestries reported in Greenwich are Italian (456 | 15.9%), Thai (300 | 10.5%), Korean (263 | 9.2%), Irish (253 | 8.8%), and German (237 | 8.3%), together accounting for 52.7% of all Greenwich residents.
| Ancestry | # Population | % Population |
| Afghan | 42 | 1.5% |
| American | 89 | 3.1% |
| Arab | 58 | 2.0% |
| Central American | 10 | 0.4% |
| Colombian | 16 | 0.6% |
| Costa Rican | 10 | 0.4% |
| Czech | 43 | 1.5% |
| Dominican | 82 | 2.9% |
| Dutch | 16 | 0.6% |
| Eastern European | 9 | 0.3% |
| Egyptian | 44 | 1.5% |
| English | 125 | 4.4% |
| French Canadian | 40 | 1.4% |
| German | 237 | 8.3% |
| Greek | 50 | 1.7% |
| Hungarian | 50 | 1.7% |
| Indian (Asian) | 50 | 1.7% |
| Irish | 253 | 8.8% |
| Italian | 456 | 15.9% |
| Jamaican | 14 | 0.5% |
| Korean | 263 | 9.2% |
| Lebanese | 14 | 0.5% |
| Lumbee | 6 | 0.2% |
| Peruvian | 22 | 0.8% |
| Polish | 147 | 5.1% |
| Puerto Rican | 179 | 6.2% |
| Romanian | 35 | 1.2% |
| Russian | 44 | 1.5% |
| Scottish | 11 | 0.4% |
| Slovak | 63 | 2.2% |
| South American | 65 | 2.3% |
| Sri Lankan | 71 | 2.5% |
| Swedish | 54 | 1.9% |
| Swiss | 9 | 0.3% |
| Thai | 300 | 10.5% |
| Ukrainian | 95 | 3.3% |
| Uruguayan | 27 | 0.9% |
| Welsh | 21 | 0.7% | View All 38 Rows |
Immigrants in Greenwich
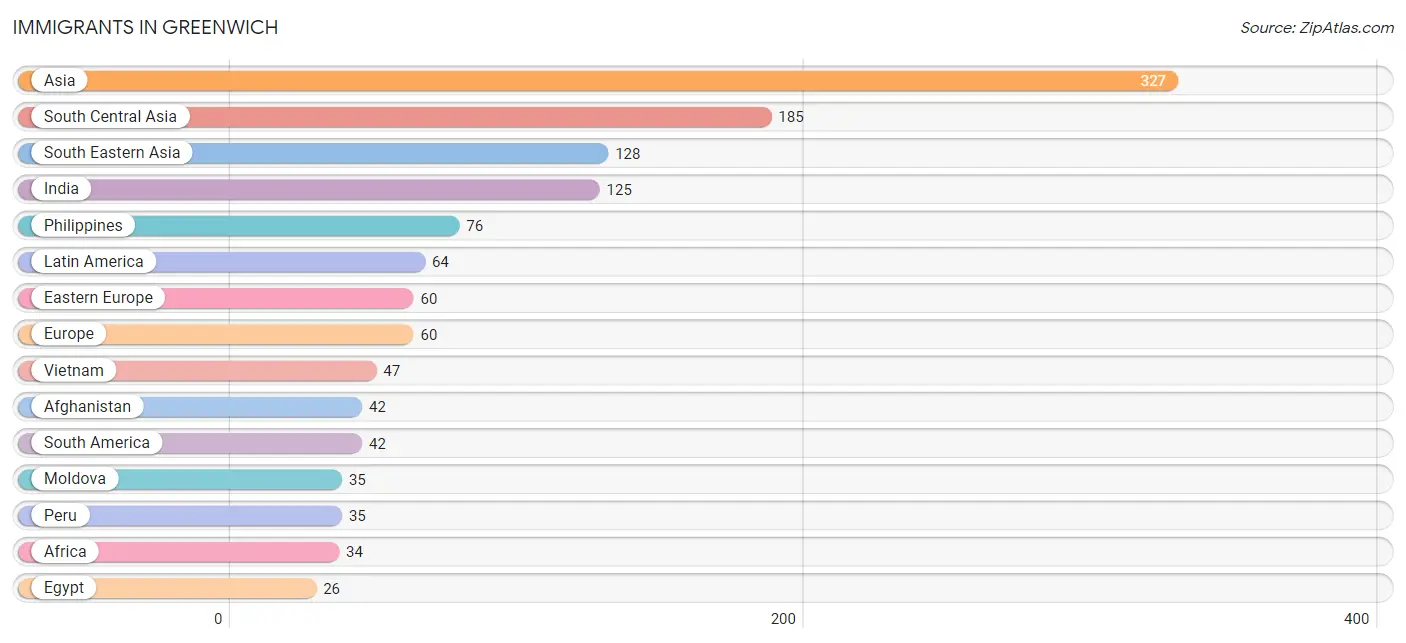
The most numerous immigrant groups reported in Greenwich came from Asia (327 | 11.4%), South Central Asia (185 | 6.5%), South Eastern Asia (128 | 4.5%), India (125 | 4.4%), and Philippines (76 | 2.6%), together accounting for 29.3% of all Greenwich residents.
| Immigration Origin | # Population | % Population |
| Afghanistan | 42 | 1.5% |
| Africa | 34 | 1.2% |
| Asia | 327 | 11.4% |
| Caribbean | 22 | 0.8% |
| China | 14 | 0.5% |
| Colombia | 7 | 0.2% |
| Dominican Republic | 8 | 0.3% |
| Eastern Asia | 14 | 0.5% |
| Eastern Europe | 60 | 2.1% |
| Egypt | 26 | 0.9% |
| Europe | 60 | 2.1% |
| India | 125 | 4.4% |
| Jamaica | 14 | 0.5% |
| Latin America | 64 | 2.2% |
| Moldova | 35 | 1.2% |
| Northern Africa | 26 | 0.9% |
| Pakistan | 18 | 0.6% |
| Peru | 35 | 1.2% |
| Philippines | 76 | 2.6% |
| Singapore | 5 | 0.2% |
| South Africa | 8 | 0.3% |
| South America | 42 | 1.5% |
| South Central Asia | 185 | 6.5% |
| South Eastern Asia | 128 | 4.5% |
| Ukraine | 25 | 0.9% |
| Vietnam | 47 | 1.6% | View All 26 Rows |
Sex and Age in Greenwich
Sex and Age in Greenwich
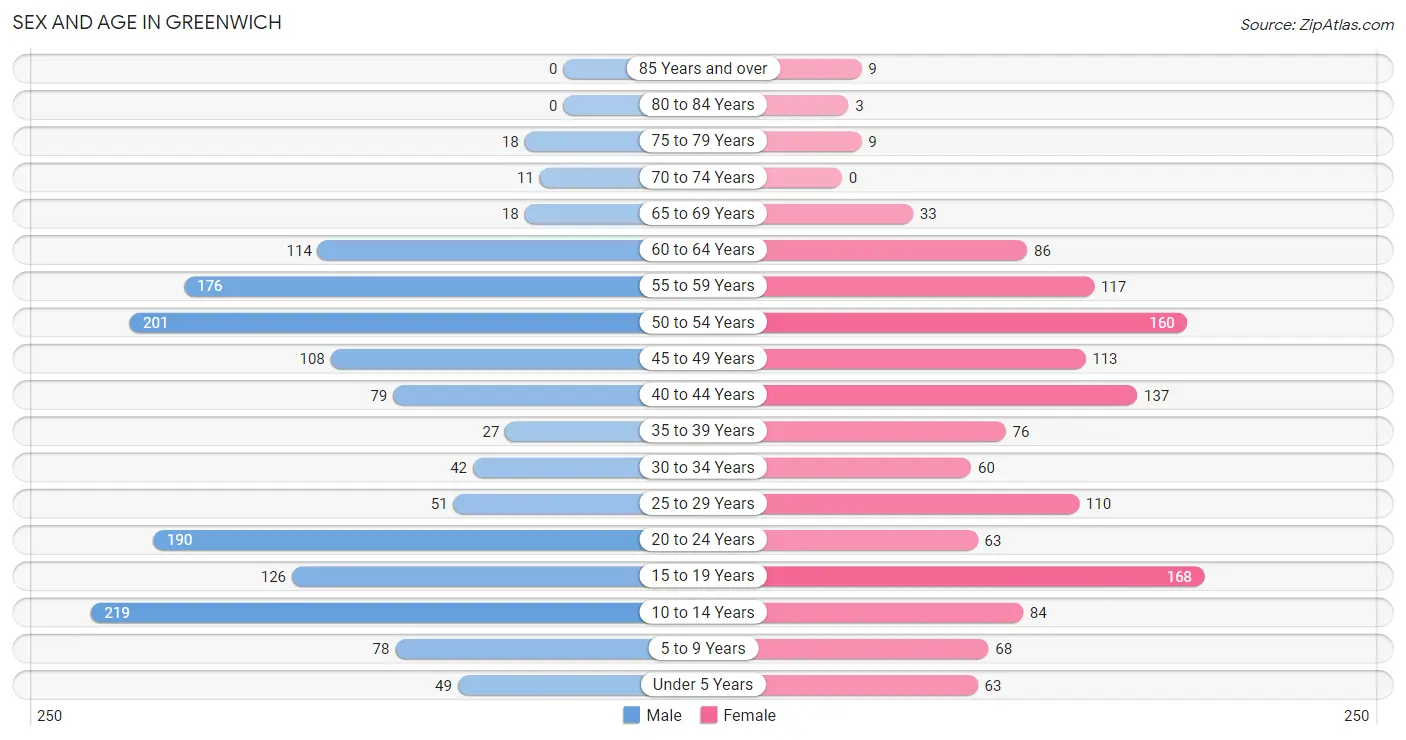
The most populous age groups in Greenwich are 10 to 14 Years (219 | 14.5%) for men and 15 to 19 Years (168 | 12.4%) for women.
| Age Bracket | Male | Female |
| Under 5 Years | 49 (3.3%) | 63 (4.6%) |
| 5 to 9 Years | 78 (5.2%) | 68 (5.0%) |
| 10 to 14 Years | 219 (14.5%) | 84 (6.2%) |
| 15 to 19 Years | 126 (8.4%) | 168 (12.4%) |
| 20 to 24 Years | 190 (12.6%) | 63 (4.6%) |
| 25 to 29 Years | 51 (3.4%) | 110 (8.1%) |
| 30 to 34 Years | 42 (2.8%) | 60 (4.4%) |
| 35 to 39 Years | 27 (1.8%) | 76 (5.6%) |
| 40 to 44 Years | 79 (5.2%) | 137 (10.1%) |
| 45 to 49 Years | 108 (7.2%) | 113 (8.3%) |
| 50 to 54 Years | 201 (13.3%) | 160 (11.8%) |
| 55 to 59 Years | 176 (11.7%) | 117 (8.6%) |
| 60 to 64 Years | 114 (7.6%) | 86 (6.3%) |
| 65 to 69 Years | 18 (1.2%) | 33 (2.4%) |
| 70 to 74 Years | 11 (0.7%) | 0 (0.0%) |
| 75 to 79 Years | 18 (1.2%) | 9 (0.7%) |
| 80 to 84 Years | 0 (0.0%) | 3 (0.2%) |
| 85 Years and over | 0 (0.0%) | 9 (0.7%) |
| Total | 1,507 (100.0%) | 1,359 (100.0%) |
Families and Households in Greenwich
Median Family Size in Greenwich
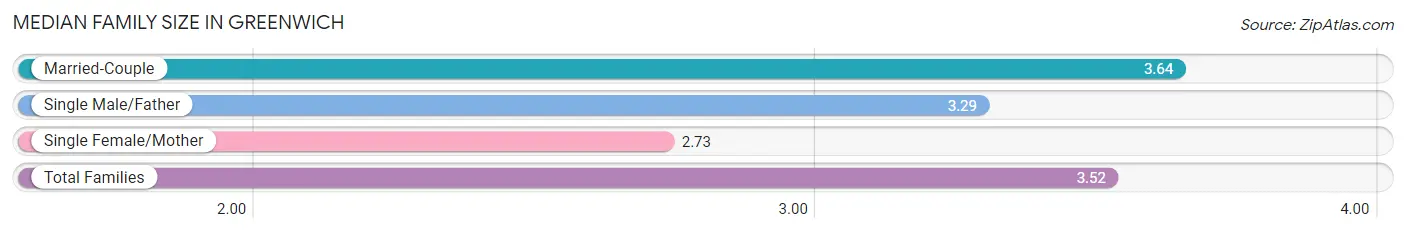
The median family size in Greenwich is 3.52 persons per family, with married-couple families (645 | 85.8%) accounting for the largest median family size of 3.64 persons per family. On the other hand, single female/mother families (93 | 12.4%) represent the smallest median family size with 2.73 persons per family.
| Family Type | # Families | Family Size |
| Married-Couple | 645 (85.8%) | 3.64 |
| Single Male/Father | 14 (1.9%) | 3.29 |
| Single Female/Mother | 93 (12.4%) | 2.73 |
| Total Families | 752 (100.0%) | 3.52 |
Median Household Size in Greenwich
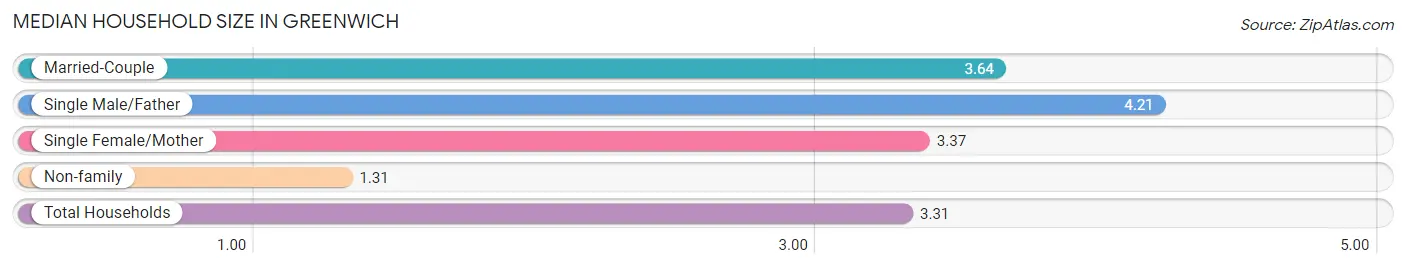
The median household size in Greenwich is 3.31 persons per household, with single male/father households (14 | 1.6%) accounting for the largest median household size of 4.21 persons per household. non-family households (114 | 13.2%) represent the smallest median household size with 1.31 persons per household.
| Household Type | # Households | Household Size |
| Married-Couple | 645 (74.5%) | 3.64 |
| Single Male/Father | 14 (1.6%) | 4.21 |
| Single Female/Mother | 93 (10.7%) | 3.37 |
| Non-family | 114 (13.2%) | 1.31 |
| Total Households | 866 (100.0%) | 3.31 |
Household Size by Marriage Status in Greenwich
Out of a total of 866 households in Greenwich, 752 (86.8%) are family households, while 114 (13.2%) are nonfamily households. The most numerous type of family households are 4-person households, comprising 257, and the most common type of nonfamily households are 1-person households, comprising 81.
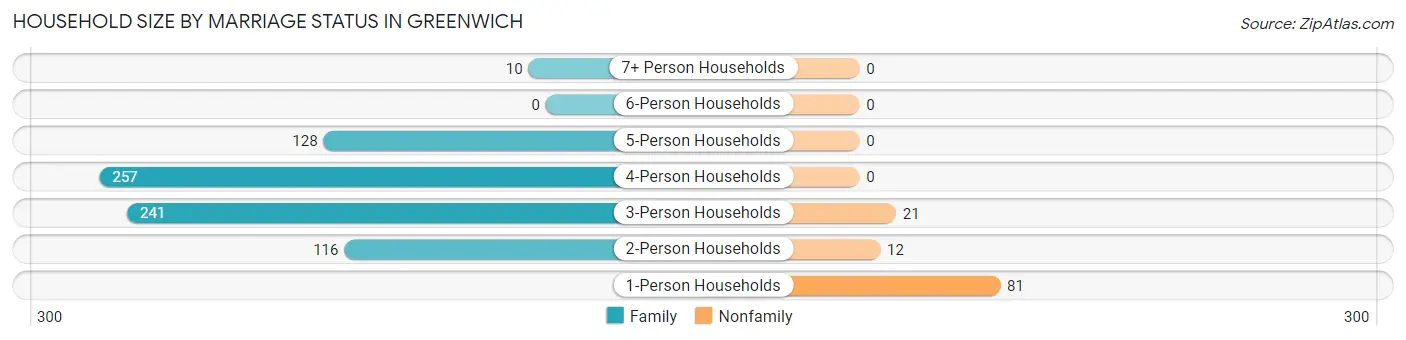
| Household Size | Family Households | Nonfamily Households |
| 1-Person Households | - | 81 (9.3%) |
| 2-Person Households | 116 (13.4%) | 12 (1.4%) |
| 3-Person Households | 241 (27.8%) | 21 (2.4%) |
| 4-Person Households | 257 (29.7%) | 0 (0.0%) |
| 5-Person Households | 128 (14.8%) | 0 (0.0%) |
| 6-Person Households | 0 (0.0%) | 0 (0.0%) |
| 7+ Person Households | 10 (1.1%) | 0 (0.0%) |
| Total | 752 (86.8%) | 114 (13.2%) |
Female Fertility in Greenwich
Fertility by Age in Greenwich
Average fertility rate in Greenwich is 33.0 births per 1,000 women. Women in the age bracket of 35 to 50 years have the highest fertility rate with 74.0 births per 1,000 women. Women in the age bracket of 35 to 50 years acount for 100.0% of all women with births.
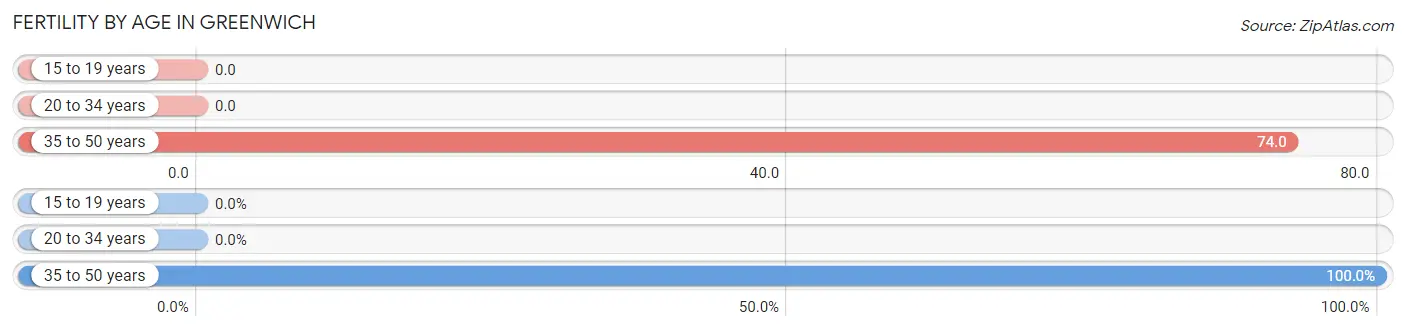
| Age Bracket | Women with Births | Births / 1,000 Women |
| 15 to 19 years | 0 (0.0%) | 0.0 |
| 20 to 34 years | 0 (0.0%) | 0.0 |
| 35 to 50 years | 24 (100.0%) | 74.0 |
| Total | 24 (100.0%) | 33.0 |
Fertility by Age by Marriage Status in Greenwich
83.3% of women with births (24) in Greenwich are married. The highest percentage of unmarried women with births falls into 35 to 50 years age bracket with 16.7% of them unmarried at the time of birth, while the lowest percentage of unmarried women with births belong to 35 to 50 years age bracket with 16.7% of them unmarried.
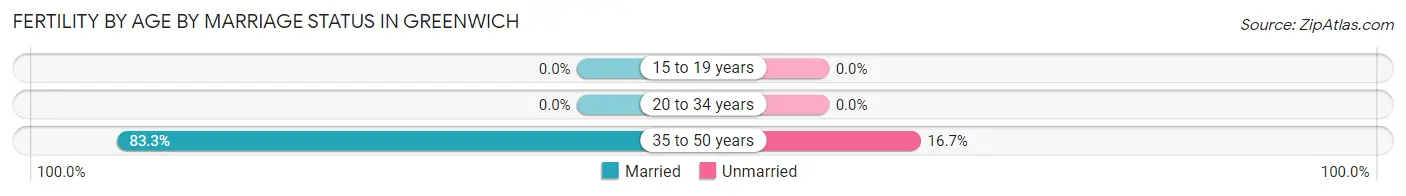
| Age Bracket | Married | Unmarried |
| 15 to 19 years | 0 (0.0%) | 0 (0.0%) |
| 20 to 34 years | 0 (0.0%) | 0 (0.0%) |
| 35 to 50 years | 20 (83.3%) | 4 (16.7%) |
| Total | 20 (83.3%) | 4 (16.7%) |
Fertility by Education in Greenwich
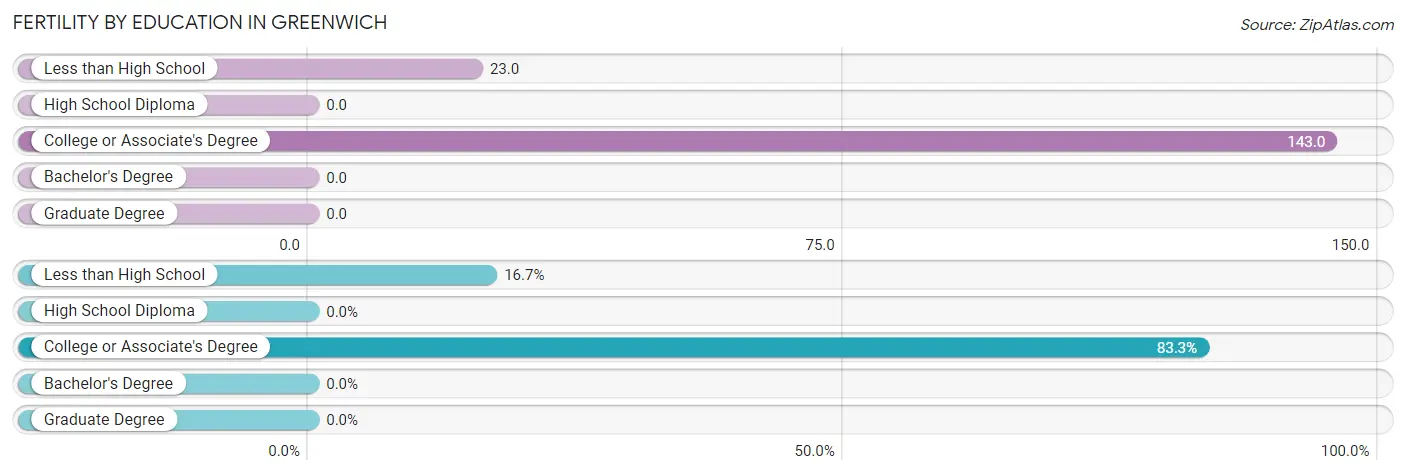
| Educational Attainment | Women with Births | Births / 1,000 Women |
| Less than High School | 4 (16.7%) | 23.0 |
| High School Diploma | 0 (0.0%) | 0.0 |
| College or Associate's Degree | 20 (83.3%) | 143.0 |
| Bachelor's Degree | 0 (0.0%) | 0.0 |
| Graduate Degree | 0 (0.0%) | 0.0 |
| Total | 24 (100.0%) | 33.0 |
Fertility by Education by Marriage Status in Greenwich
16.7% of women with births in Greenwich are unmarried. Women with the educational attainment of college or associate's degree are most likely to be married with 100.0% of them married at childbirth, while women with the educational attainment of less than high school are least likely to be married with 100.0% of them unmarried at childbirth.
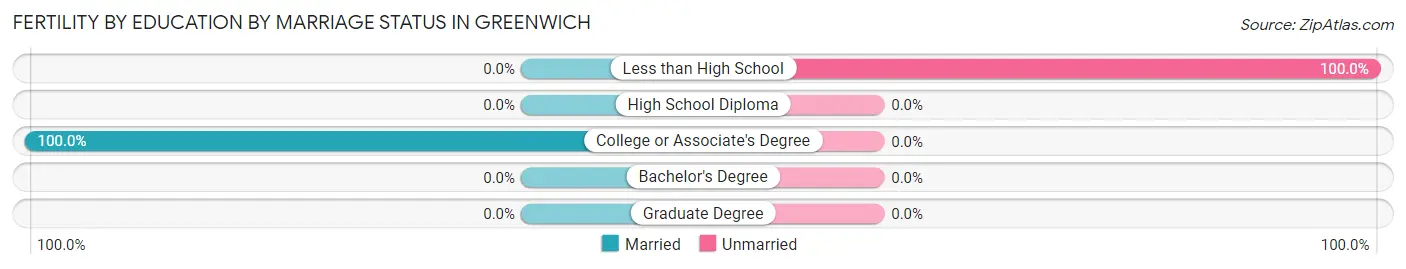
| Educational Attainment | Married | Unmarried |
| Less than High School | 0 (0.0%) | 4 (100.0%) |
| High School Diploma | 0 (0.0%) | 0 (0.0%) |
| College or Associate's Degree | 20 (100.0%) | 0 (0.0%) |
| Bachelor's Degree | 0 (0.0%) | 0 (0.0%) |
| Graduate Degree | 0 (0.0%) | 0 (0.0%) |
| Total | 20 (83.3%) | 4 (16.7%) |
Employment Characteristics in Greenwich
Employment by Class of Employer in Greenwich
Among the 1,552 employed individuals in Greenwich, private company employees (981 | 63.2%), local government employees (235 | 15.1%), and self-employed (incorporated) (113 | 7.3%) make up the most common classes of employment.
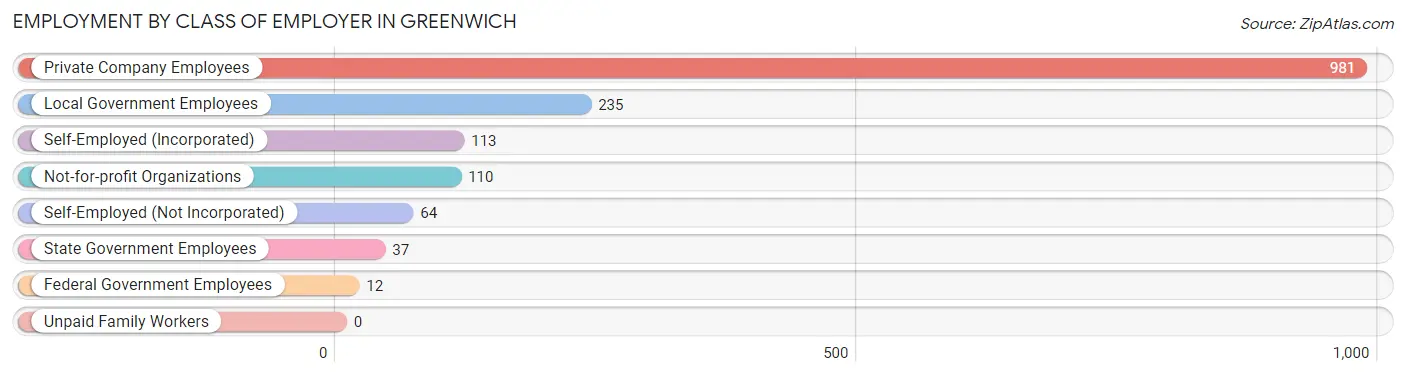
| Employer Class | # Employees | % Employees |
| Private Company Employees | 981 | 63.2% |
| Self-Employed (Incorporated) | 113 | 7.3% |
| Self-Employed (Not Incorporated) | 64 | 4.1% |
| Not-for-profit Organizations | 110 | 7.1% |
| Local Government Employees | 235 | 15.1% |
| State Government Employees | 37 | 2.4% |
| Federal Government Employees | 12 | 0.8% |
| Unpaid Family Workers | 0 | 0.0% |
| Total | 1,552 | 100.0% |
Employment Status by Age in Greenwich
According to the labor force statistics for Greenwich, out of the total population over 16 years of age (2,212), 76.7% or 1,697 individuals are in the labor force, with 7.2% or 122 of them unemployed. The age group with the highest labor force participation rate is 30 to 34 years, with 100.0% or 102 individuals in the labor force. Within the labor force, the 16 to 19 years age range has the highest percentage of unemployed individuals, with 47.7% or 51 of them being unemployed.
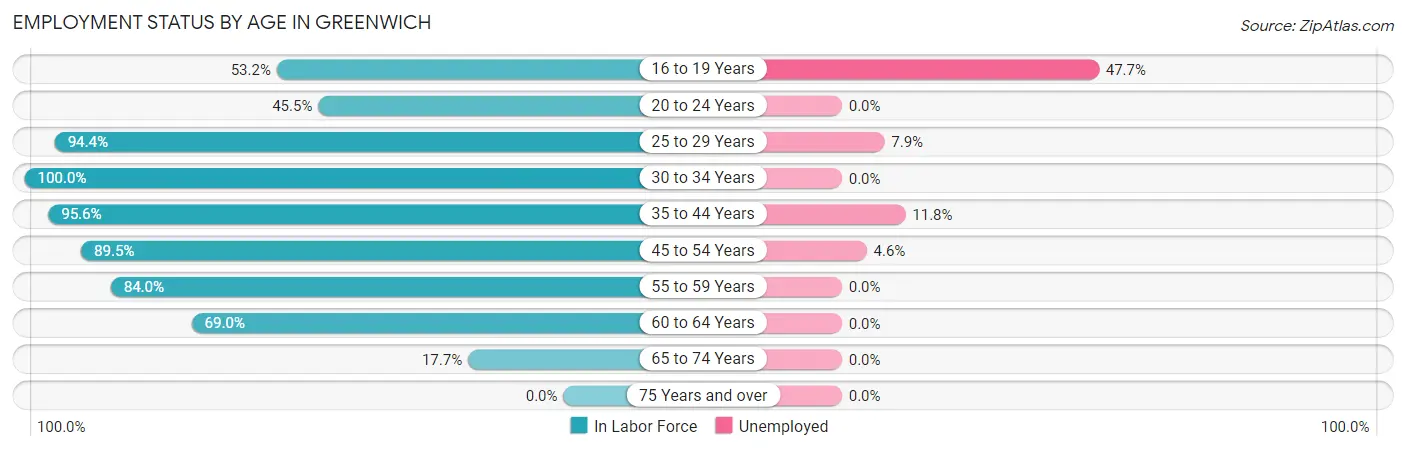
| Age Bracket | In Labor Force | Unemployed |
| 16 to 19 Years | 107 (53.2%) | 51 (47.7%) |
| 20 to 24 Years | 115 (45.5%) | 0 (0.0%) |
| 25 to 29 Years | 152 (94.4%) | 12 (7.9%) |
| 30 to 34 Years | 102 (100.0%) | 0 (0.0%) |
| 35 to 44 Years | 305 (95.6%) | 36 (11.8%) |
| 45 to 54 Years | 521 (89.5%) | 24 (4.6%) |
| 55 to 59 Years | 246 (84.0%) | 0 (0.0%) |
| 60 to 64 Years | 138 (69.0%) | 0 (0.0%) |
| 65 to 74 Years | 11 (17.7%) | 0 (0.0%) |
| 75 Years and over | 0 (0.0%) | 0 (0.0%) |
| Total | 1,697 (76.7%) | 122 (7.2%) |
Employment Status by Educational Attainment in Greenwich
According to labor force statistics for Greenwich, 88.4% of individuals (1,465) out of the total population between 25 and 64 years of age (1,657) are in the labor force, with 4.9% or 72 of them being unemployed. The group with the highest labor force participation rate are those with the educational attainment of less than high school, with 100.0% or 28 individuals in the labor force. Within the labor force, individuals with college / associate degree education have the highest percentage of unemployment, with 11.3% or 43 of them being unemployed.
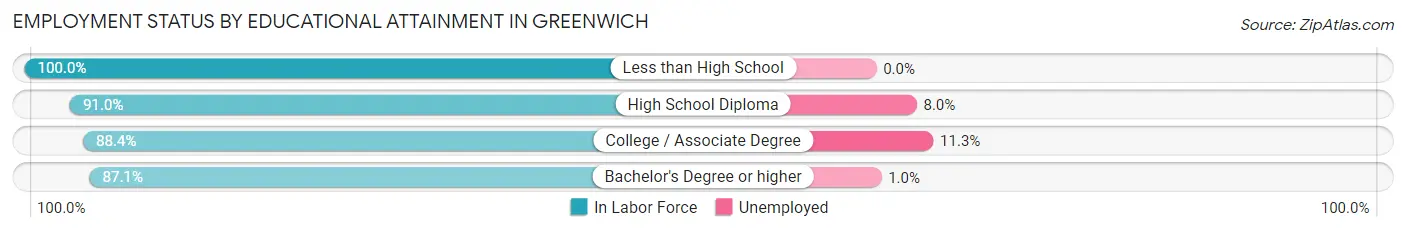
| Educational Attainment | In Labor Force | Unemployed |
| Less than High School | 28 (100.0%) | 0 (0.0%) |
| High School Diploma | 264 (91.0%) | 23 (8.0%) |
| College / Associate Degree | 380 (88.4%) | 49 (11.3%) |
| Bachelor's Degree or higher | 792 (87.1%) | 9 (1.0%) |
| Total | 1,465 (88.4%) | 81 (4.9%) |
Employment Occupations by Sex in Greenwich
Management, Business, Science and Arts Occupations
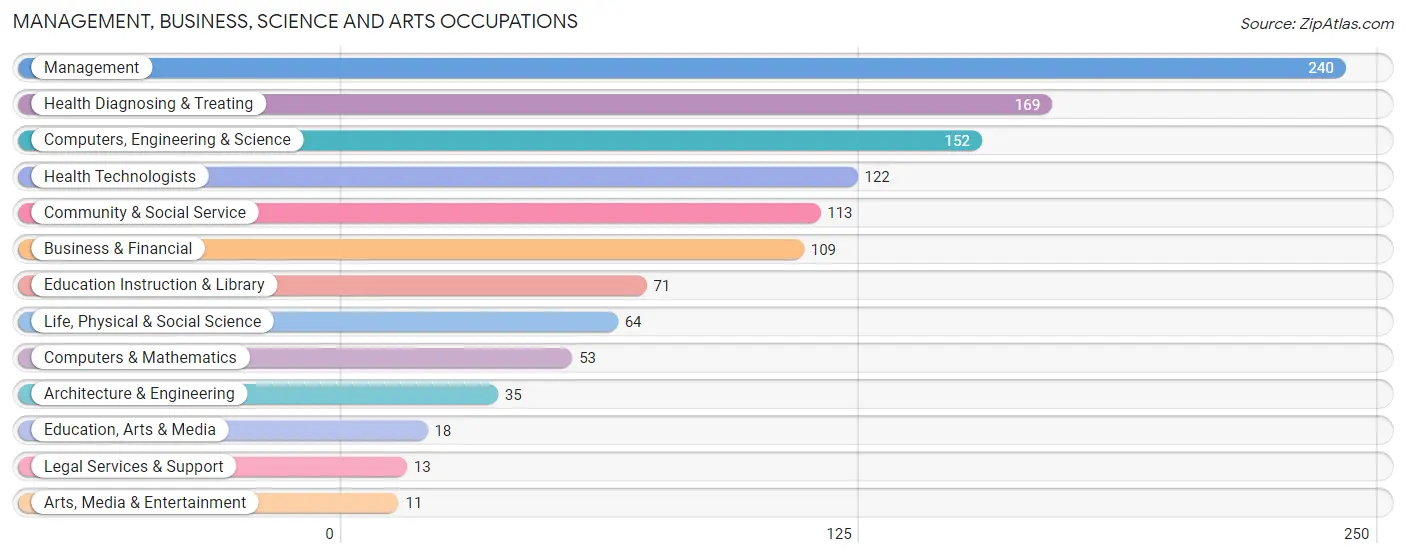
The most common Management, Business, Science and Arts occupations in Greenwich are Management (240 | 15.2%), Health Diagnosing & Treating (169 | 10.7%), Computers, Engineering & Science (152 | 9.7%), Health Technologists (122 | 7.7%), and Community & Social Service (113 | 7.2%).
Management, Business, Science and Arts Occupations by Sex
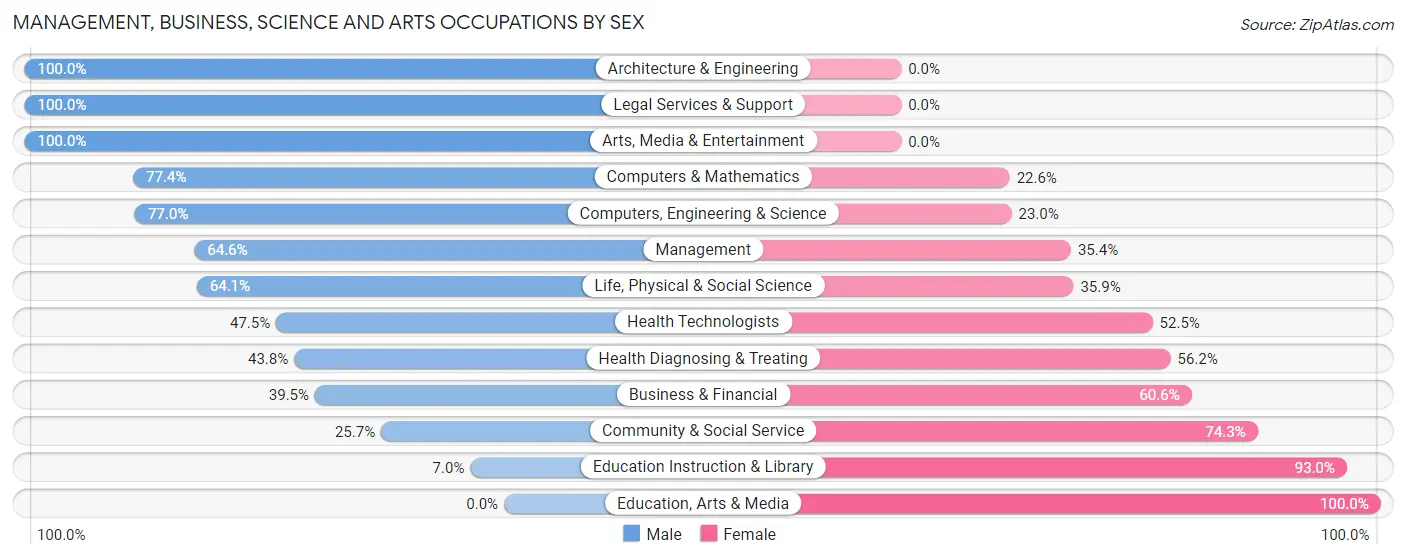
Within the Management, Business, Science and Arts occupations in Greenwich, the most male-oriented occupations are Architecture & Engineering (100.0%), Legal Services & Support (100.0%), and Arts, Media & Entertainment (100.0%), while the most female-oriented occupations are Education, Arts & Media (100.0%), Education Instruction & Library (93.0%), and Community & Social Service (74.3%).
| Occupation | Male | Female |
| Management | 155 (64.6%) | 85 (35.4%) |
| Business & Financial | 43 (39.5%) | 66 (60.6%) |
| Computers, Engineering & Science | 117 (77.0%) | 35 (23.0%) |
| Computers & Mathematics | 41 (77.4%) | 12 (22.6%) |
| Architecture & Engineering | 35 (100.0%) | 0 (0.0%) |
| Life, Physical & Social Science | 41 (64.1%) | 23 (35.9%) |
| Community & Social Service | 29 (25.7%) | 84 (74.3%) |
| Education, Arts & Media | 0 (0.0%) | 18 (100.0%) |
| Legal Services & Support | 13 (100.0%) | 0 (0.0%) |
| Education Instruction & Library | 5 (7.0%) | 66 (93.0%) |
| Arts, Media & Entertainment | 11 (100.0%) | 0 (0.0%) |
| Health Diagnosing & Treating | 74 (43.8%) | 95 (56.2%) |
| Health Technologists | 58 (47.5%) | 64 (52.5%) |
| Total (Category) | 418 (53.4%) | 365 (46.6%) |
| Total (Overall) | 844 (53.6%) | 730 (46.4%) |
Services Occupations
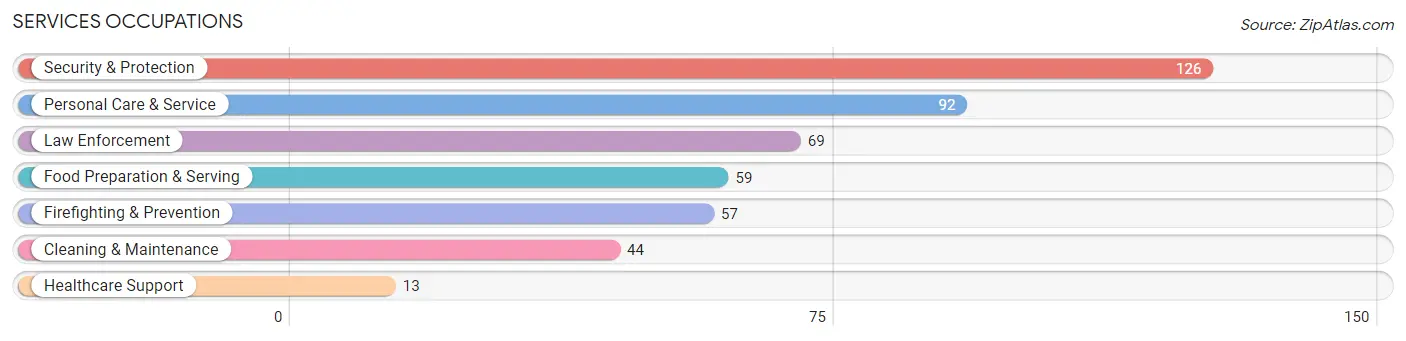
The most common Services occupations in Greenwich are Security & Protection (126 | 8.0%), Personal Care & Service (92 | 5.8%), Law Enforcement (69 | 4.4%), Food Preparation & Serving (59 | 3.7%), and Firefighting & Prevention (57 | 3.6%).
Services Occupations by Sex
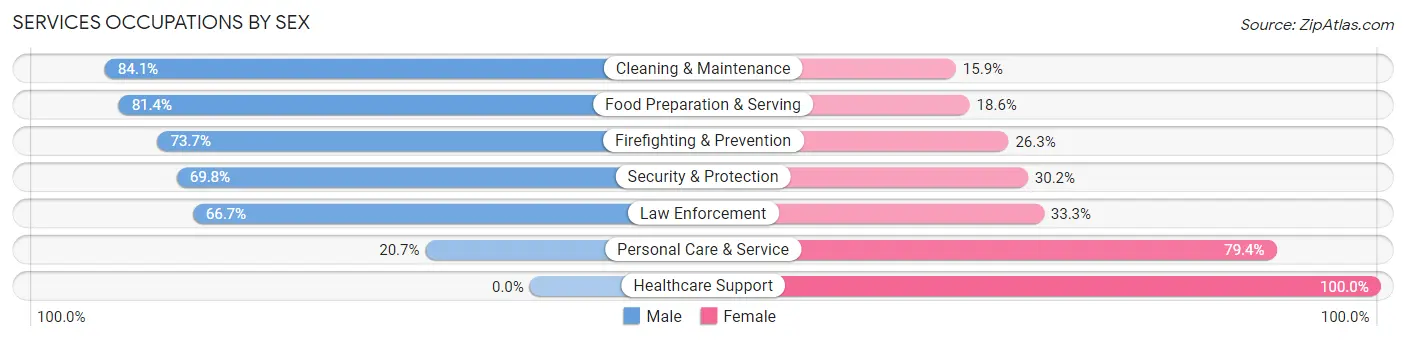
Within the Services occupations in Greenwich, the most male-oriented occupations are Cleaning & Maintenance (84.1%), Food Preparation & Serving (81.4%), and Firefighting & Prevention (73.7%), while the most female-oriented occupations are Healthcare Support (100.0%), Personal Care & Service (79.3%), and Law Enforcement (33.3%).
| Occupation | Male | Female |
| Healthcare Support | 0 (0.0%) | 13 (100.0%) |
| Security & Protection | 88 (69.8%) | 38 (30.2%) |
| Firefighting & Prevention | 42 (73.7%) | 15 (26.3%) |
| Law Enforcement | 46 (66.7%) | 23 (33.3%) |
| Food Preparation & Serving | 48 (81.4%) | 11 (18.6%) |
| Cleaning & Maintenance | 37 (84.1%) | 7 (15.9%) |
| Personal Care & Service | 19 (20.6%) | 73 (79.3%) |
| Total (Category) | 192 (57.5%) | 142 (42.5%) |
| Total (Overall) | 844 (53.6%) | 730 (46.4%) |
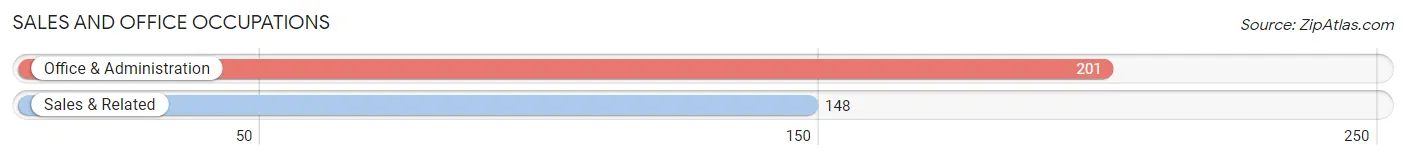
Sales and Office Occupations
The most common Sales and Office occupations in Greenwich are Office & Administration (201 | 12.8%), and Sales & Related (148 | 9.4%).
Sales and Office Occupations by Sex
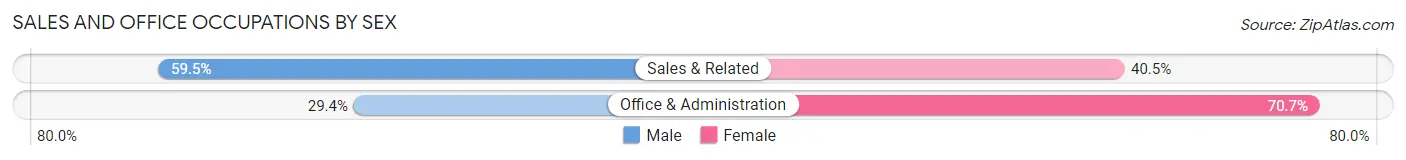
| Occupation | Male | Female |
| Sales & Related | 88 (59.5%) | 60 (40.5%) |
| Office & Administration | 59 (29.3%) | 142 (70.7%) |
| Total (Category) | 147 (42.1%) | 202 (57.9%) |
| Total (Overall) | 844 (53.6%) | 730 (46.4%) |
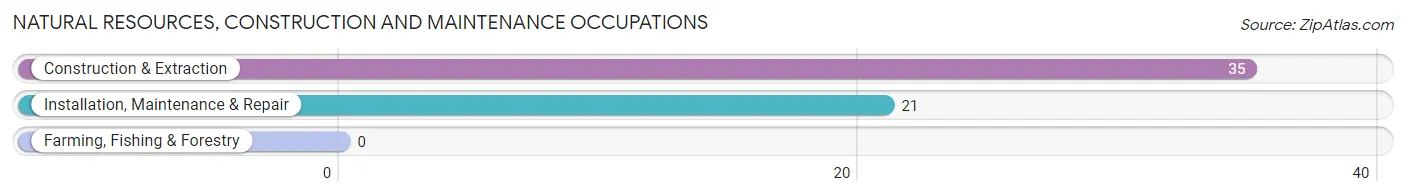
Natural Resources, Construction and Maintenance Occupations
The most common Natural Resources, Construction and Maintenance occupations in Greenwich are Construction & Extraction (35 | 2.2%), and Installation, Maintenance & Repair (21 | 1.3%).
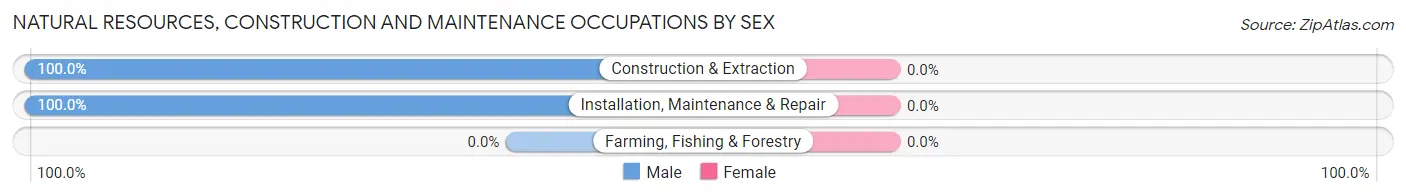
Natural Resources, Construction and Maintenance Occupations by Sex
| Occupation | Male | Female |
| Farming, Fishing & Forestry | 0 (0.0%) | 0 (0.0%) |
| Construction & Extraction | 35 (100.0%) | 0 (0.0%) |
| Installation, Maintenance & Repair | 21 (100.0%) | 0 (0.0%) |
| Total (Category) | 56 (100.0%) | 0 (0.0%) |
| Total (Overall) | 844 (53.6%) | 730 (46.4%) |
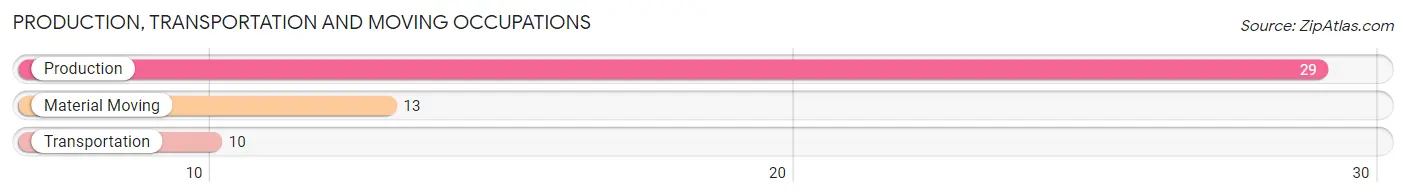
Production, Transportation and Moving Occupations
The most common Production, Transportation and Moving occupations in Greenwich are Production (29 | 1.8%), Material Moving (13 | 0.8%), and Transportation (10 | 0.6%).
Production, Transportation and Moving Occupations by Sex
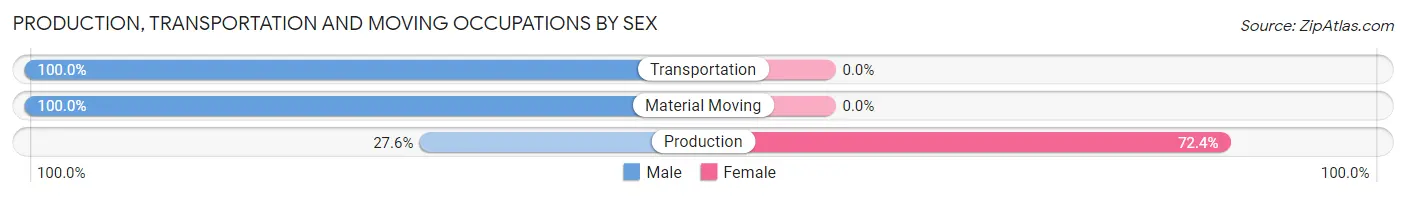
| Occupation | Male | Female |
| Production | 8 (27.6%) | 21 (72.4%) |
| Transportation | 10 (100.0%) | 0 (0.0%) |
| Material Moving | 13 (100.0%) | 0 (0.0%) |
| Total (Category) | 31 (59.6%) | 21 (40.4%) |
| Total (Overall) | 844 (53.6%) | 730 (46.4%) |
Employment Industries by Sex in Greenwich
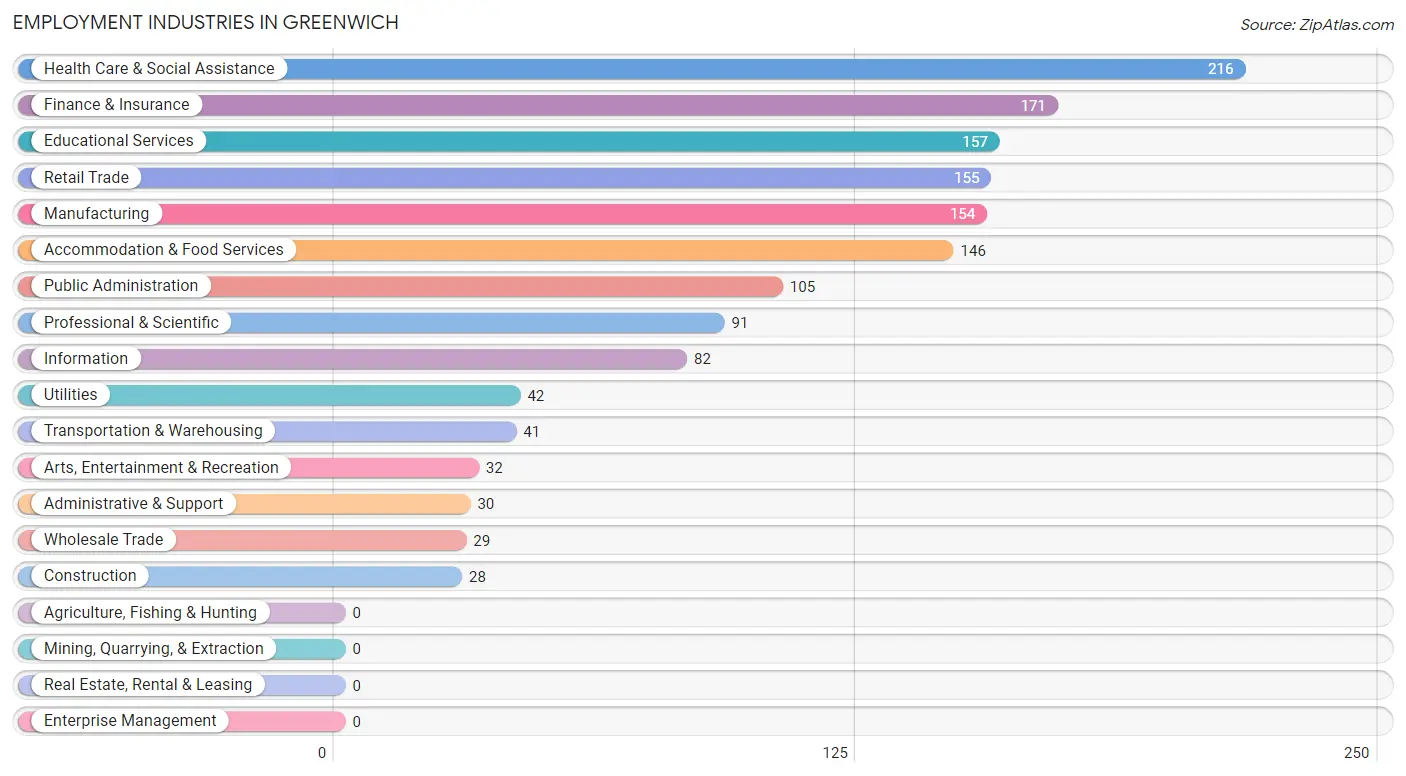
Employment Industries in Greenwich
The major employment industries in Greenwich include Health Care & Social Assistance (216 | 13.7%), Finance & Insurance (171 | 10.9%), Educational Services (157 | 10.0%), Retail Trade (155 | 9.9%), and Manufacturing (154 | 9.8%).
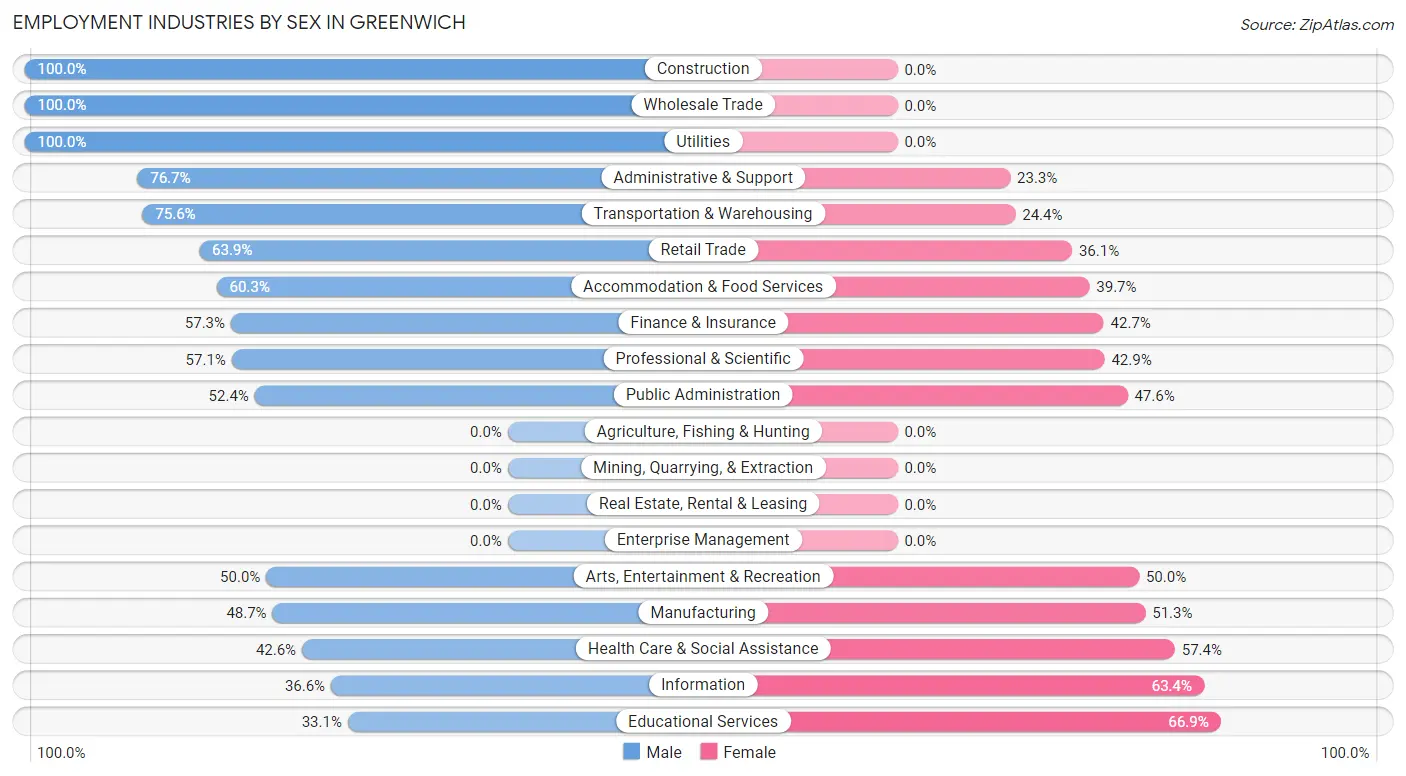
Employment Industries by Sex in Greenwich
The Greenwich industries that see more men than women are Construction (100.0%), Wholesale Trade (100.0%), and Utilities (100.0%), whereas the industries that tend to have a higher number of women are Educational Services (66.9%), Information (63.4%), and Health Care & Social Assistance (57.4%).
| Industry | Male | Female |
| Agriculture, Fishing & Hunting | 0 (0.0%) | 0 (0.0%) |
| Mining, Quarrying, & Extraction | 0 (0.0%) | 0 (0.0%) |
| Construction | 28 (100.0%) | 0 (0.0%) |
| Manufacturing | 75 (48.7%) | 79 (51.3%) |
| Wholesale Trade | 29 (100.0%) | 0 (0.0%) |
| Retail Trade | 99 (63.9%) | 56 (36.1%) |
| Transportation & Warehousing | 31 (75.6%) | 10 (24.4%) |
| Utilities | 42 (100.0%) | 0 (0.0%) |
| Information | 30 (36.6%) | 52 (63.4%) |
| Finance & Insurance | 98 (57.3%) | 73 (42.7%) |
| Real Estate, Rental & Leasing | 0 (0.0%) | 0 (0.0%) |
| Professional & Scientific | 52 (57.1%) | 39 (42.9%) |
| Enterprise Management | 0 (0.0%) | 0 (0.0%) |
| Administrative & Support | 23 (76.7%) | 7 (23.3%) |
| Educational Services | 52 (33.1%) | 105 (66.9%) |
| Health Care & Social Assistance | 92 (42.6%) | 124 (57.4%) |
| Arts, Entertainment & Recreation | 16 (50.0%) | 16 (50.0%) |
| Accommodation & Food Services | 88 (60.3%) | 58 (39.7%) |
| Public Administration | 55 (52.4%) | 50 (47.6%) |
| Total | 844 (53.6%) | 730 (46.4%) |
Education in Greenwich
School Enrollment in Greenwich
The most common levels of schooling among the 1,028 students in Greenwich are middle school (277 | 27.0%), high school (230 | 22.4%), and college / undergraduate (224 | 21.8%).
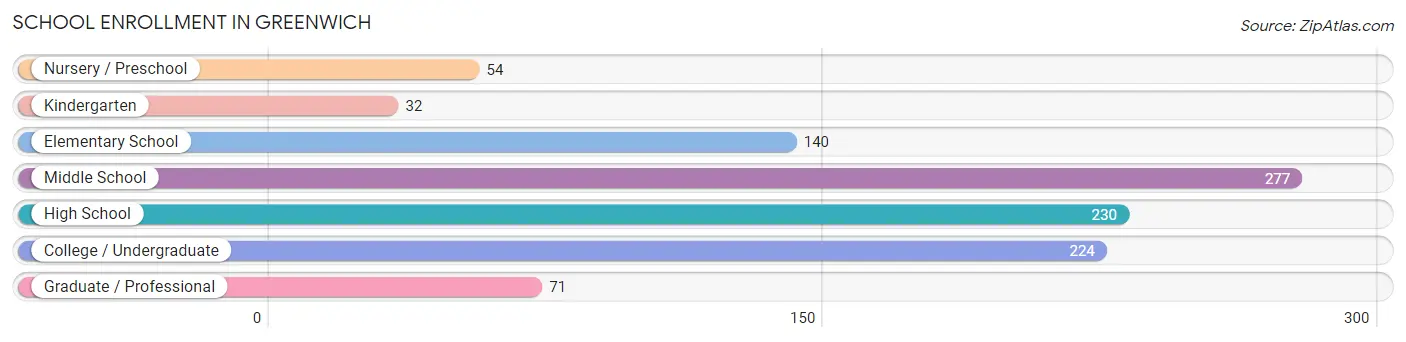
| School Level | # Students | % Students |
| Nursery / Preschool | 54 | 5.2% |
| Kindergarten | 32 | 3.1% |
| Elementary School | 140 | 13.6% |
| Middle School | 277 | 27.0% |
| High School | 230 | 22.4% |
| College / Undergraduate | 224 | 21.8% |
| Graduate / Professional | 71 | 6.9% |
| Total | 1,028 | 100.0% |
School Enrollment by Age by Funding Source in Greenwich
Out of a total of 1,028 students who are enrolled in schools in Greenwich, 41 (4.0%) attend a private institution, while the remaining 987 (96.0%) are enrolled in public schools. The age group of 3 to 4 year olds has the highest likelihood of being enrolled in private schools, with 19 (35.2% in the age bracket) enrolled. Conversely, the age group of 5 to 9 year old has the lowest likelihood of being enrolled in a private school, with 146 (100.0% in the age bracket) attending a public institution.
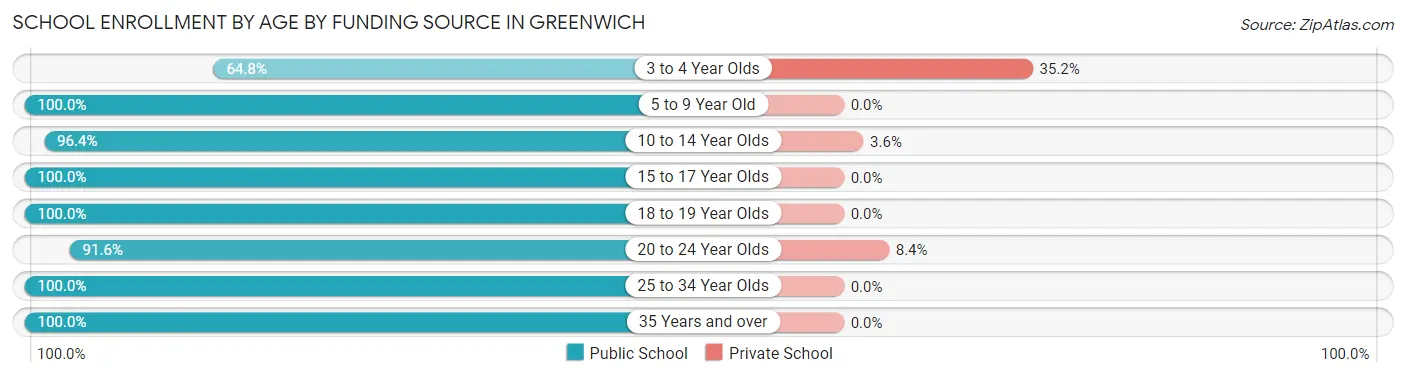
| Age Bracket | Public School | Private School |
| 3 to 4 Year Olds | 35 (64.8%) | 19 (35.2%) |
| 5 to 9 Year Old | 146 (100.0%) | 0 (0.0%) |
| 10 to 14 Year Olds | 292 (96.4%) | 11 (3.6%) |
| 15 to 17 Year Olds | 239 (100.0%) | 0 (0.0%) |
| 18 to 19 Year Olds | 55 (100.0%) | 0 (0.0%) |
| 20 to 24 Year Olds | 120 (91.6%) | 11 (8.4%) |
| 25 to 34 Year Olds | 87 (100.0%) | 0 (0.0%) |
| 35 Years and over | 13 (100.0%) | 0 (0.0%) |
| Total | 987 (96.0%) | 41 (4.0%) |
Educational Attainment by Field of Study in Greenwich
Social sciences (194 | 19.8%), bio, nature & agricultural (154 | 15.8%), computers & mathematics (107 | 10.9%), psychology (83 | 8.5%), and communications (79 | 8.1%) are the most common fields of study among 978 individuals in Greenwich who have obtained a bachelor's degree or higher.
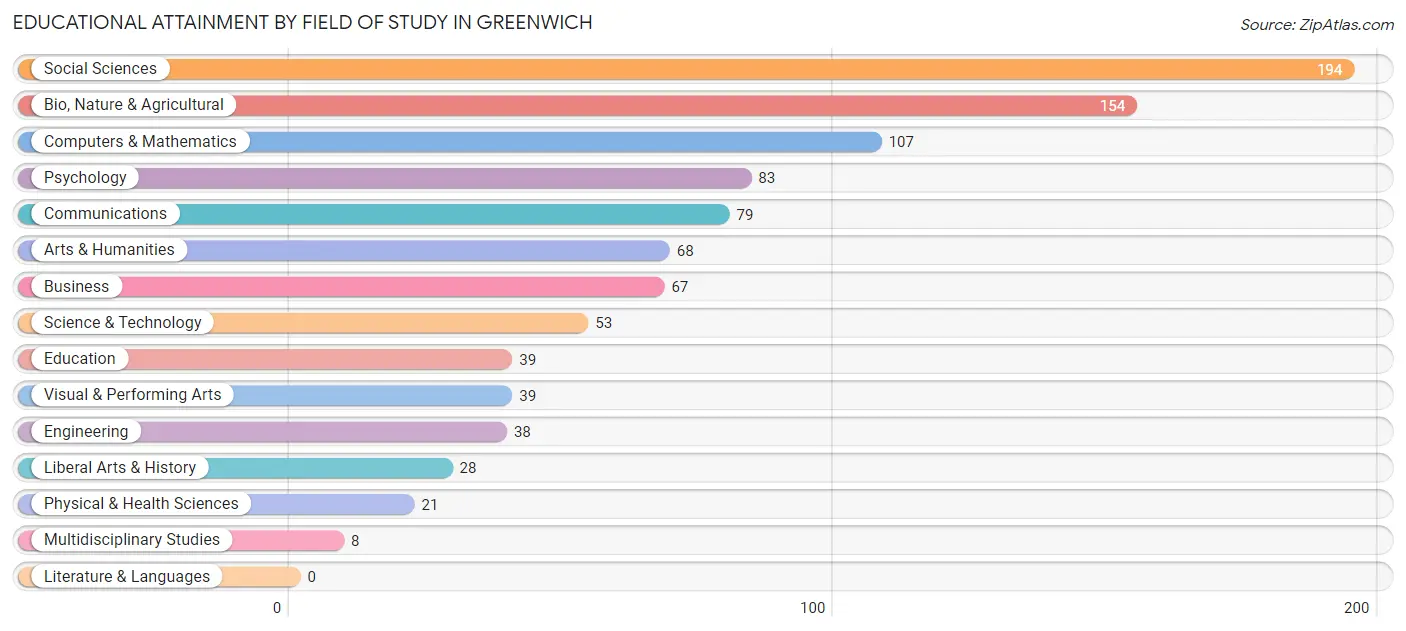
| Field of Study | # Graduates | % Graduates |
| Computers & Mathematics | 107 | 10.9% |
| Bio, Nature & Agricultural | 154 | 15.8% |
| Physical & Health Sciences | 21 | 2.1% |
| Psychology | 83 | 8.5% |
| Social Sciences | 194 | 19.8% |
| Engineering | 38 | 3.9% |
| Multidisciplinary Studies | 8 | 0.8% |
| Science & Technology | 53 | 5.4% |
| Business | 67 | 6.9% |
| Education | 39 | 4.0% |
| Literature & Languages | 0 | 0.0% |
| Liberal Arts & History | 28 | 2.9% |
| Visual & Performing Arts | 39 | 4.0% |
| Communications | 79 | 8.1% |
| Arts & Humanities | 68 | 7.0% |
| Total | 978 | 100.0% |
Transportation & Commute in Greenwich
Vehicle Availability by Sex in Greenwich
The most prevalent vehicle ownership categories in Greenwich are males with 2 vehicles (334, accounting for 39.9%) and females with 2 vehicles (289, making up 46.7%).
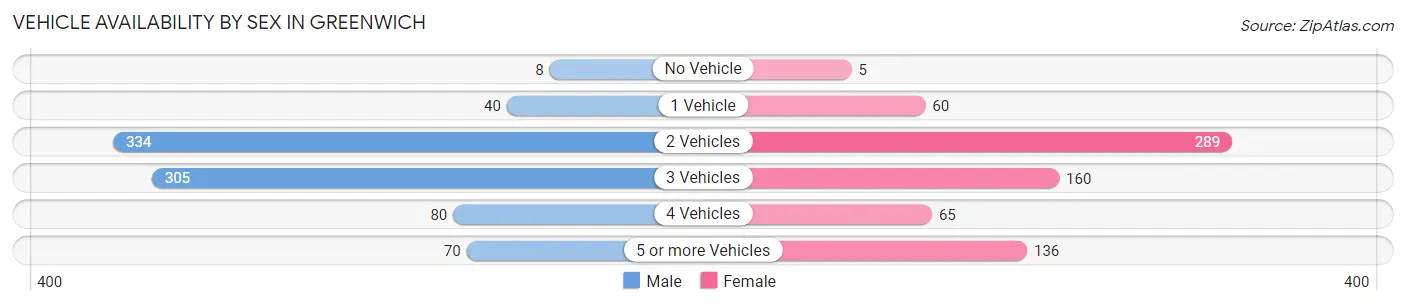
| Vehicles Available | Male | Female |
| No Vehicle | 8 (1.0%) | 5 (0.7%) |
| 1 Vehicle | 40 (4.8%) | 60 (8.4%) |
| 2 Vehicles | 334 (39.9%) | 289 (40.4%) |
| 3 Vehicles | 305 (36.4%) | 160 (22.4%) |
| 4 Vehicles | 80 (9.6%) | 65 (9.1%) |
| 5 or more Vehicles | 70 (8.4%) | 136 (19.0%) |
| Total | 837 (100.0%) | 715 (100.0%) |
Commute Time in Greenwich
The most frequently occuring commute durations in Greenwich are 45 to 59 minutes (238 commuters, 18.3%), 60 to 89 minutes (216 commuters, 16.6%), and 30 to 34 minutes (164 commuters, 12.6%).
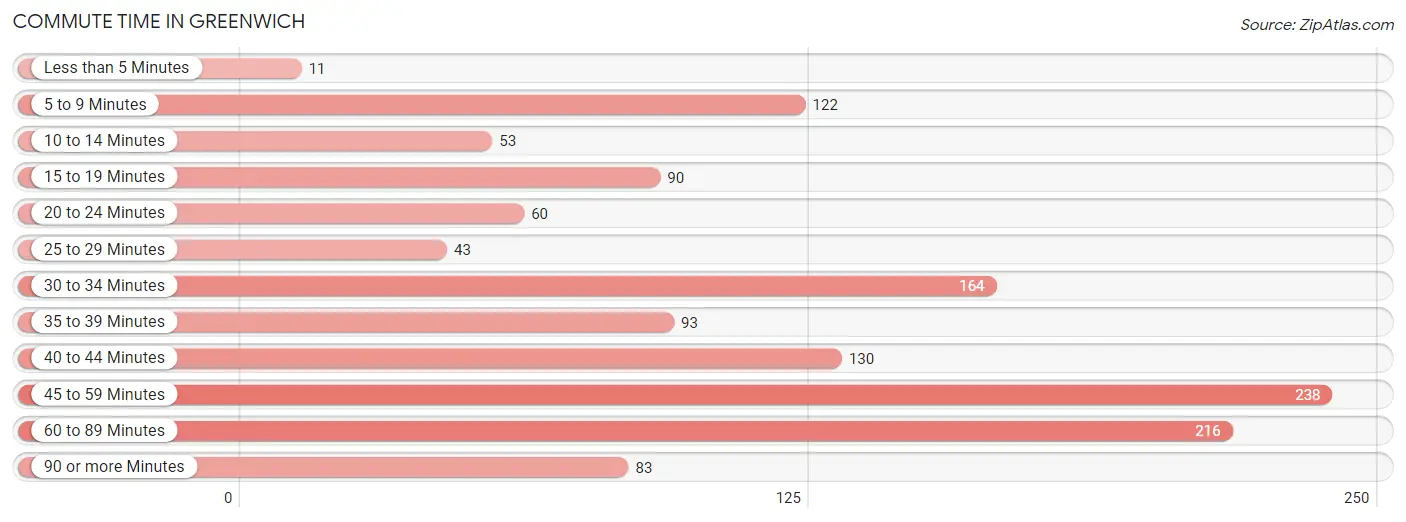
| Commute Time | # Commuters | % Commuters |
| Less than 5 Minutes | 11 | 0.8% |
| 5 to 9 Minutes | 122 | 9.4% |
| 10 to 14 Minutes | 53 | 4.1% |
| 15 to 19 Minutes | 90 | 6.9% |
| 20 to 24 Minutes | 60 | 4.6% |
| 25 to 29 Minutes | 43 | 3.3% |
| 30 to 34 Minutes | 164 | 12.6% |
| 35 to 39 Minutes | 93 | 7.1% |
| 40 to 44 Minutes | 130 | 10.0% |
| 45 to 59 Minutes | 238 | 18.3% |
| 60 to 89 Minutes | 216 | 16.6% |
| 90 or more Minutes | 83 | 6.4% |
Commute Time by Sex in Greenwich
The most common commute times in Greenwich are 45 to 59 minutes (137 commuters, 19.3%) for males and 45 to 59 minutes (101 commuters, 17.0%) for females.
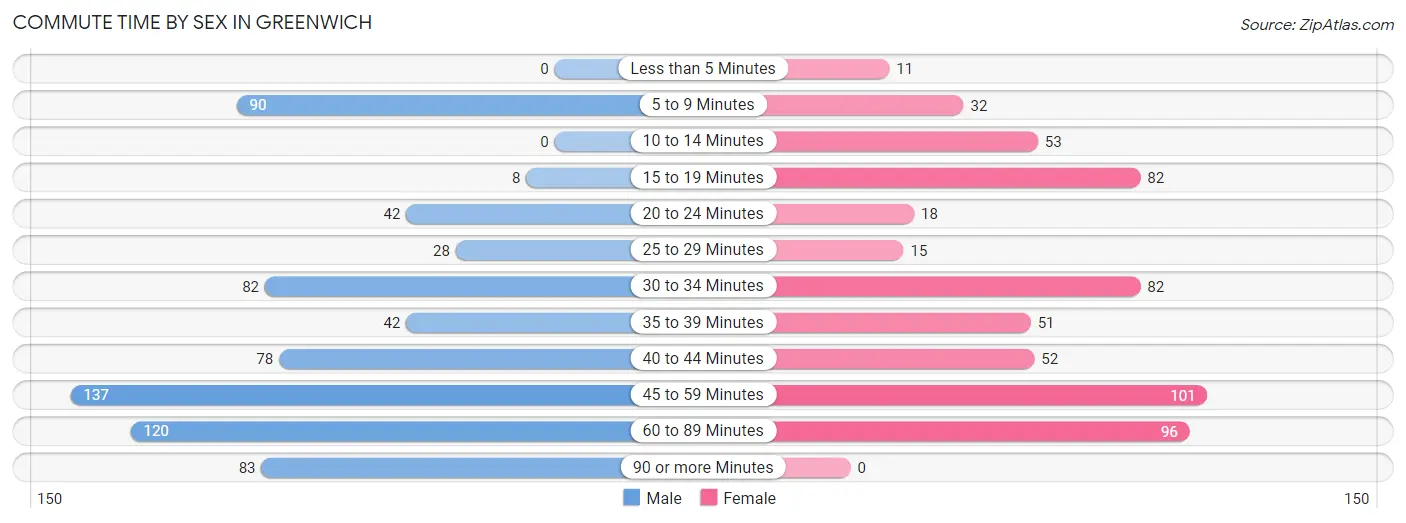
| Commute Time | Male | Female |
| Less than 5 Minutes | 0 (0.0%) | 11 (1.8%) |
| 5 to 9 Minutes | 90 (12.7%) | 32 (5.4%) |
| 10 to 14 Minutes | 0 (0.0%) | 53 (8.9%) |
| 15 to 19 Minutes | 8 (1.1%) | 82 (13.8%) |
| 20 to 24 Minutes | 42 (5.9%) | 18 (3.0%) |
| 25 to 29 Minutes | 28 (3.9%) | 15 (2.5%) |
| 30 to 34 Minutes | 82 (11.6%) | 82 (13.8%) |
| 35 to 39 Minutes | 42 (5.9%) | 51 (8.6%) |
| 40 to 44 Minutes | 78 (11.0%) | 52 (8.8%) |
| 45 to 59 Minutes | 137 (19.3%) | 101 (17.0%) |
| 60 to 89 Minutes | 120 (16.9%) | 96 (16.2%) |
| 90 or more Minutes | 83 (11.7%) | 0 (0.0%) |
Time of Departure to Work by Sex in Greenwich
The most frequent times of departure to work in Greenwich are 7:00 AM to 7:29 AM (164, 23.1%) for males and 6:00 AM to 6:29 AM (128, 21.6%) for females.
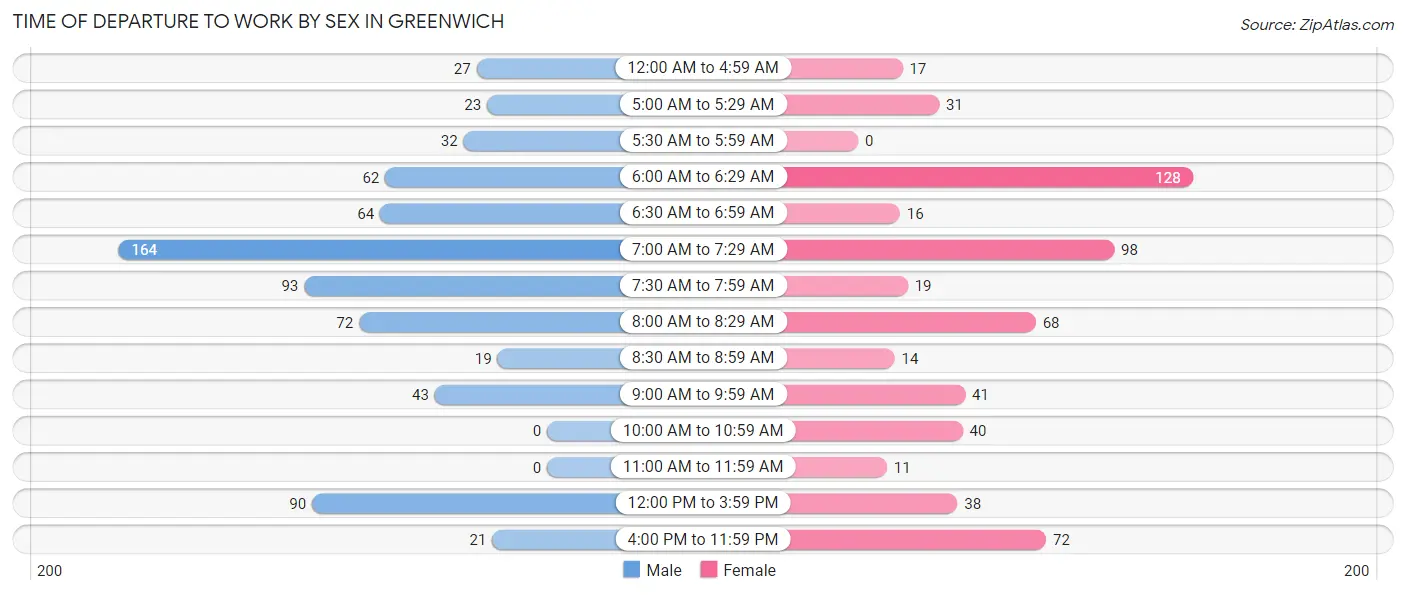
| Time of Departure | Male | Female |
| 12:00 AM to 4:59 AM | 27 (3.8%) | 17 (2.9%) |
| 5:00 AM to 5:29 AM | 23 (3.2%) | 31 (5.2%) |
| 5:30 AM to 5:59 AM | 32 (4.5%) | 0 (0.0%) |
| 6:00 AM to 6:29 AM | 62 (8.7%) | 128 (21.6%) |
| 6:30 AM to 6:59 AM | 64 (9.0%) | 16 (2.7%) |
| 7:00 AM to 7:29 AM | 164 (23.1%) | 98 (16.5%) |
| 7:30 AM to 7:59 AM | 93 (13.1%) | 19 (3.2%) |
| 8:00 AM to 8:29 AM | 72 (10.1%) | 68 (11.5%) |
| 8:30 AM to 8:59 AM | 19 (2.7%) | 14 (2.4%) |
| 9:00 AM to 9:59 AM | 43 (6.1%) | 41 (6.9%) |
| 10:00 AM to 10:59 AM | 0 (0.0%) | 40 (6.8%) |
| 11:00 AM to 11:59 AM | 0 (0.0%) | 11 (1.8%) |
| 12:00 PM to 3:59 PM | 90 (12.7%) | 38 (6.4%) |
| 4:00 PM to 11:59 PM | 21 (3.0%) | 72 (12.1%) |
| Total | 710 (100.0%) | 593 (100.0%) |
Housing Occupancy in Greenwich
Occupancy by Ownership in Greenwich
Of the total 866 dwellings in Greenwich, owner-occupied units account for 811 (93.6%), while renter-occupied units make up 55 (6.4%).
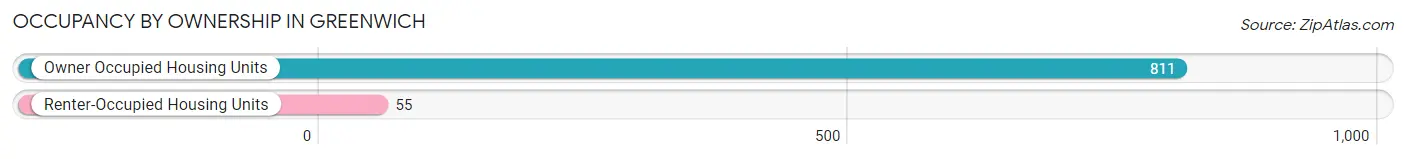
| Occupancy | # Housing Units | % Housing Units |
| Owner Occupied Housing Units | 811 | 93.6% |
| Renter-Occupied Housing Units | 55 | 6.4% |
| Total Occupied Housing Units | 866 | 100.0% |
Occupancy by Household Size in Greenwich
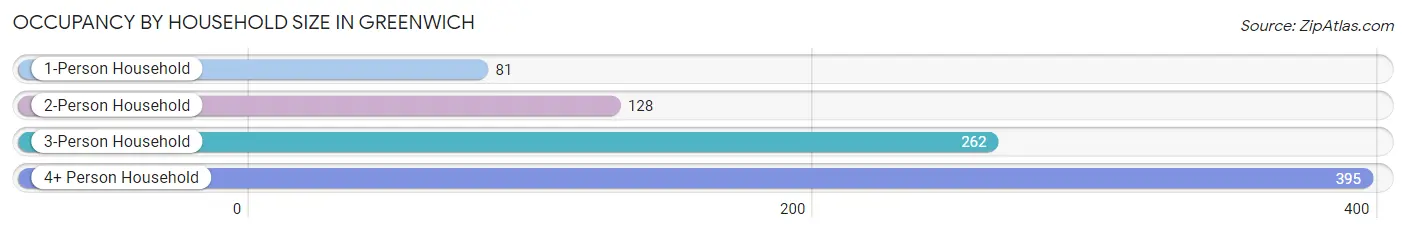
| Household Size | # Housing Units | % Housing Units |
| 1-Person Household | 81 | 9.3% |
| 2-Person Household | 128 | 14.8% |
| 3-Person Household | 262 | 30.2% |
| 4+ Person Household | 395 | 45.6% |
| Total Housing Units | 866 | 100.0% |
Occupancy by Ownership by Household Size in Greenwich
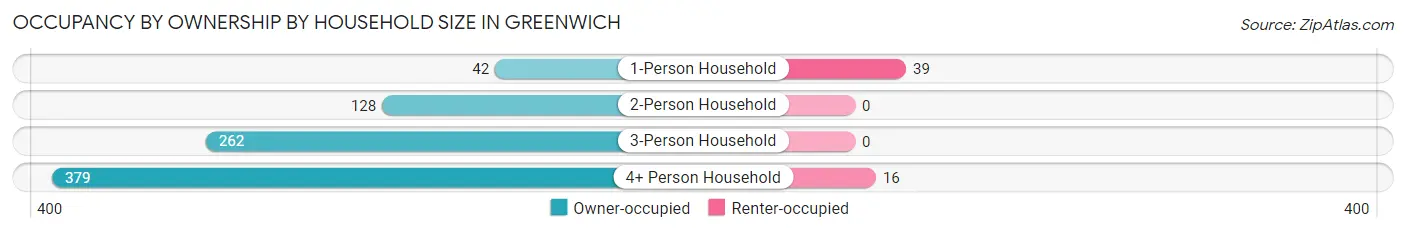
| Household Size | Owner-occupied | Renter-occupied |
| 1-Person Household | 42 (51.8%) | 39 (48.1%) |
| 2-Person Household | 128 (100.0%) | 0 (0.0%) |
| 3-Person Household | 262 (100.0%) | 0 (0.0%) |
| 4+ Person Household | 379 (96.0%) | 16 (4.1%) |
| Total Housing Units | 811 (93.6%) | 55 (6.4%) |
Occupancy by Educational Attainment in Greenwich
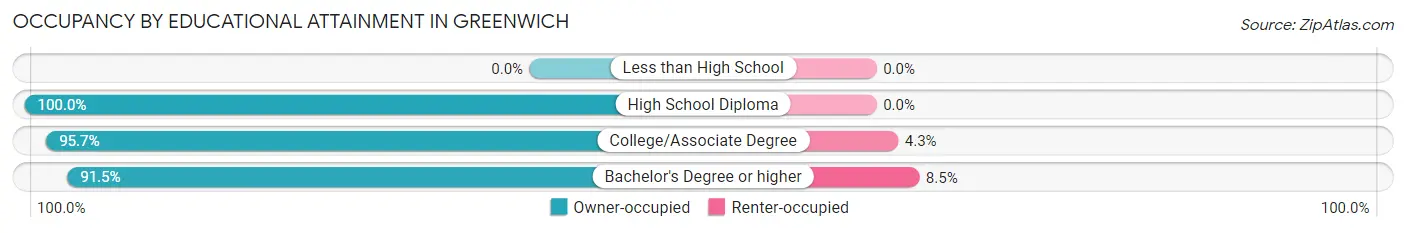
| Household Size | Owner-occupied | Renter-occupied |
| Less than High School | 0 (0.0%) | 0 (0.0%) |
| High School Diploma | 125 (100.0%) | 0 (0.0%) |
| College/Associate Degree | 178 (95.7%) | 8 (4.3%) |
| Bachelor's Degree or higher | 508 (91.5%) | 47 (8.5%) |
Occupancy by Age of Householder in Greenwich
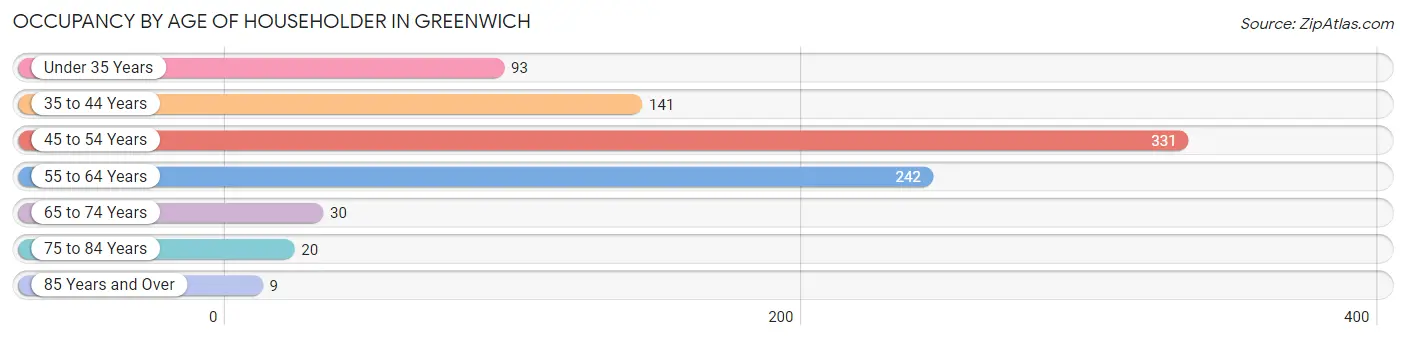
| Age Bracket | # Households | % Households |
| Under 35 Years | 93 | 10.7% |
| 35 to 44 Years | 141 | 16.3% |
| 45 to 54 Years | 331 | 38.2% |
| 55 to 64 Years | 242 | 27.9% |
| 65 to 74 Years | 30 | 3.5% |
| 75 to 84 Years | 20 | 2.3% |
| 85 Years and Over | 9 | 1.0% |
| Total | 866 | 100.0% |
Housing Finances in Greenwich
Median Income by Occupancy in Greenwich
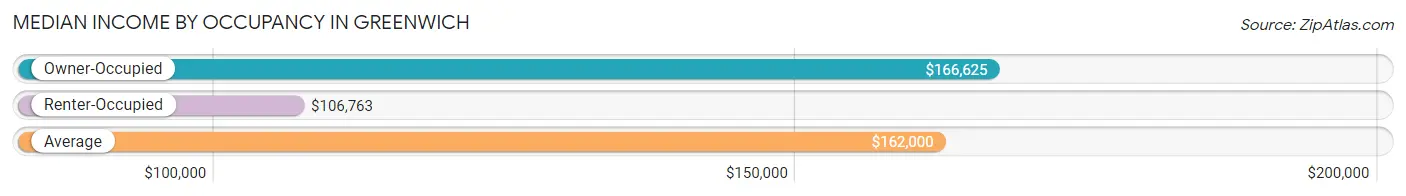
| Occupancy Type | # Households | Median Income |
| Owner-Occupied | 811 (93.6%) | $166,625 |
| Renter-Occupied | 55 (6.4%) | $106,763 |
| Average | 866 (100.0%) | $162,000 |
Occupancy by Householder Income Bracket in Greenwich
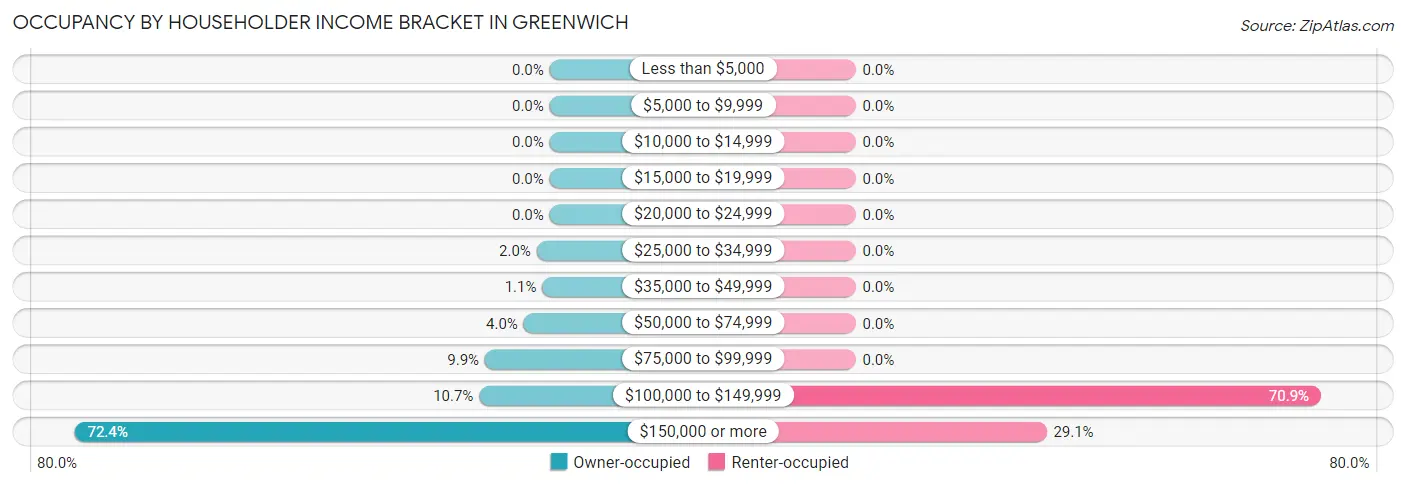
| Income Bracket | Owner-occupied | Renter-occupied |
| Less than $5,000 | 0 (0.0%) | 0 (0.0%) |
| $5,000 to $9,999 | 0 (0.0%) | 0 (0.0%) |
| $10,000 to $14,999 | 0 (0.0%) | 0 (0.0%) |
| $15,000 to $19,999 | 0 (0.0%) | 0 (0.0%) |
| $20,000 to $24,999 | 0 (0.0%) | 0 (0.0%) |
| $25,000 to $34,999 | 16 (2.0%) | 0 (0.0%) |
| $35,000 to $49,999 | 9 (1.1%) | 0 (0.0%) |
| $50,000 to $74,999 | 32 (4.0%) | 0 (0.0%) |
| $75,000 to $99,999 | 80 (9.9%) | 0 (0.0%) |
| $100,000 to $149,999 | 87 (10.7%) | 39 (70.9%) |
| $150,000 or more | 587 (72.4%) | 16 (29.1%) |
| Total | 811 (100.0%) | 55 (100.0%) |
Monthly Housing Cost Tiers in Greenwich
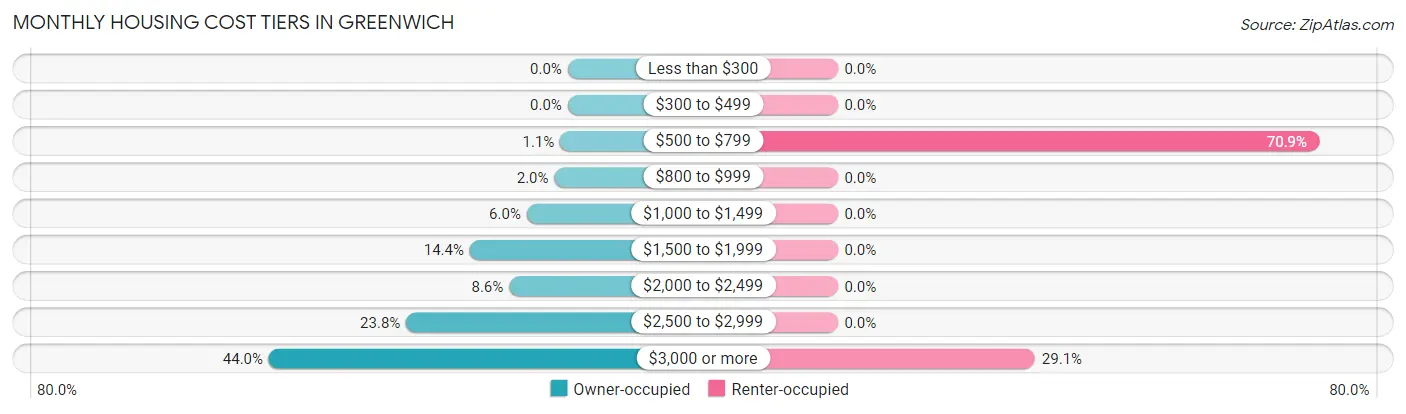
| Monthly Cost | Owner-occupied | Renter-occupied |
| Less than $300 | 0 (0.0%) | 0 (0.0%) |
| $300 to $499 | 0 (0.0%) | 0 (0.0%) |
| $500 to $799 | 9 (1.1%) | 39 (70.9%) |
| $800 to $999 | 16 (2.0%) | 0 (0.0%) |
| $1,000 to $1,499 | 49 (6.0%) | 0 (0.0%) |
| $1,500 to $1,999 | 117 (14.4%) | 0 (0.0%) |
| $2,000 to $2,499 | 70 (8.6%) | 0 (0.0%) |
| $2,500 to $2,999 | 193 (23.8%) | 0 (0.0%) |
| $3,000 or more | 357 (44.0%) | 16 (29.1%) |
| Total | 811 (100.0%) | 55 (100.0%) |
Physical Housing Characteristics in Greenwich
Housing Structures in Greenwich
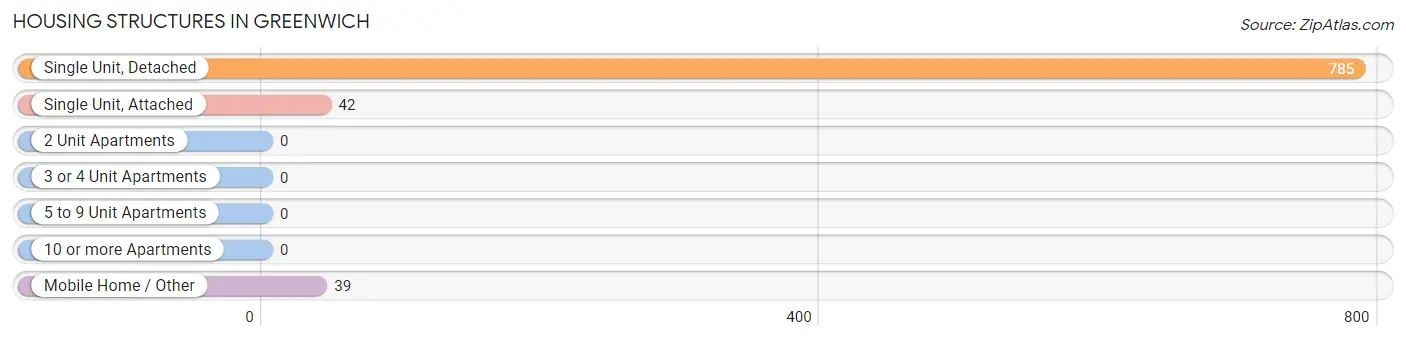
| Structure Type | # Housing Units | % Housing Units |
| Single Unit, Detached | 785 | 90.6% |
| Single Unit, Attached | 42 | 4.9% |
| 2 Unit Apartments | 0 | 0.0% |
| 3 or 4 Unit Apartments | 0 | 0.0% |
| 5 to 9 Unit Apartments | 0 | 0.0% |
| 10 or more Apartments | 0 | 0.0% |
| Mobile Home / Other | 39 | 4.5% |
| Total | 866 | 100.0% |
Housing Structures by Occupancy in Greenwich
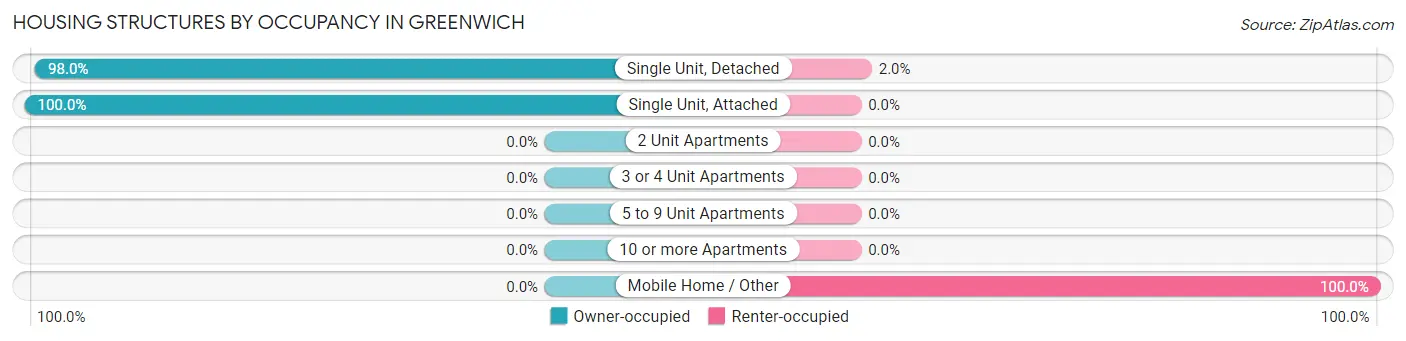
| Structure Type | Owner-occupied | Renter-occupied |
| Single Unit, Detached | 769 (98.0%) | 16 (2.0%) |
| Single Unit, Attached | 42 (100.0%) | 0 (0.0%) |
| 2 Unit Apartments | 0 (0.0%) | 0 (0.0%) |
| 3 or 4 Unit Apartments | 0 (0.0%) | 0 (0.0%) |
| 5 to 9 Unit Apartments | 0 (0.0%) | 0 (0.0%) |
| 10 or more Apartments | 0 (0.0%) | 0 (0.0%) |
| Mobile Home / Other | 0 (0.0%) | 39 (100.0%) |
| Total | 811 (93.6%) | 55 (6.4%) |
Housing Structures by Number of Rooms in Greenwich
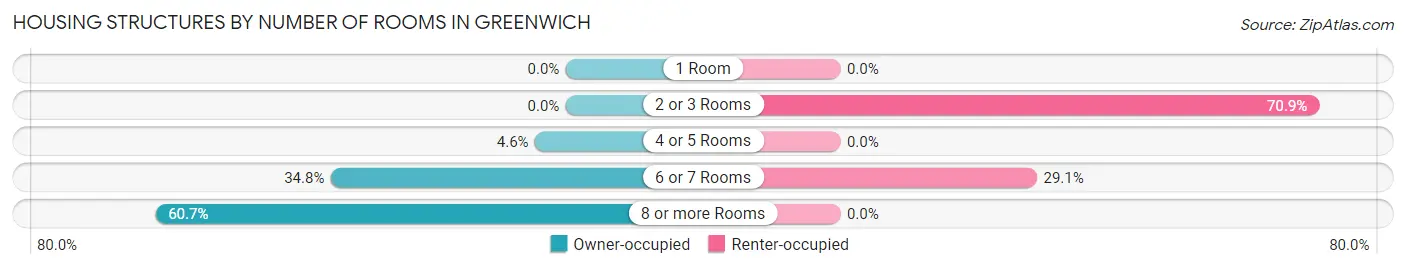
| Number of Rooms | Owner-occupied | Renter-occupied |
| 1 Room | 0 (0.0%) | 0 (0.0%) |
| 2 or 3 Rooms | 0 (0.0%) | 39 (70.9%) |
| 4 or 5 Rooms | 37 (4.6%) | 0 (0.0%) |
| 6 or 7 Rooms | 282 (34.8%) | 16 (29.1%) |
| 8 or more Rooms | 492 (60.7%) | 0 (0.0%) |
| Total | 811 (100.0%) | 55 (100.0%) |
Housing Structure by Heating Type in Greenwich
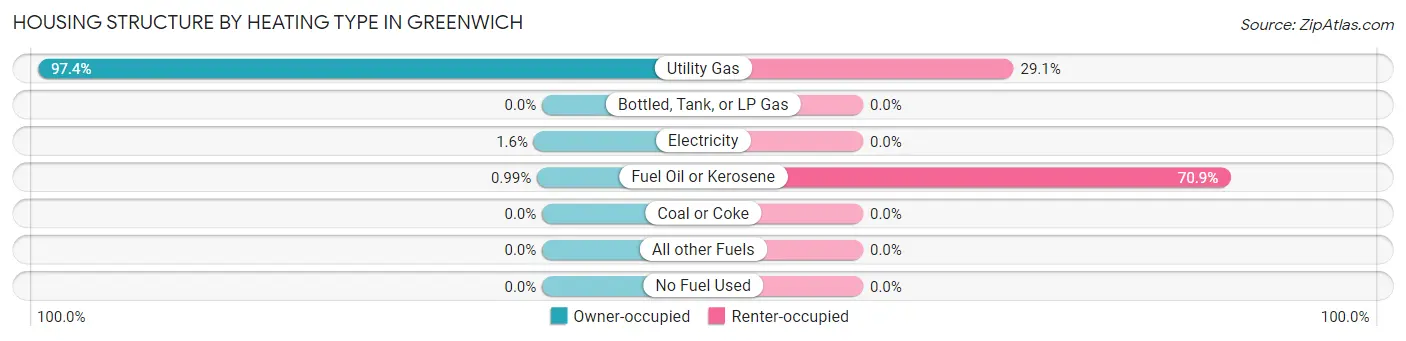
| Heating Type | Owner-occupied | Renter-occupied |
| Utility Gas | 790 (97.4%) | 16 (29.1%) |
| Bottled, Tank, or LP Gas | 0 (0.0%) | 0 (0.0%) |
| Electricity | 13 (1.6%) | 0 (0.0%) |
| Fuel Oil or Kerosene | 8 (1.0%) | 39 (70.9%) |
| Coal or Coke | 0 (0.0%) | 0 (0.0%) |
| All other Fuels | 0 (0.0%) | 0 (0.0%) |
| No Fuel Used | 0 (0.0%) | 0 (0.0%) |
| Total | 811 (100.0%) | 55 (100.0%) |
Household Vehicle Usage in Greenwich
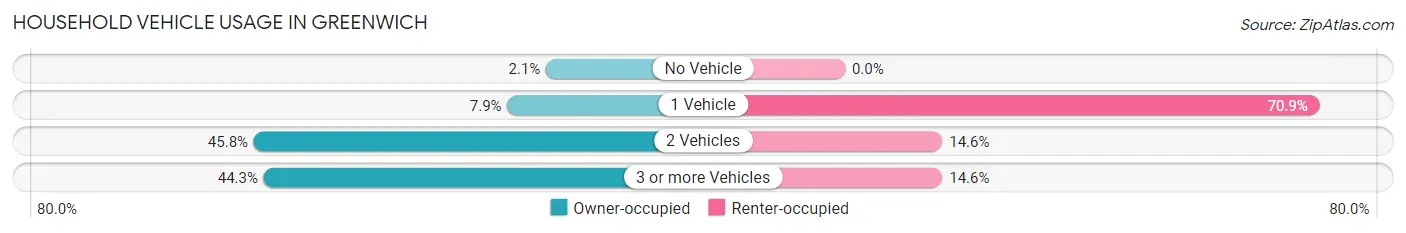
| Vehicles per Household | Owner-occupied | Renter-occupied |
| No Vehicle | 17 (2.1%) | 0 (0.0%) |
| 1 Vehicle | 64 (7.9%) | 39 (70.9%) |
| 2 Vehicles | 371 (45.8%) | 8 (14.5%) |
| 3 or more Vehicles | 359 (44.3%) | 8 (14.5%) |
| Total | 811 (100.0%) | 55 (100.0%) |
Real Estate & Mortgages in Greenwich
Real Estate and Mortgage Overview in Greenwich
| Characteristic | Without Mortgage | With Mortgage |
| Housing Units | 26 | 679 |
| Median Property Value | $245,500 | $435,400 |
| Median Household Income | $133,500 | $566 |
| Monthly Housing Costs | $1,233 | $357 |
| Real Estate Taxes | $9,583 | $0 |
Property Value by Mortgage Status in Greenwich
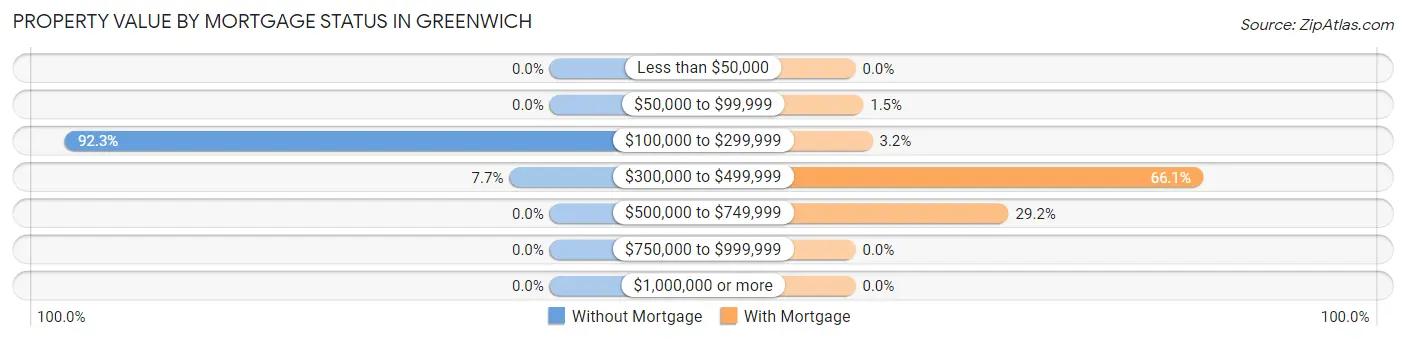
| Property Value | Without Mortgage | With Mortgage |
| Less than $50,000 | 0 (0.0%) | 0 (0.0%) |
| $50,000 to $99,999 | 0 (0.0%) | 10 (1.5%) |
| $100,000 to $299,999 | 24 (92.3%) | 22 (3.2%) |
| $300,000 to $499,999 | 2 (7.7%) | 449 (66.1%) |
| $500,000 to $749,999 | 0 (0.0%) | 198 (29.2%) |
| $750,000 to $999,999 | 0 (0.0%) | 0 (0.0%) |
| $1,000,000 or more | 0 (0.0%) | 0 (0.0%) |
| Total | 26 (100.0%) | 679 (100.0%) |
Household Income by Mortgage Status in Greenwich
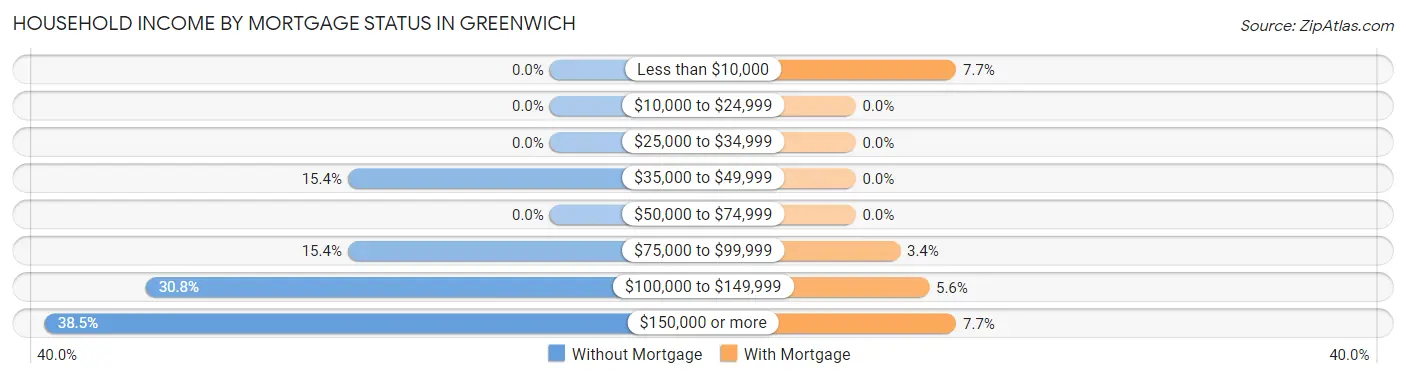
| Household Income | Without Mortgage | With Mortgage |
| Less than $10,000 | 0 (0.0%) | 52 (7.7%) |
| $10,000 to $24,999 | 0 (0.0%) | 0 (0.0%) |
| $25,000 to $34,999 | 0 (0.0%) | 0 (0.0%) |
| $35,000 to $49,999 | 4 (15.4%) | 0 (0.0%) |
| $50,000 to $74,999 | 0 (0.0%) | 0 (0.0%) |
| $75,000 to $99,999 | 4 (15.4%) | 23 (3.4%) |
| $100,000 to $149,999 | 8 (30.8%) | 38 (5.6%) |
| $150,000 or more | 10 (38.5%) | 52 (7.7%) |
| Total | 26 (100.0%) | 679 (100.0%) |
Property Value to Household Income Ratio in Greenwich
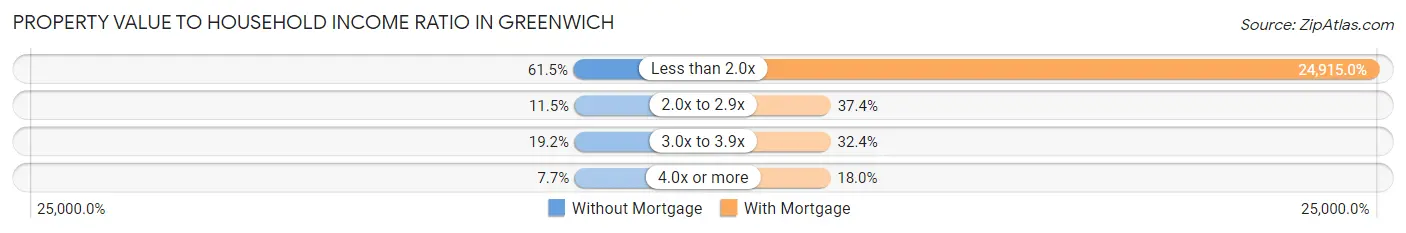
| Value-to-Income Ratio | Without Mortgage | With Mortgage |
| Less than 2.0x | 16 (61.5%) | 169,173 (24,915.0%) |
| 2.0x to 2.9x | 3 (11.5%) | 254 (37.4%) |
| 3.0x to 3.9x | 5 (19.2%) | 220 (32.4%) |
| 4.0x or more | 2 (7.7%) | 122 (18.0%) |
| Total | 26 (100.0%) | 679 (100.0%) |
Real Estate Taxes by Mortgage Status in Greenwich
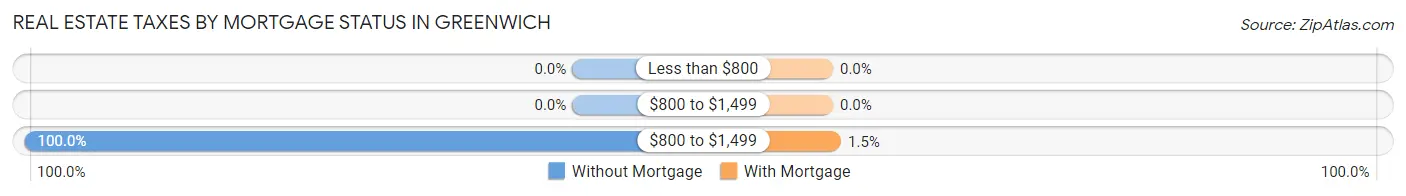
| Property Taxes | Without Mortgage | With Mortgage |
| Less than $800 | 0 (0.0%) | 0 (0.0%) |
| $800 to $1,499 | 0 (0.0%) | 0 (0.0%) |
| $800 to $1,499 | 26 (100.0%) | 10 (1.5%) |
| Total | 26 (100.0%) | 679 (100.0%) |
Health & Disability in Greenwich
Health Insurance Coverage by Age in Greenwich
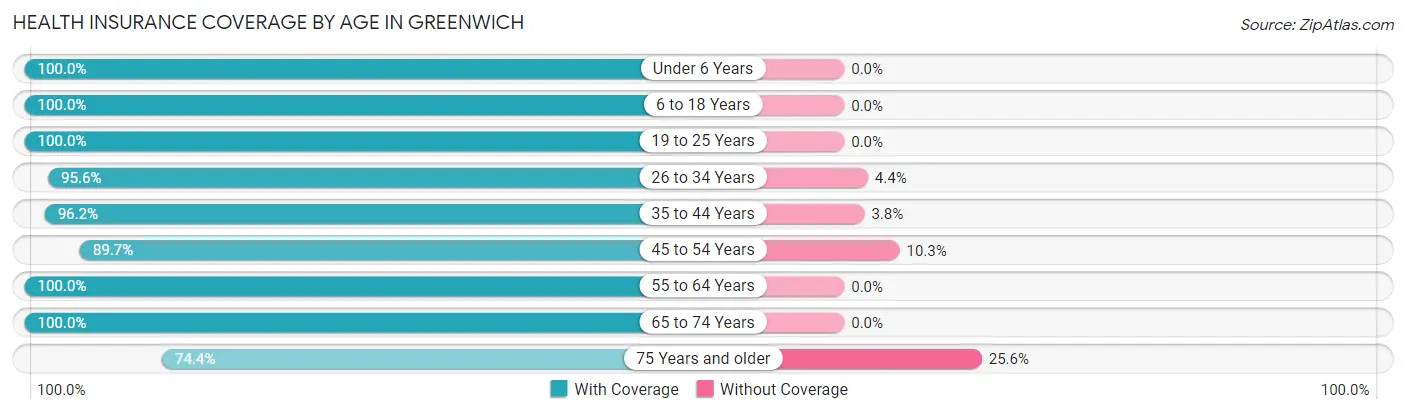
| Age Bracket | With Coverage | Without Coverage |
| Under 6 Years | 125 (100.0%) | 0 (0.0%) |
| 6 to 18 Years | 675 (100.0%) | 0 (0.0%) |
| 19 to 25 Years | 389 (100.0%) | 0 (0.0%) |
| 26 to 34 Years | 174 (95.6%) | 8 (4.4%) |
| 35 to 44 Years | 307 (96.2%) | 12 (3.8%) |
| 45 to 54 Years | 522 (89.7%) | 60 (10.3%) |
| 55 to 64 Years | 493 (100.0%) | 0 (0.0%) |
| 65 to 74 Years | 62 (100.0%) | 0 (0.0%) |
| 75 Years and older | 29 (74.4%) | 10 (25.6%) |
| Total | 2,776 (96.9%) | 90 (3.1%) |
Health Insurance Coverage by Citizenship Status in Greenwich
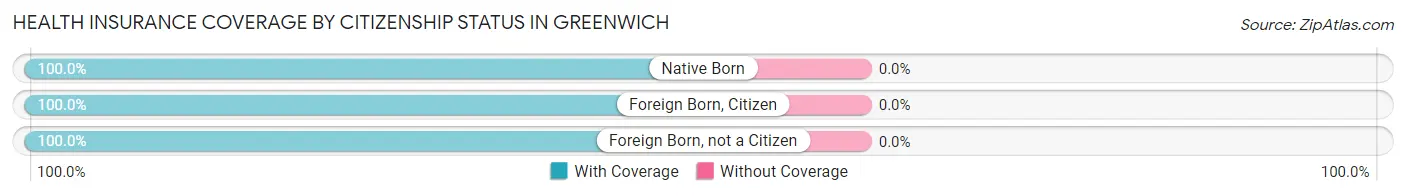
| Citizenship Status | With Coverage | Without Coverage |
| Native Born | 125 (100.0%) | 0 (0.0%) |
| Foreign Born, Citizen | 675 (100.0%) | 0 (0.0%) |
| Foreign Born, not a Citizen | 389 (100.0%) | 0 (0.0%) |
Health Insurance Coverage by Household Income in Greenwich
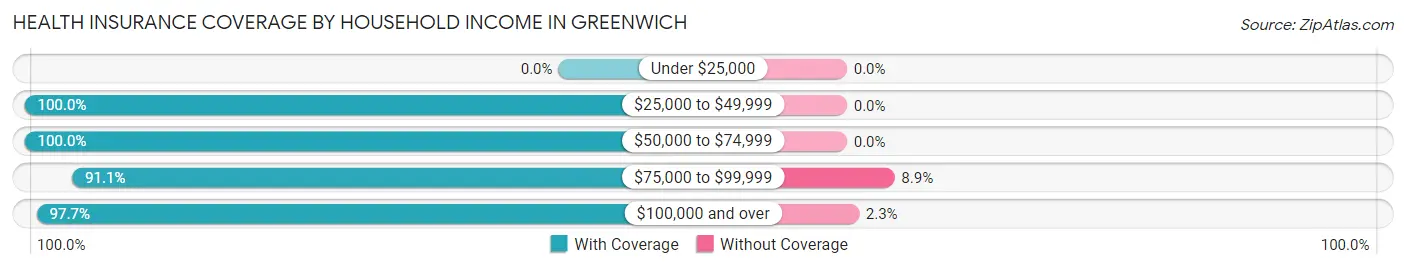
| Household Income | With Coverage | Without Coverage |
| Under $25,000 | 0 (0.0%) | 0 (0.0%) |
| $25,000 to $49,999 | 86 (100.0%) | 0 (0.0%) |
| $50,000 to $74,999 | 54 (100.0%) | 0 (0.0%) |
| $75,000 to $99,999 | 388 (91.1%) | 38 (8.9%) |
| $100,000 and over | 2,248 (97.7%) | 52 (2.3%) |
Public vs Private Health Insurance Coverage by Age in Greenwich
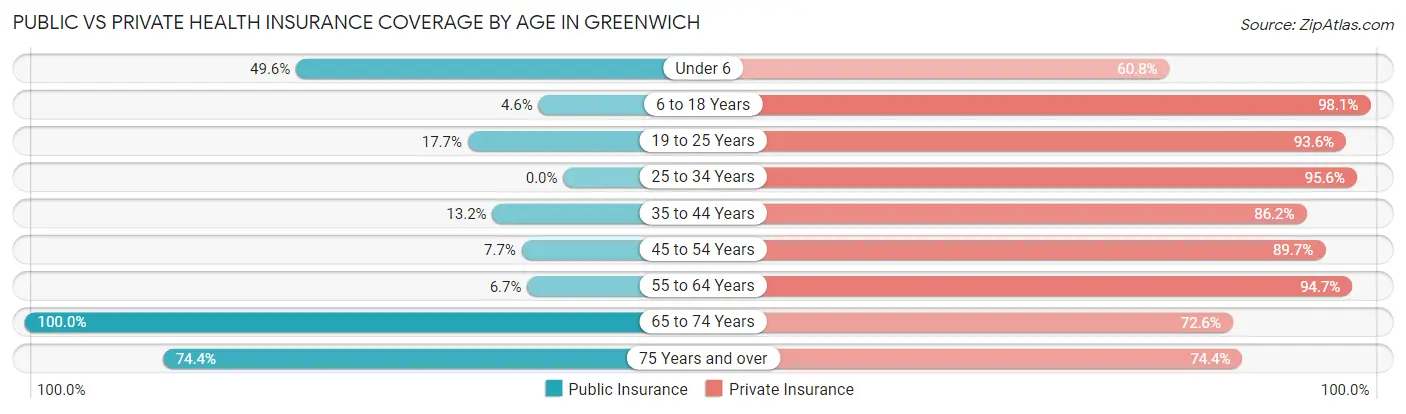
| Age Bracket | Public Insurance | Private Insurance |
| Under 6 | 62 (49.6%) | 76 (60.8%) |
| 6 to 18 Years | 31 (4.6%) | 662 (98.1%) |
| 19 to 25 Years | 69 (17.7%) | 364 (93.6%) |
| 25 to 34 Years | 0 (0.0%) | 174 (95.6%) |
| 35 to 44 Years | 42 (13.2%) | 275 (86.2%) |
| 45 to 54 Years | 45 (7.7%) | 522 (89.7%) |
| 55 to 64 Years | 33 (6.7%) | 467 (94.7%) |
| 65 to 74 Years | 62 (100.0%) | 45 (72.6%) |
| 75 Years and over | 29 (74.4%) | 29 (74.4%) |
| Total | 373 (13.0%) | 2,614 (91.2%) |
Disability Status by Sex by Age in Greenwich
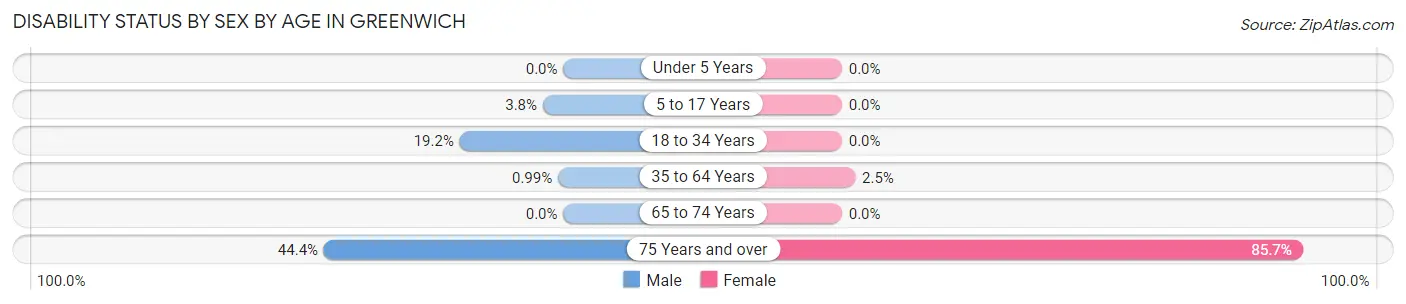
| Age Bracket | Male | Female |
| Under 5 Years | 0 (0.0%) | 0 (0.0%) |
| 5 to 17 Years | 14 (3.8%) | 0 (0.0%) |
| 18 to 34 Years | 65 (19.2%) | 0 (0.0%) |
| 35 to 64 Years | 7 (1.0%) | 17 (2.5%) |
| 65 to 74 Years | 0 (0.0%) | 0 (0.0%) |
| 75 Years and over | 8 (44.4%) | 18 (85.7%) |
Disability Class by Sex by Age in Greenwich
Disability Class: Hearing Difficulty
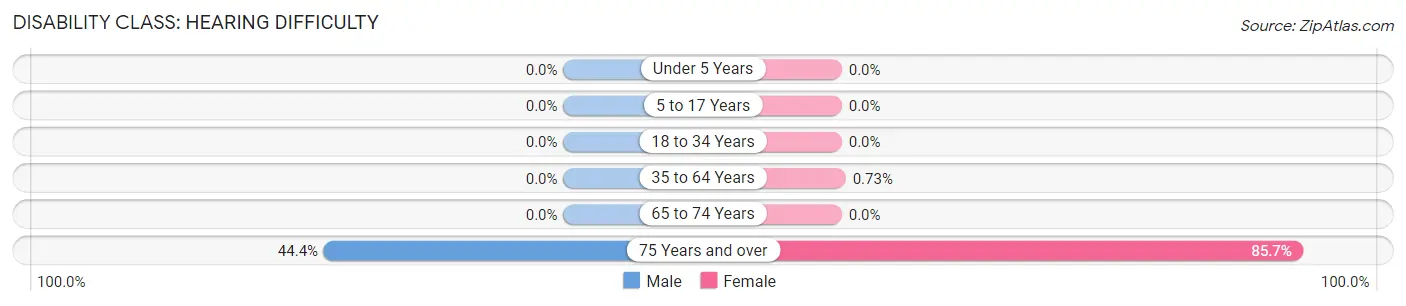
| Age Bracket | Male | Female |
| Under 5 Years | 0 (0.0%) | 0 (0.0%) |
| 5 to 17 Years | 0 (0.0%) | 0 (0.0%) |
| 18 to 34 Years | 0 (0.0%) | 0 (0.0%) |
| 35 to 64 Years | 0 (0.0%) | 5 (0.7%) |
| 65 to 74 Years | 0 (0.0%) | 0 (0.0%) |
| 75 Years and over | 8 (44.4%) | 18 (85.7%) |
Disability Class: Vision Difficulty
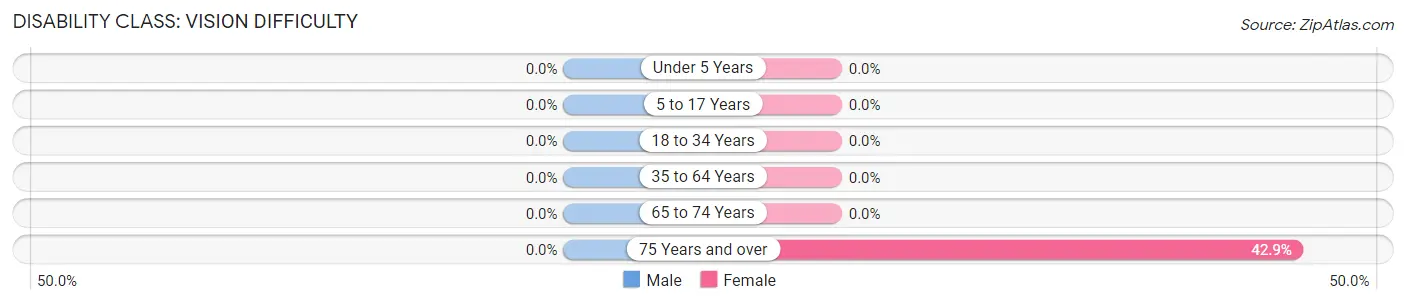
| Age Bracket | Male | Female |
| Under 5 Years | 0 (0.0%) | 0 (0.0%) |
| 5 to 17 Years | 0 (0.0%) | 0 (0.0%) |
| 18 to 34 Years | 0 (0.0%) | 0 (0.0%) |
| 35 to 64 Years | 0 (0.0%) | 0 (0.0%) |
| 65 to 74 Years | 0 (0.0%) | 0 (0.0%) |
| 75 Years and over | 0 (0.0%) | 9 (42.9%) |
Disability Class: Cognitive Difficulty
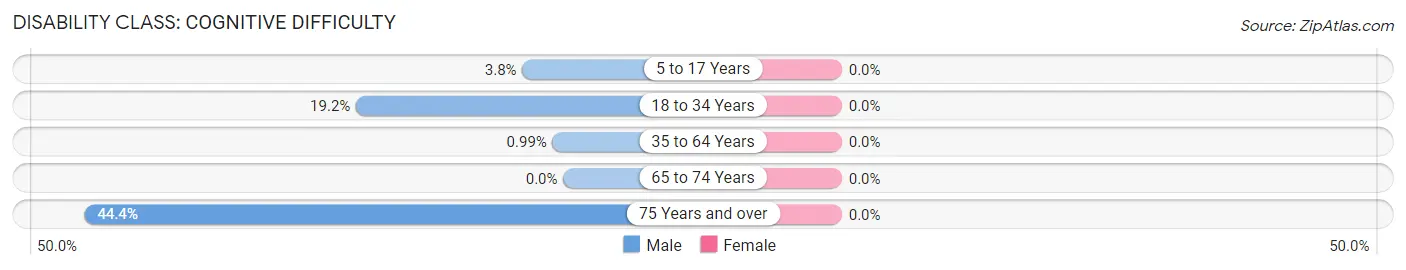
| Age Bracket | Male | Female |
| 5 to 17 Years | 14 (3.8%) | 0 (0.0%) |
| 18 to 34 Years | 65 (19.2%) | 0 (0.0%) |
| 35 to 64 Years | 7 (1.0%) | 0 (0.0%) |
| 65 to 74 Years | 0 (0.0%) | 0 (0.0%) |
| 75 Years and over | 8 (44.4%) | 0 (0.0%) |
Disability Class: Ambulatory Difficulty
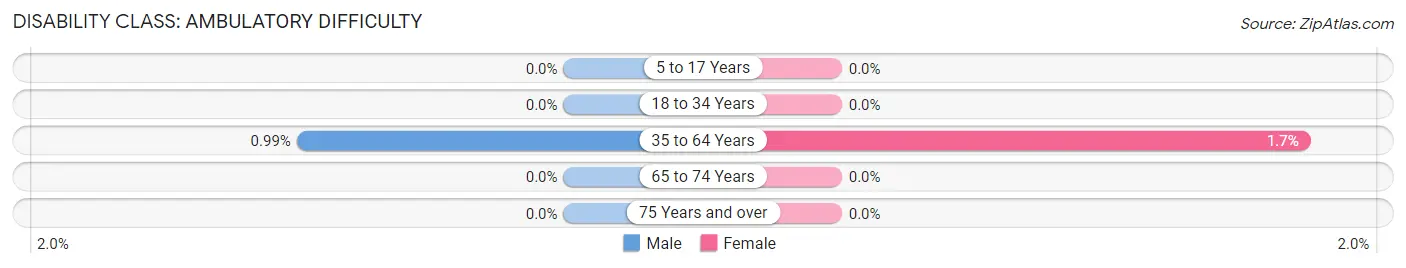
| Age Bracket | Male | Female |
| 5 to 17 Years | 0 (0.0%) | 0 (0.0%) |
| 18 to 34 Years | 0 (0.0%) | 0 (0.0%) |
| 35 to 64 Years | 7 (1.0%) | 12 (1.7%) |
| 65 to 74 Years | 0 (0.0%) | 0 (0.0%) |
| 75 Years and over | 0 (0.0%) | 0 (0.0%) |
Disability Class: Self-Care Difficulty
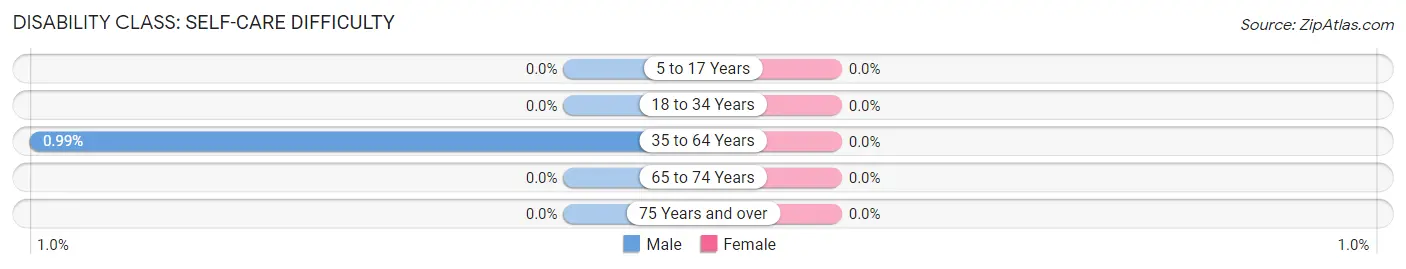
| Age Bracket | Male | Female |
| 5 to 17 Years | 0 (0.0%) | 0 (0.0%) |
| 18 to 34 Years | 0 (0.0%) | 0 (0.0%) |
| 35 to 64 Years | 7 (1.0%) | 0 (0.0%) |
| 65 to 74 Years | 0 (0.0%) | 0 (0.0%) |
| 75 Years and over | 0 (0.0%) | 0 (0.0%) |
Technology Access in Greenwich
Computing Device Access in Greenwich
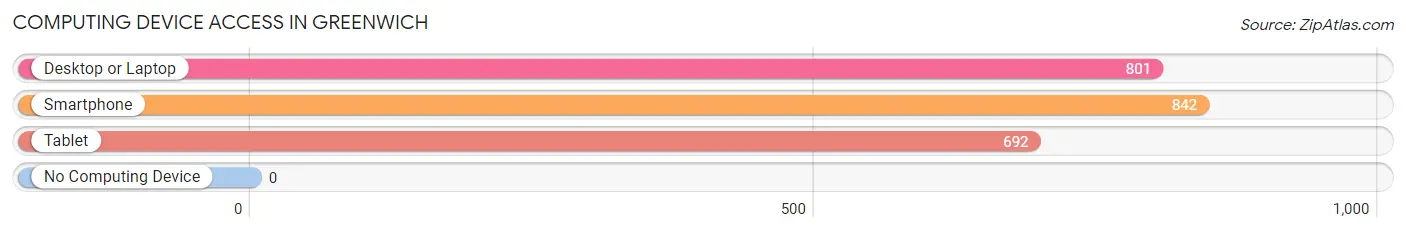
| Device Type | # Households | % Households |
| Desktop or Laptop | 801 | 92.5% |
| Smartphone | 842 | 97.2% |
| Tablet | 692 | 79.9% |
| No Computing Device | 0 | 0.0% |
| Total | 866 | 100.0% |
Internet Access in Greenwich
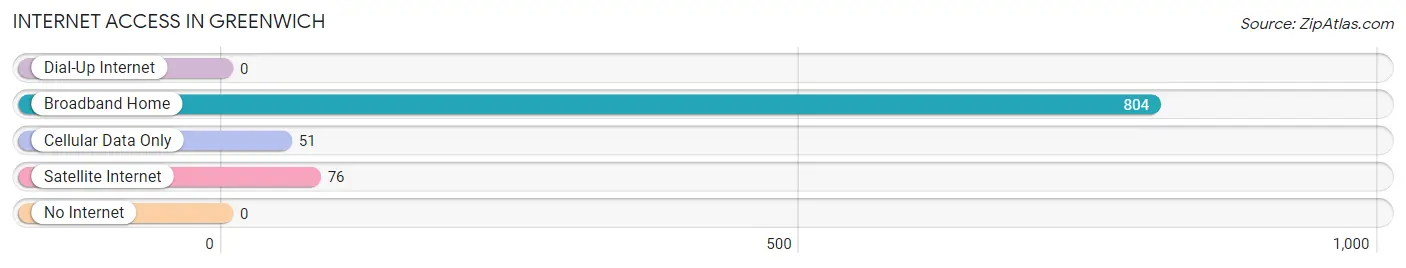
| Internet Type | # Households | % Households |
| Dial-Up Internet | 0 | 0.0% |
| Broadband Home | 804 | 92.8% |
| Cellular Data Only | 51 | 5.9% |
| Satellite Internet | 76 | 8.8% |
| No Internet | 0 | 0.0% |
| Total | 866 | 100.0% |
Greenwich Summary
Greenwich Township is a township located in Gloucester County, New Jersey, United States. As of the 2010 United States Census, the township's population was 4,945, reflecting an increase of 1,845 (+59.3%) from the 3,100 counted in the 2000 Census, which had in turn increased by 1,072 (+53.2%) from the 2,028 counted in the 1990 Census.
Geography
According to the United States Census Bureau, the township had a total area of 11.945 square miles (30.871km^2), including 11.845 square miles (30.619km^2) of land and 0.100 square miles (0.252km^2) of water (0.83%).
Unincorporated communities, localities and place names located partially or completely within the township include Clarksboro, East Greenwich, Mickleton, Mount Royal, New Brooklyn, North Mickleton, Swedesboro and West Greenwich.
The township borders East Greenwich Township, Logan Township, Mantua Township, South Harrison Township and Woolwich Township in Gloucester County; and Deptford Township in Camden County.
Demographics
As of the 2010 United States Census, there were 4,945 people, 1,845 households, and 1,346 families residing in the township. The population density was 417.3 per square mile (161.1/km^2). There were 1,945 housing units at an average density of 163.7 per square mile (63.2/km^2). The racial makeup of the township was 87.90% (4,364) White, 8.17% (405) Black or African American, 0.14% (7) Native American, 1.45% (72) Asian, 0.02% (1) Pacific Islander, 0.90% (45) from other races, and 1.42% (70) from two or more races. Hispanic or Latino of any race were 3.45% (171) of the population.
There were 1,845 households out of which 33.2% had children under the age of 18 living with them, 56.2% were married couples living together, 12.2% had a female householder with no husband present, and 27.2% were non-families. 22.2% of all households were made up of individuals, and 9.2% had someone living alone who was 65 years of age or older. The average household size was 2.68 and the average family size was 3.17.
In the township, the population was spread out with 24.2% under the age of 18, 7.2% from 18 to 24, 28.2% from 25 to 44, 27.3% from 45 to 64, and 13.1% who were 65 years of age or older. The median age was 39.2 years. For every 100 females there were 94.2 males. For every 100 females ages 18 and older there were 91.2 males.
The Census Bureau's 2006-2010 American Community Survey showed that (in 2010 inflation-adjusted dollars) median household income was $77,917 (with a margin of error of +/- $7,945) and the median family income was $90,917 (+/- $7,945). Males had a median income of $60,000 (+/- $7,945) versus $45,000 (+/- $7,945) for females. The per capita income for the borough was $31,917 (+/- $7,945). About 4.2% of families and 5.3% of the population were below the poverty line, including 6.3% of those under age 18 and 5.2% of those age 65 or over.
Economy
Greenwich Township is home to several businesses, including a number of small businesses and a few larger companies. The township is home to the headquarters of the New Jersey Turnpike Authority, which is responsible for the operation and maintenance of the New Jersey Turnpike and the Garden State Parkway. The township is also home to the headquarters of the South Jersey Port Corporation, which operates the Port of Paulsboro.
The township is home to a number of small businesses, including a number of restaurants, a few retail stores, and a few professional services. The township is also home to a number of larger companies, including the South Jersey Port Corporation, the New Jersey Turnpike Authority, and the Gloucester County Times.
The township is also home to a number of farms, including the historic Red Bank Farm, which is one of the oldest farms in the area. The farm is home to a variety of animals, including horses, cows, pigs, and chickens. The farm also produces a variety of fruits and vegetables, including apples, peaches, and tomatoes.
Conclusion
Greenwich Township is a township located in Gloucester County, New Jersey. As of the 2010 United States Census, the township's population was 4,945. The township is home to a number of businesses, including a number of small businesses and a few larger companies. The township is also home to a number of farms, including the historic Red Bank Farm. The township has a diverse economy, with a variety of businesses and industries. The township is also home to a number of parks and recreational areas, making it a great place to live and work.
Common Questions
What is Per Capita Income in Greenwich?
Per Capita income in Greenwich is $52,314.
What is the Median Family Income in Greenwich?
Median Family Income in Greenwich is $167,121.
What is the Median Household income in Greenwich?
Median Household Income in Greenwich is $162,000.
What is Income or Wage Gap in Greenwich?
Income or Wage Gap in Greenwich is 29.0%.
Women in Greenwich earn 71.0 cents for every dollar earned by a man.
What is Inequality or Gini Index in Greenwich?
Inequality or Gini Index in Greenwich is 0.25.
What is the Total Population of Greenwich?
Total Population of Greenwich is 2,866.
What is the Total Male Population of Greenwich?
Total Male Population of Greenwich is 1,507.
What is the Total Female Population of Greenwich?
Total Female Population of Greenwich is 1,359.
What is the Ratio of Males per 100 Females in Greenwich?
There are 110.89 Males per 100 Females in Greenwich.
What is the Ratio of Females per 100 Males in Greenwich?
There are 90.18 Females per 100 Males in Greenwich.
What is the Median Population Age in Greenwich?
Median Population Age in Greenwich is 38.2 Years.
What is the Average Family Size in Greenwich
Average Family Size in Greenwich is 3.5 People.
What is the Average Household Size in Greenwich
Average Household Size in Greenwich is 3.3 People.
How Large is the Labor Force in Greenwich?
There are 1,697 People in the Labor Forcein in Greenwich.
What is the Percentage of People in the Labor Force in Greenwich?
76.7% of People are in the Labor Force in Greenwich.
What is the Unemployment Rate in Greenwich?
Unemployment Rate in Greenwich is 7.2%.