Cities with the Highest Percentage of Population Employed in Wholesale Trade in New Jersey
RELATED REPORTS & OPTIONS
Wholesale Trade
New Jersey
Compare Cities
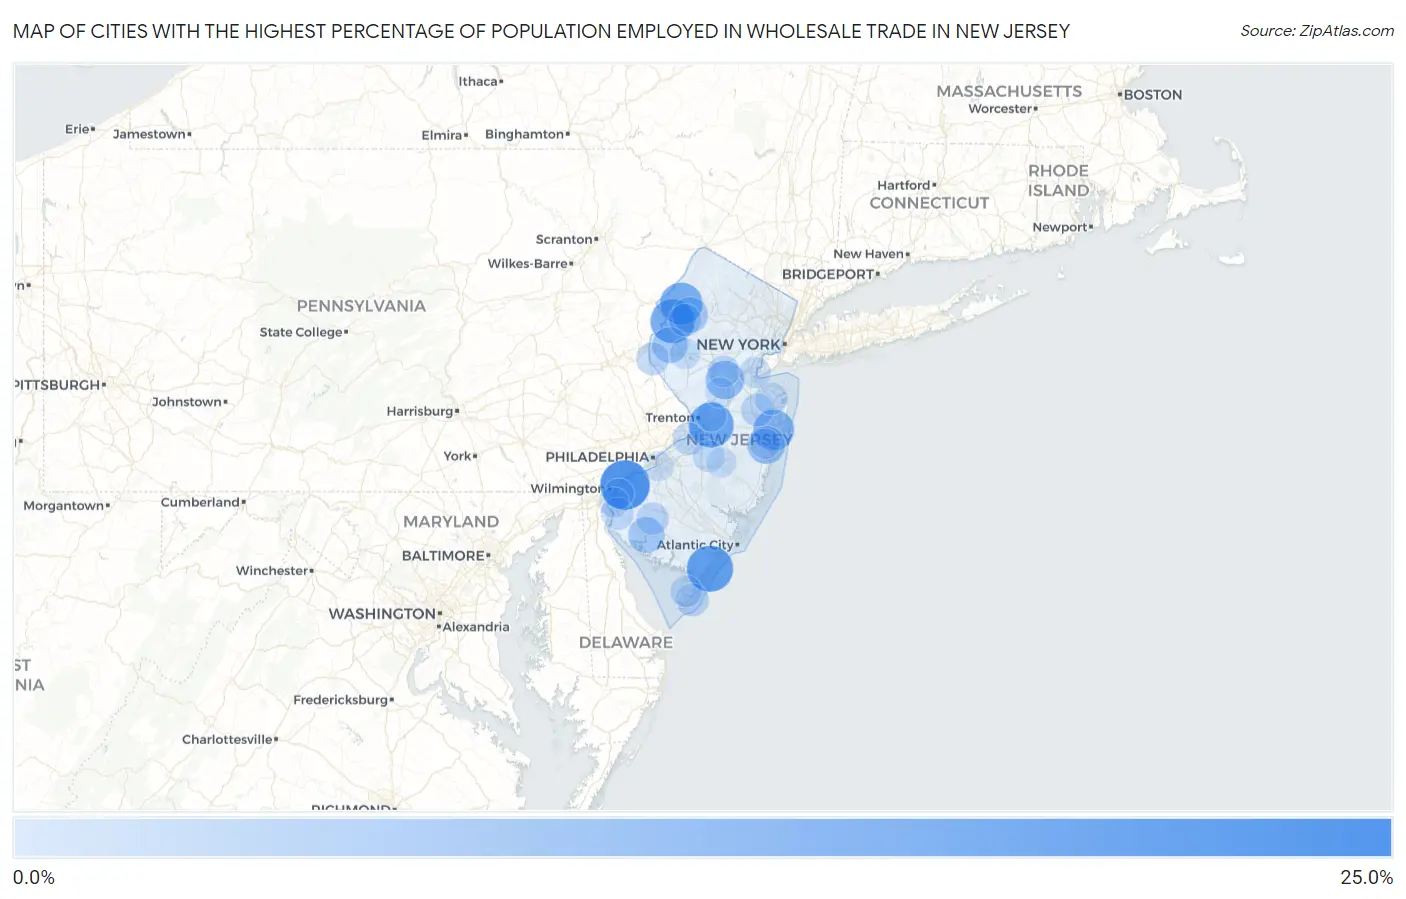
Map of Cities with the Highest Percentage of Population Employed in Wholesale Trade in New Jersey
0.0%
25.0%
Cities with the Highest Percentage of Population Employed in Wholesale Trade in New Jersey
| City | % Employed | vs State | vs National | |
| 1. | Pedricktown | 20.5% | 3.1%(+17.4)#1 | 2.4%(+18.1)#216 |
| 2. | Port Morris | 19.0% | 3.1%(+15.9)#2 | 2.4%(+16.6)#250 |
| 3. | Strathmere | 17.8% | 3.1%(+14.7)#3 | 2.4%(+15.4)#299 |
| 4. | Groveville | 16.7% | 3.1%(+13.6)#4 | 2.4%(+14.3)#341 |
| 5. | Mountain Lake | 16.0% | 3.1%(+12.9)#5 | 2.4%(+13.6)#371 |
| 6. | Lavallette Borough | 15.4% | 3.1%(+12.3)#6 | 2.4%(+13.0)#394 |
| 7. | Marksboro | 14.7% | 3.1%(+11.6)#7 | 2.4%(+12.3)#442 |
| 8. | Woodlynne Borough | 14.1% | 3.1%(+11.0)#8 | 2.4%(+11.7)#485 |
| 9. | Allenwood | 13.5% | 3.1%(+10.4)#9 | 2.4%(+11.1)#527 |
| 10. | Stonebridge | 13.1% | 3.1%(+10.00)#10 | 2.4%(+10.7)#564 |
| 11. | Regency At Monroe | 12.3% | 3.1%(+9.23)#11 | 2.4%(+9.93)#641 |
| 12. | Carlls Corner | 12.1% | 3.1%(+8.96)#12 | 2.4%(+9.65)#671 |
| 13. | Six Mile Run | 11.6% | 3.1%(+8.47)#13 | 2.4%(+9.17)#718 |
| 14. | Jobstown | 11.2% | 3.1%(+8.09)#14 | 2.4%(+8.79)#758 |
| 15. | Leisure Village East | 11.1% | 3.1%(+7.99)#15 | 2.4%(+8.69)#778 |
| 16. | Englewood Cliffs Borough | 10.9% | 3.1%(+7.77)#16 | 2.4%(+8.47)#805 |
| 17. | Arrowhead Lake | 10.5% | 3.1%(+7.43)#17 | 2.4%(+8.12)#859 |
| 18. | Newfoundland | 10.1% | 3.1%(+7.02)#18 | 2.4%(+7.72)#915 |
| 19. | Dutch Neck | 9.8% | 3.1%(+6.74)#19 | 2.4%(+7.43)#980 |
| 20. | Bridgeton | 9.6% | 3.1%(+6.52)#20 | 2.4%(+7.22)#1,027 |
| 21. | Panther Valley | 9.5% | 3.1%(+6.39)#21 | 2.4%(+7.08)#1,052 |
| 22. | Asbury | 9.5% | 3.1%(+6.37)#22 | 2.4%(+7.07)#1,056 |
| 23. | Saddle River Borough | 9.3% | 3.1%(+6.23)#23 | 2.4%(+6.93)#1,086 |
| 24. | Allenhurst Borough | 9.2% | 3.1%(+6.07)#24 | 2.4%(+6.77)#1,121 |
| 25. | Swedesboro Borough | 9.0% | 3.1%(+5.90)#25 | 2.4%(+6.60)#1,168 |
| 26. | South Seaville | 8.8% | 3.1%(+5.69)#26 | 2.4%(+6.38)#1,222 |
| 27. | East Newark Borough | 8.4% | 3.1%(+5.31)#27 | 2.4%(+6.00)#1,331 |
| 28. | Thorofare | 8.2% | 3.1%(+5.14)#28 | 2.4%(+5.84)#1,393 |
| 29. | Cream Ridge | 8.0% | 3.1%(+4.94)#29 | 2.4%(+5.64)#1,445 |
| 30. | Paulsboro Borough | 7.9% | 3.1%(+4.84)#30 | 2.4%(+5.54)#1,482 |
| 31. | Wanaque Borough | 7.9% | 3.1%(+4.77)#31 | 2.4%(+5.47)#1,510 |
| 32. | Ringwood Borough | 7.9% | 3.1%(+4.75)#32 | 2.4%(+5.45)#1,513 |
| 33. | Wenonah Borough | 7.8% | 3.1%(+4.74)#33 | 2.4%(+5.44)#1,519 |
| 34. | Deal Borough | 7.7% | 3.1%(+4.62)#34 | 2.4%(+5.32)#1,560 |
| 35. | Finesville | 7.2% | 3.1%(+4.10)#35 | 2.4%(+4.79)#1,768 |
| 36. | East Freehold | 7.2% | 3.1%(+4.08)#36 | 2.4%(+4.77)#1,782 |
| 37. | Wildwood | 7.1% | 3.1%(+4.04)#37 | 2.4%(+4.74)#1,820 |
| 38. | Olivet | 7.0% | 3.1%(+3.93)#38 | 2.4%(+4.62)#1,868 |
| 39. | Maywood Borough | 6.9% | 3.1%(+3.83)#39 | 2.4%(+4.53)#1,916 |
| 40. | Peapack And Gladstone Borough | 6.9% | 3.1%(+3.81)#40 | 2.4%(+4.51)#1,923 |
| 41. | Great Notch | 6.9% | 3.1%(+3.80)#41 | 2.4%(+4.50)#1,932 |
| 42. | Lincroft | 6.8% | 3.1%(+3.70)#42 | 2.4%(+4.40)#1,995 |
| 43. | Burlington | 6.8% | 3.1%(+3.67)#43 | 2.4%(+4.37)#2,012 |
| 44. | Vienna | 6.8% | 3.1%(+3.66)#44 | 2.4%(+4.36)#2,017 |
| 45. | Troy Hills | 6.7% | 3.1%(+3.63)#45 | 2.4%(+4.33)#2,031 |
| 46. | Salem | 6.7% | 3.1%(+3.63)#46 | 2.4%(+4.33)#2,032 |
| 47. | Hi Nella Borough | 6.7% | 3.1%(+3.63)#47 | 2.4%(+4.32)#2,034 |
| 48. | Deans | 6.7% | 3.1%(+3.59)#48 | 2.4%(+4.29)#2,052 |
| 49. | Harrington Park Borough | 6.5% | 3.1%(+3.36)#49 | 2.4%(+4.06)#2,172 |
| 50. | Franklin Center | 6.4% | 3.1%(+3.33)#50 | 2.4%(+4.03)#2,196 |
| 51. | Hightstown Borough | 6.4% | 3.1%(+3.33)#51 | 2.4%(+4.02)#2,200 |
| 52. | Whitesboro | 6.4% | 3.1%(+3.30)#52 | 2.4%(+4.00)#2,214 |
| 53. | Moonachie Borough | 6.3% | 3.1%(+3.24)#53 | 2.4%(+3.94)#2,247 |
| 54. | Penns Grove Borough | 6.3% | 3.1%(+3.22)#54 | 2.4%(+3.92)#2,266 |
| 55. | Pemberton Heights | 6.2% | 3.1%(+3.10)#55 | 2.4%(+3.79)#2,365 |
| 56. | Palisades Park Borough | 6.1% | 3.1%(+3.00)#56 | 2.4%(+3.69)#2,435 |
| 57. | Edgewater Borough | 6.1% | 3.1%(+2.99)#57 | 2.4%(+3.68)#2,440 |
| 58. | Perth Amboy | 5.9% | 3.1%(+2.82)#58 | 2.4%(+3.52)#2,562 |
| 59. | Fort Lee Borough | 5.9% | 3.1%(+2.78)#59 | 2.4%(+3.48)#2,603 |
| 60. | Andover Borough | 5.9% | 3.1%(+2.77)#60 | 2.4%(+3.47)#2,607 |
| 61. | River Edge Borough | 5.9% | 3.1%(+2.76)#61 | 2.4%(+3.45)#2,616 |
| 62. | Cresskill Borough | 5.8% | 3.1%(+2.74)#62 | 2.4%(+3.43)#2,625 |
| 63. | South Bound Brook Borough | 5.8% | 3.1%(+2.72)#63 | 2.4%(+3.42)#2,632 |
| 64. | Montvale Borough | 5.8% | 3.1%(+2.67)#64 | 2.4%(+3.37)#2,661 |
| 65. | Ogdensburg Borough | 5.8% | 3.1%(+2.65)#65 | 2.4%(+3.35)#2,678 |
| 66. | Barnegat Light Borough | 5.7% | 3.1%(+2.62)#66 | 2.4%(+3.31)#2,708 |
| 67. | Annandale | 5.7% | 3.1%(+2.59)#67 | 2.4%(+3.29)#2,731 |
| 68. | Little Silver Borough | 5.7% | 3.1%(+2.57)#68 | 2.4%(+3.27)#2,750 |
| 69. | Little Ferry Borough | 5.6% | 3.1%(+2.47)#69 | 2.4%(+3.17)#2,844 |
| 70. | Runnemede Borough | 5.5% | 3.1%(+2.43)#70 | 2.4%(+3.13)#2,888 |
| 71. | West Park | 5.5% | 3.1%(+2.40)#71 | 2.4%(+3.10)#2,911 |
| 72. | Stratford Borough | 5.5% | 3.1%(+2.38)#72 | 2.4%(+3.08)#2,933 |
| 73. | Carlstadt Borough | 5.4% | 3.1%(+2.33)#73 | 2.4%(+3.03)#2,989 |
| 74. | Rainbow Lakes | 5.4% | 3.1%(+2.33)#74 | 2.4%(+3.02)#2,992 |
| 75. | Hamilton Square | 5.4% | 3.1%(+2.28)#75 | 2.4%(+2.98)#3,041 |
| 76. | Totowa Borough | 5.4% | 3.1%(+2.28)#76 | 2.4%(+2.97)#3,050 |
| 77. | Butler Borough | 5.4% | 3.1%(+2.27)#77 | 2.4%(+2.97)#3,061 |
| 78. | Presidential Lakes Estates | 5.3% | 3.1%(+2.21)#78 | 2.4%(+2.90)#3,130 |
| 79. | Towaco | 5.3% | 3.1%(+2.19)#79 | 2.4%(+2.89)#3,145 |
| 80. | Pine Brook | 5.2% | 3.1%(+2.14)#80 | 2.4%(+2.84)#3,208 |
| 81. | Carneys Point | 5.2% | 3.1%(+2.10)#81 | 2.4%(+2.80)#3,255 |
| 82. | Pennsville | 5.2% | 3.1%(+2.10)#82 | 2.4%(+2.80)#3,259 |
| 83. | Cliffside Park Borough | 5.2% | 3.1%(+2.08)#83 | 2.4%(+2.78)#3,280 |
| 84. | Closter Borough | 5.2% | 3.1%(+2.07)#84 | 2.4%(+2.77)#3,289 |
| 85. | Leisure Village | 5.2% | 3.1%(+2.06)#85 | 2.4%(+2.76)#3,295 |
| 86. | West Wildwood Borough | 5.2% | 3.1%(+2.06)#86 | 2.4%(+2.76)#3,298 |
| 87. | Gloucester City | 5.1% | 3.1%(+2.04)#87 | 2.4%(+2.73)#3,330 |
| 88. | Seaside Park Borough | 5.1% | 3.1%(+1.99)#88 | 2.4%(+2.69)#3,381 |
| 89. | Rutherford Borough | 5.1% | 3.1%(+1.99)#89 | 2.4%(+2.68)#3,388 |
| 90. | Raritan Borough | 5.0% | 3.1%(+1.95)#90 | 2.4%(+2.65)#3,430 |
| 91. | Dennisville | 5.0% | 3.1%(+1.95)#91 | 2.4%(+2.65)#3,431 |
| 92. | Dividing Creek | 5.0% | 3.1%(+1.93)#92 | 2.4%(+2.63)#3,458 |
| 93. | Heathcote | 5.0% | 3.1%(+1.92)#93 | 2.4%(+2.62)#3,472 |
| 94. | Somerville Borough | 5.0% | 3.1%(+1.91)#94 | 2.4%(+2.61)#3,480 |
| 95. | Franklin Lakes Borough | 5.0% | 3.1%(+1.91)#95 | 2.4%(+2.61)#3,481 |
| 96. | Alpine Borough | 5.0% | 3.1%(+1.90)#96 | 2.4%(+2.60)#3,484 |
| 97. | Norwood Borough | 5.0% | 3.1%(+1.87)#97 | 2.4%(+2.57)#3,529 |
| 98. | Bogota Borough | 5.0% | 3.1%(+1.86)#98 | 2.4%(+2.56)#3,541 |
| 99. | Bernardsville Borough | 4.9% | 3.1%(+1.84)#99 | 2.4%(+2.54)#3,556 |
| 100. | Seaville | 4.9% | 3.1%(+1.83)#100 | 2.4%(+2.53)#3,576 |
Common Questions
What are the Top 10 Cities with the Highest Percentage of Population Employed in Wholesale Trade in New Jersey?
Top 10 Cities with the Highest Percentage of Population Employed in Wholesale Trade in New Jersey are:
#1
20.5%
#2
17.8%
#3
16.7%
#4
16.0%
#5
14.7%
#6
13.5%
#7
11.6%
#8
11.1%
#9
9.6%
#10
9.5%
What city has the Highest Percentage of Population Employed in Wholesale Trade in New Jersey?
Pedricktown has the Highest Percentage of Population Employed in Wholesale Trade in New Jersey with 20.5%.
What is the Percentage of Population Employed in Wholesale Trade in the State of New Jersey?
Percentage of Population Employed in Wholesale Trade in New Jersey is 3.1%.
What is the Percentage of Population Employed in Wholesale Trade in the United States?
Percentage of Population Employed in Wholesale Trade in the United States is 2.4%.