Cities with the Most Births per 1,000 Women Below Poverty Level in New Jersey
RELATED REPORTS & OPTIONS
Highest Birth Rate | Below Poverty
New Jersey
Compare Cities
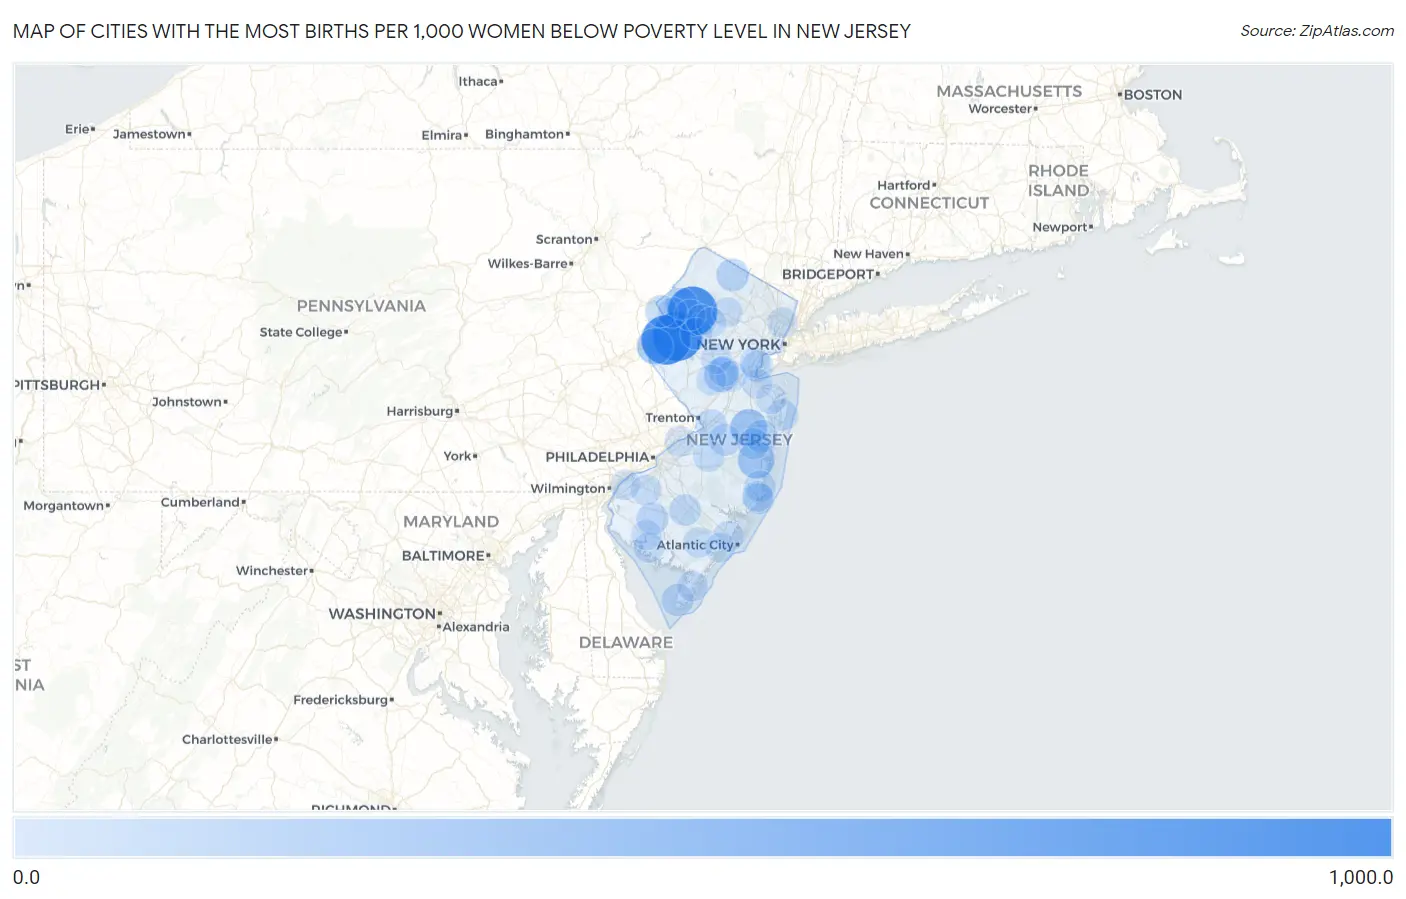
Map of Cities with the Most Births per 1,000 Women Below Poverty Level in New Jersey
0.0
1,000.0
Cities with the Most Births per 1,000 Women Below Poverty Level in New Jersey
| City | Births / 1,000 Women | vs State | vs National | |
| 1. | Port Colden | 1,000.0 | 52.0(+948)#1 | 53.0(+947)#15 |
| 2. | Allamuchy | 1,000.0 | 52.0(+948)#2 | 53.0(+947)#44 |
| 3. | Broadway | 1,000.0 | 52.0(+948)#3 | 53.0(+947)#70 |
| 4. | Holiday Heights | 393.0 | 52.0(+341)#4 | 53.0(+340)#362 |
| 5. | Vista Center | 389.0 | 52.0(+337)#5 | 53.0(+336)#368 |
| 6. | Lopatcong Overlook | 360.0 | 52.0(+308)#6 | 53.0(+307)#421 |
| 7. | Marshallville | 353.0 | 52.0(+301)#7 | 53.0(+300)#442 |
| 8. | East Millstone | 278.0 | 52.0(+226)#8 | 53.0(+225)#735 |
| 9. | Stone Harbor Borough | 257.0 | 52.0(+205)#9 | 53.0(+204)#845 |
| 10. | Arrowhead Lake | 240.0 | 52.0(+188)#10 | 53.0(+187)#964 |
| 11. | South Dennis | 238.0 | 52.0(+186)#11 | 53.0(+185)#969 |
| 12. | New Gretna | 231.0 | 52.0(+179)#12 | 53.0(+178)#1,031 |
| 13. | Highland Lakes | 202.0 | 52.0(+150)#13 | 53.0(+149)#1,304 |
| 14. | Lakewood | 194.0 | 52.0(+142)#14 | 53.0(+141)#1,401 |
| 15. | Cookstown | 194.0 | 52.0(+142)#15 | 53.0(+141)#1,411 |
| 16. | Delmont | 190.0 | 52.0(+138)#16 | 53.0(+137)#1,469 |
| 17. | Palermo | 179.0 | 52.0(+127)#17 | 53.0(+126)#1,630 |
| 18. | Westville Borough | 177.0 | 52.0(+125)#18 | 53.0(+124)#1,659 |
| 19. | Olivet | 176.0 | 52.0(+124)#19 | 53.0(+123)#1,671 |
| 20. | Wharton Borough | 175.0 | 52.0(+123)#20 | 53.0(+122)#1,685 |
| 21. | Rutgers University-Busch Campus | 175.0 | 52.0(+123)#21 | 53.0(+122)#1,686 |
| 22. | North Cape May | 175.0 | 52.0(+123)#22 | 53.0(+122)#1,687 |
| 23. | Marksboro | 174.0 | 52.0(+122)#23 | 53.0(+121)#1,725 |
| 24. | Columbia | 171.0 | 52.0(+119)#24 | 53.0(+118)#1,787 |
| 25. | Sweetwater | 158.0 | 52.0(+106)#25 | 53.0(+105)#2,060 |
| 26. | New Egypt | 156.0 | 52.0(+104)#26 | 53.0(+103)#2,107 |
| 27. | Collings Lakes | 155.0 | 52.0(+103)#27 | 53.0(+102)#2,135 |
| 28. | Long Valley | 153.0 | 52.0(+101)#28 | 53.0(+100.0)#2,195 |
| 29. | Caldwell Borough | 151.0 | 52.0(+99.0)#29 | 53.0(+98.0)#2,243 |
| 30. | West Wildwood Borough | 150.0 | 52.0(+98.0)#30 | 53.0(+97.0)#2,282 |
| 31. | Groveville | 147.0 | 52.0(+95.0)#31 | 53.0(+94.0)#2,364 |
| 32. | Cedar Glen West | 146.0 | 52.0(+94.0)#32 | 53.0(+93.0)#2,393 |
| 33. | Barnegat | 145.0 | 52.0(+93.0)#33 | 53.0(+92.0)#2,426 |
| 34. | Shrewsbury Borough | 143.0 | 52.0(+91.0)#34 | 53.0(+90.0)#2,493 |
| 35. | Wanamassa | 142.0 | 52.0(+90.0)#35 | 53.0(+89.0)#2,563 |
| 36. | Port Reading | 139.0 | 52.0(+87.0)#36 | 53.0(+86.0)#2,661 |
| 37. | Roseland Borough | 137.0 | 52.0(+85.0)#37 | 53.0(+84.0)#2,714 |
| 38. | North Arlington Borough | 136.0 | 52.0(+84.0)#38 | 53.0(+83.0)#2,744 |
| 39. | Mountainside Borough | 136.0 | 52.0(+84.0)#39 | 53.0(+83.0)#2,747 |
| 40. | Pemberton Heights | 134.0 | 52.0(+82.0)#40 | 53.0(+81.0)#2,816 |
| 41. | South River Borough | 130.0 | 52.0(+78.0)#41 | 53.0(+77.0)#2,984 |
| 42. | Beach Haven West | 129.0 | 52.0(+77.0)#42 | 53.0(+76.0)#3,038 |
| 43. | Roosevelt Borough | 129.0 | 52.0(+77.0)#43 | 53.0(+76.0)#3,052 |
| 44. | Chester Borough | 128.0 | 52.0(+76.0)#44 | 53.0(+75.0)#3,092 |
| 45. | Mount Royal | 126.0 | 52.0(+74.0)#45 | 53.0(+73.0)#3,181 |
| 46. | Panther Valley | 125.0 | 52.0(+73.0)#46 | 53.0(+72.0)#3,204 |
| 47. | Silver Lake Cdp Warren County | 125.0 | 52.0(+73.0)#47 | 53.0(+72.0)#3,227 |
| 48. | Stirling | 121.0 | 52.0(+69.0)#48 | 53.0(+68.0)#3,405 |
| 49. | Tuckerton Borough | 120.0 | 52.0(+68.0)#49 | 53.0(+67.0)#3,449 |
| 50. | Beverly | 120.0 | 52.0(+68.0)#50 | 53.0(+67.0)#3,458 |
| 51. | Interlaken Borough | 119.0 | 52.0(+67.0)#51 | 53.0(+66.0)#3,536 |
| 52. | Budd Lake | 118.0 | 52.0(+66.0)#52 | 53.0(+65.0)#3,558 |
| 53. | Mendham Borough | 118.0 | 52.0(+66.0)#53 | 53.0(+65.0)#3,568 |
| 54. | Audubon Park Borough | 118.0 | 52.0(+66.0)#54 | 53.0(+65.0)#3,589 |
| 55. | Centre Grove | 116.0 | 52.0(+64.0)#55 | 53.0(+63.0)#3,696 |
| 56. | Runnemede Borough | 114.0 | 52.0(+62.0)#56 | 53.0(+61.0)#3,797 |
| 57. | Cape May Court House | 114.0 | 52.0(+62.0)#57 | 53.0(+61.0)#3,801 |
| 58. | East Franklin | 113.0 | 52.0(+61.0)#58 | 53.0(+60.0)#3,854 |
| 59. | Estell Manor | 113.0 | 52.0(+61.0)#59 | 53.0(+60.0)#3,869 |
| 60. | Mullica Hill | 112.0 | 52.0(+60.0)#60 | 53.0(+59.0)#3,915 |
| 61. | Manahawkin | 112.0 | 52.0(+60.0)#61 | 53.0(+59.0)#3,932 |
| 62. | Matawan Borough | 111.0 | 52.0(+59.0)#62 | 53.0(+58.0)#3,964 |
| 63. | Absecon | 111.0 | 52.0(+59.0)#63 | 53.0(+58.0)#3,965 |
| 64. | Hopewell Borough | 109.0 | 52.0(+57.0)#64 | 53.0(+56.0)#4,138 |
| 65. | Lebanon Borough | 107.0 | 52.0(+55.0)#65 | 53.0(+54.0)#4,251 |
| 66. | Flemington Borough | 106.0 | 52.0(+54.0)#66 | 53.0(+53.0)#4,308 |
| 67. | Clementon Borough | 104.0 | 52.0(+52.0)#67 | 53.0(+51.0)#4,438 |
| 68. | Upper Saddle River Borough | 103.0 | 52.0(+51.0)#68 | 53.0(+50.0)#4,496 |
| 69. | Green Knoll | 103.0 | 52.0(+51.0)#69 | 53.0(+50.0)#4,497 |
| 70. | Garwood Borough | 103.0 | 52.0(+51.0)#70 | 53.0(+50.0)#4,502 |
| 71. | Mckee | 102.0 | 52.0(+50.0)#71 | 53.0(+49.0)#4,573 |
| 72. | Cedarville | 102.0 | 52.0(+50.0)#72 | 53.0(+49.0)#4,629 |
| 73. | Ridgefield Park | 101.0 | 52.0(+49.0)#73 | 53.0(+48.0)#4,650 |
| 74. | Franklin Center | 100.0 | 52.0(+48.0)#74 | 53.0(+47.0)#4,738 |
| 75. | Gouldtown | 98.0 | 52.0(+46.0)#75 | 53.0(+45.0)#4,926 |
| 76. | White Meadow Lake | 97.0 | 52.0(+45.0)#76 | 53.0(+44.0)#4,982 |
| 77. | Avenel | 96.0 | 52.0(+44.0)#77 | 53.0(+43.0)#5,066 |
| 78. | Milltown Borough | 96.0 | 52.0(+44.0)#78 | 53.0(+43.0)#5,079 |
| 79. | Belle Mead | 96.0 | 52.0(+44.0)#79 | 53.0(+43.0)#5,081 |
| 80. | Penns Grove Borough | 96.0 | 52.0(+44.0)#80 | 53.0(+43.0)#5,087 |
| 81. | Lincroft | 95.0 | 52.0(+43.0)#81 | 53.0(+42.0)#5,184 |
| 82. | English Creek | 95.0 | 52.0(+43.0)#82 | 53.0(+42.0)#5,208 |
| 83. | Mount Hermon | 95.0 | 52.0(+43.0)#83 | 53.0(+42.0)#5,257 |
| 84. | Hampton Borough | 94.0 | 52.0(+42.0)#84 | 53.0(+41.0)#5,312 |
| 85. | Bridgeton | 93.0 | 52.0(+41.0)#85 | 53.0(+40.0)#5,344 |
| 86. | Oceanport Borough | 92.0 | 52.0(+40.0)#86 | 53.0(+39.0)#5,459 |
| 87. | Pedricktown | 92.0 | 52.0(+40.0)#87 | 53.0(+39.0)#5,519 |
| 88. | Tinton Falls Borough | 90.0 | 52.0(+38.0)#88 | 53.0(+37.0)#5,625 |
| 89. | Peapack And Gladstone Borough | 88.0 | 52.0(+36.0)#89 | 53.0(+35.0)#5,853 |
| 90. | Succasunna | 87.0 | 52.0(+35.0)#90 | 53.0(+34.0)#5,929 |
| 91. | Pine Brook | 86.0 | 52.0(+34.0)#91 | 53.0(+33.0)#6,042 |
| 92. | Netcong Borough | 86.0 | 52.0(+34.0)#92 | 53.0(+33.0)#6,054 |
| 93. | New Milford Borough | 85.0 | 52.0(+33.0)#93 | 53.0(+32.0)#6,119 |
| 94. | Bellmawr Borough | 85.0 | 52.0(+33.0)#94 | 53.0(+32.0)#6,125 |
| 95. | Linwood | 85.0 | 52.0(+33.0)#95 | 53.0(+32.0)#6,134 |
| 96. | Laurence Harbor | 84.0 | 52.0(+32.0)#96 | 53.0(+31.0)#6,232 |
| 97. | Somerdale Borough | 84.0 | 52.0(+32.0)#97 | 53.0(+31.0)#6,237 |
| 98. | Surf City Borough | 84.0 | 52.0(+32.0)#98 | 53.0(+31.0)#6,283 |
| 99. | Fort Lee Borough | 82.0 | 52.0(+30.0)#99 | 53.0(+29.0)#6,462 |
| 100. | Elmwood Park Borough | 82.0 | 52.0(+30.0)#100 | 53.0(+29.0)#6,470 |
Common Questions
What are the Top 10 Cities with the Most Births per 1,000 Women Below Poverty Level in New Jersey?
Top 10 Cities with the Most Births per 1,000 Women Below Poverty Level in New Jersey are:
#1
1,000.0
#2
1,000.0
#3
1,000.0
#4
393.0
#5
389.0
#6
360.0
#7
278.0
#8
202.0
#9
194.0
#10
176.0
What city has the Most Births per 1,000 Women Below Poverty Level in New Jersey?
Port Colden has the Most Births per 1,000 Women Below Poverty Level in New Jersey with 1,000.0.
What is the Number of Births per 1,000 Women Below Poverty Level in the State of New Jersey?
Number of Births per 1,000 Women Below Poverty Level in New Jersey is 52.0.
What is the Number of Births per 1,000 Women Below Poverty Level in the United States?
Number of Births per 1,000 Women Below Poverty Level in the United States is 53.0.