Zip Codes with the Highest Percentage of Population Employed in Life, Physical & Social Science in Princeton, NJ
RELATED REPORTS & OPTIONS
Life, Physical & Social Science
Princeton
Compare Zip Codes
Map of Zip Codes with the Highest Percentage of Population Employed in Life, Physical & Social Science in Princeton
4.5%
7.6%
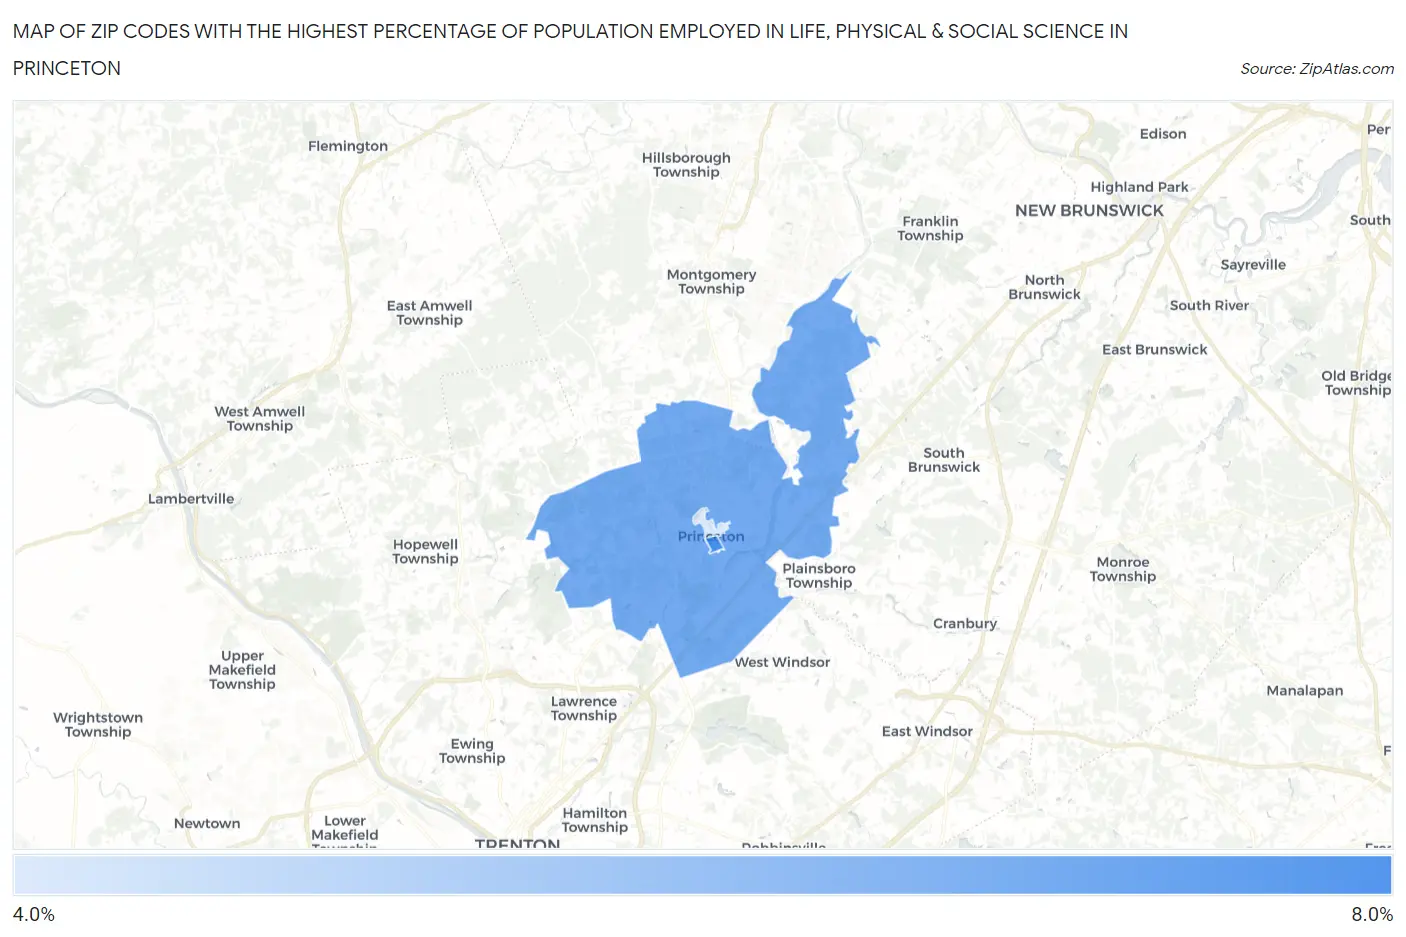
Zip Codes with the Highest Percentage of Population Employed in Life, Physical & Social Science in Princeton, NJ
| Zip Code | % Employed | vs State | vs National | |
| 1. | 08544 | 7.6% | 1.3%(+6.36)#3 | 1.1%(+6.52)#355 |
| 2. | 08540 | 6.7% | 1.3%(+5.44)#4 | 1.1%(+5.61)#443 |
| 3. | 08542 | 4.5% | 1.3%(+3.23)#14 | 1.1%(+3.39)#934 |
1
Common Questions
What are the Top Zip Codes with the Highest Percentage of Population Employed in Life, Physical & Social Science in Princeton, NJ?
Top Zip Codes with the Highest Percentage of Population Employed in Life, Physical & Social Science in Princeton, NJ are:
What zip code has the Highest Percentage of Population Employed in Life, Physical & Social Science in Princeton, NJ?
08544 has the Highest Percentage of Population Employed in Life, Physical & Social Science in Princeton, NJ with 7.6%.
What is the Percentage of Population Employed in Life, Physical & Social Science in Princeton, NJ?
Percentage of Population Employed in Life, Physical & Social Science in Princeton is 8.0%.
What is the Percentage of Population Employed in Life, Physical & Social Science in New Jersey?
Percentage of Population Employed in Life, Physical & Social Science in New Jersey is 1.3%.
What is the Percentage of Population Employed in Life, Physical & Social Science in the United States?
Percentage of Population Employed in Life, Physical & Social Science in the United States is 1.1%.