Cities with the Lowest Poverty Level Among Single Fathers in New Jersey
RELATED REPORTS & OPTIONS
Lowest Poverty | Single Father
New Jersey
Compare Cities
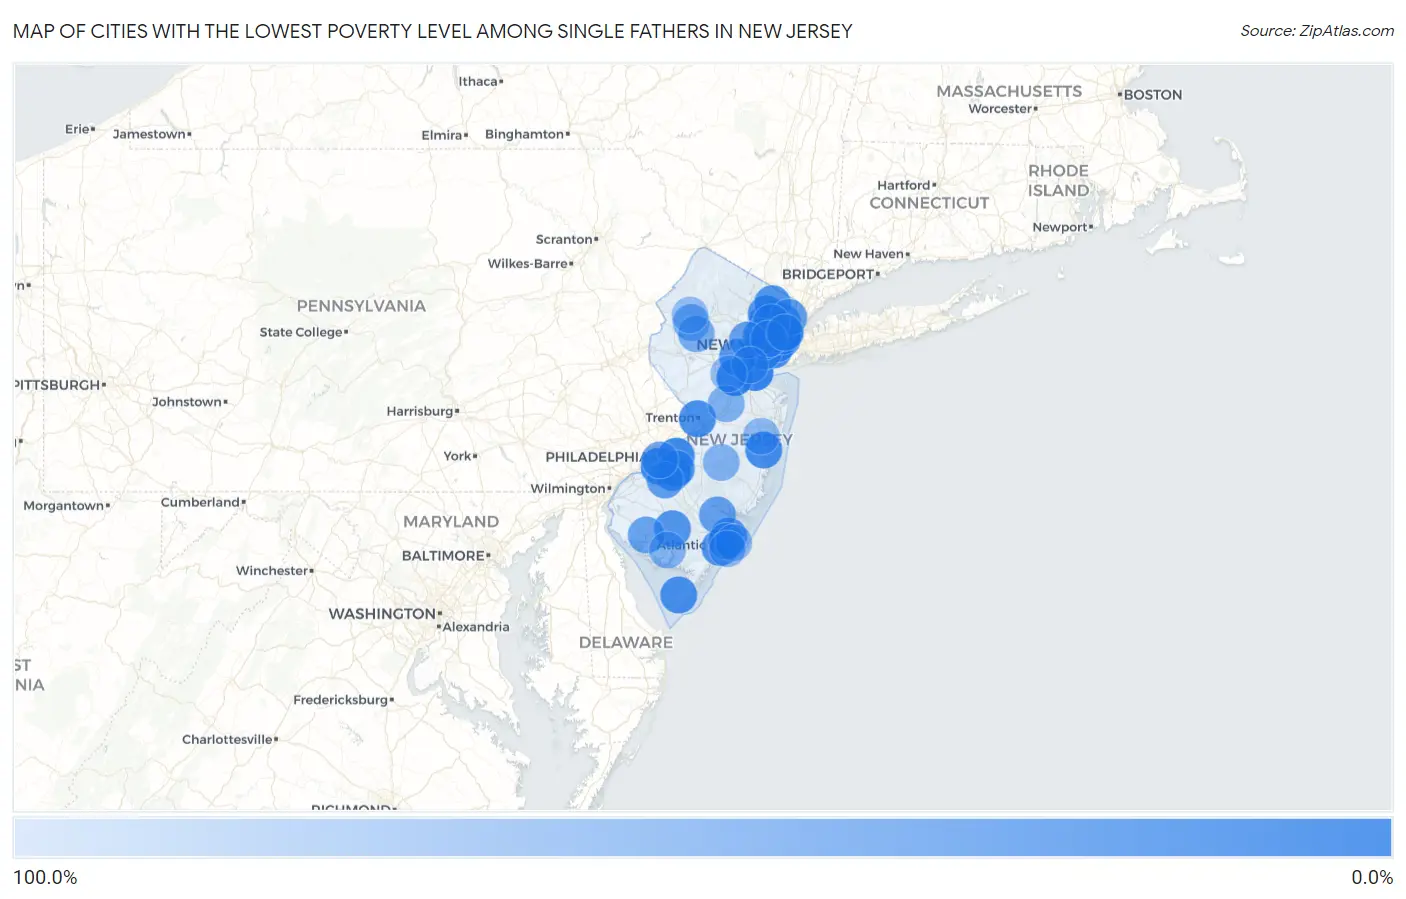
Map of Cities with the Lowest Poverty Level Among Single Fathers in New Jersey
100.0%
0.0%
Cities with the Lowest Poverty Level Among Single Fathers in New Jersey
| City | Single Father Poverty | vs State | vs National | |
| 1. | Perth Amboy | 1.2% | 11.7%(-10.5)#1 | 13.7%(-12.5)#25 |
| 2. | New Brunswick | 1.3% | 11.7%(-10.5)#2 | 13.7%(-12.5)#27 |
| 3. | West New York | 3.4% | 11.7%(-8.33)#3 | 13.7%(-10.3)#235 |
| 4. | Fort Lee Borough | 4.3% | 11.7%(-7.45)#4 | 13.7%(-9.45)#337 |
| 5. | Gloucester City | 5.0% | 11.7%(-6.74)#5 | 13.7%(-8.74)#438 |
| 6. | Lindenwold Borough | 5.7% | 11.7%(-5.97)#6 | 13.7%(-7.97)#538 |
| 7. | Sayreville Borough | 6.1% | 11.7%(-5.57)#7 | 13.7%(-7.57)#591 |
| 8. | Moorestown Lenola | 6.2% | 11.7%(-5.54)#8 | 13.7%(-7.54)#597 |
| 9. | Hawthorne Borough | 6.4% | 11.7%(-5.34)#9 | 13.7%(-7.34)#627 |
| 10. | Hoboken | 8.1% | 11.7%(-3.59)#10 | 13.7%(-5.59)#923 |
| 11. | Rutherford Borough | 8.2% | 11.7%(-3.53)#11 | 13.7%(-5.53)#930 |
| 12. | Toms River | 9.1% | 11.7%(-2.57)#12 | 13.7%(-4.57)#1,095 |
| 13. | Point Pleasant Borough | 10.4% | 11.7%(-1.35)#13 | 13.7%(-3.35)#1,280 |
| 14. | Bayonne | 10.9% | 11.7%(-0.854)#14 | 13.7%(-2.85)#1,362 |
| 15. | Stanhope Borough | 10.9% | 11.7%(-0.843)#15 | 13.7%(-2.84)#1,366 |
| 16. | Villas | 11.5% | 11.7%(-0.237)#16 | 13.7%(-2.24)#1,461 |
| 17. | Pompton Lakes Borough | 11.7% | 11.7%(-0.001)#17 | 13.7%(-2.00)#1,491 |
| 18. | Trenton | 11.8% | 11.7%(+0.131)#18 | 13.7%(-1.87)#1,513 |
| 19. | Absecon | 12.0% | 11.7%(+0.313)#19 | 13.7%(-1.69)#1,543 |
| 20. | Manville Borough | 12.1% | 11.7%(+0.409)#20 | 13.7%(-1.59)#1,555 |
| 21. | Parsippany | 12.2% | 11.7%(+0.461)#21 | 13.7%(-1.54)#1,563 |
| 22. | Leonia Borough | 12.5% | 11.7%(+0.788)#22 | 13.7%(-1.21)#1,614 |
| 23. | Kearny | 12.7% | 11.7%(+0.986)#23 | 13.7%(-1.01)#1,664 |
| 24. | Woodland Park Borough | 12.8% | 11.7%(+1.04)#24 | 13.7%(-0.961)#1,666 |
| 25. | Ridgefield Park | 12.9% | 11.7%(+1.21)#25 | 13.7%(-0.787)#1,687 |
| 26. | Red Bank Borough | 13.8% | 11.7%(+2.12)#26 | 13.7%(+0.122)#1,839 |
| 27. | Echelon | 14.1% | 11.7%(+2.42)#27 | 13.7%(+0.418)#1,876 |
| 28. | Jersey City | 14.3% | 11.7%(+2.54)#28 | 13.7%(+0.542)#1,888 |
| 29. | Linwood | 14.3% | 11.7%(+2.57)#29 | 13.7%(+0.573)#1,897 |
| 30. | Clifton | 14.3% | 11.7%(+2.59)#30 | 13.7%(+0.592)#1,933 |
| 31. | Elizabeth | 14.4% | 11.7%(+2.73)#31 | 13.7%(+0.732)#1,940 |
| 32. | Union City | 14.5% | 11.7%(+2.77)#32 | 13.7%(+0.773)#1,948 |
| 33. | Springdale | 14.9% | 11.7%(+3.21)#33 | 13.7%(+1.21)#2,000 |
| 34. | Gouldtown | 15.0% | 11.7%(+3.29)#34 | 13.7%(+1.29)#2,014 |
| 35. | Hillsborough | 15.4% | 11.7%(+3.67)#35 | 13.7%(+1.67)#2,063 |
| 36. | Upper Saddle River Borough | 15.4% | 11.7%(+3.67)#36 | 13.7%(+1.67)#2,064 |
| 37. | Garfield | 16.8% | 11.7%(+5.06)#37 | 13.7%(+3.06)#2,299 |
| 38. | Paterson | 16.9% | 11.7%(+5.14)#38 | 13.7%(+3.14)#2,307 |
| 39. | Woodlynne Borough | 17.2% | 11.7%(+5.48)#39 | 13.7%(+3.48)#2,342 |
| 40. | Bound Brook Borough | 17.3% | 11.7%(+5.60)#40 | 13.7%(+3.60)#2,354 |
| 41. | Vineland | 17.7% | 11.7%(+5.96)#41 | 13.7%(+3.96)#2,408 |
| 42. | Lake Hopatcong | 17.7% | 11.7%(+5.97)#42 | 13.7%(+3.97)#2,409 |
| 43. | Ridgewood | 18.4% | 11.7%(+6.65)#43 | 13.7%(+4.65)#2,499 |
| 44. | Freehold Borough | 19.3% | 11.7%(+7.61)#44 | 13.7%(+5.61)#2,620 |
| 45. | Plainfield | 19.5% | 11.7%(+7.75)#45 | 13.7%(+5.75)#2,633 |
| 46. | Newark | 19.5% | 11.7%(+7.78)#46 | 13.7%(+5.78)#2,639 |
| 47. | East Orange | 20.3% | 11.7%(+8.59)#47 | 13.7%(+6.59)#2,778 |
| 48. | Fieldsboro Borough | 21.7% | 11.7%(+10.0)#48 | 13.7%(+8.03)#2,956 |
| 49. | Fair Lawn Borough | 23.4% | 11.7%(+11.7)#49 | 13.7%(+9.73)#3,146 |
| 50. | Englewood | 23.7% | 11.7%(+11.9)#50 | 13.7%(+9.94)#3,167 |
| 51. | South Bound Brook Borough | 23.7% | 11.7%(+12.0)#51 | 13.7%(+9.97)#3,173 |
| 52. | Sicklerville | 24.1% | 11.7%(+12.4)#52 | 13.7%(+10.4)#3,204 |
| 53. | Passaic | 25.0% | 11.7%(+13.2)#53 | 13.7%(+11.2)#3,258 |
| 54. | Carteret Borough | 25.0% | 11.7%(+13.3)#54 | 13.7%(+11.3)#3,260 |
| 55. | Edgewater Borough | 26.3% | 11.7%(+14.6)#55 | 13.7%(+12.6)#3,428 |
| 56. | Fairview Borough | 27.0% | 11.7%(+15.3)#56 | 13.7%(+13.3)#3,494 |
| 57. | Blackwood | 27.6% | 11.7%(+15.9)#57 | 13.7%(+13.9)#3,544 |
| 58. | Short Hills | 29.6% | 11.7%(+17.9)#58 | 13.7%(+15.9)#3,718 |
| 59. | Bogota Borough | 30.5% | 11.7%(+18.7)#59 | 13.7%(+16.7)#3,807 |
| 60. | Egg Harbor City | 30.8% | 11.7%(+19.1)#60 | 13.7%(+17.1)#3,828 |
| 61. | Harrison | 31.5% | 11.7%(+19.8)#61 | 13.7%(+17.8)#3,890 |
| 62. | Brooklawn Borough | 32.1% | 11.7%(+20.4)#62 | 13.7%(+18.4)#3,942 |
| 63. | Bridgeton | 33.4% | 11.7%(+21.7)#63 | 13.7%(+19.7)#4,128 |
| 64. | Camden | 33.7% | 11.7%(+22.0)#64 | 13.7%(+20.0)#4,137 |
| 65. | Laurel Springs Borough | 34.8% | 11.7%(+23.1)#65 | 13.7%(+21.1)#4,209 |
| 66. | Pleasantville | 36.0% | 11.7%(+24.3)#66 | 13.7%(+22.3)#4,304 |
| 67. | Neptune City Borough | 38.0% | 11.7%(+26.3)#67 | 13.7%(+24.3)#4,445 |
| 68. | Troy Hills | 38.1% | 11.7%(+26.4)#68 | 13.7%(+24.4)#4,447 |
| 69. | Ringwood Borough | 38.2% | 11.7%(+26.5)#69 | 13.7%(+24.5)#4,459 |
| 70. | Iselin | 38.8% | 11.7%(+27.1)#70 | 13.7%(+25.1)#4,486 |
| 71. | Millstone Borough | 40.0% | 11.7%(+28.3)#71 | 13.7%(+26.3)#4,589 |
| 72. | Wallington Borough | 40.3% | 11.7%(+28.6)#72 | 13.7%(+26.6)#4,619 |
| 73. | Hasbrouck Heights Borough | 41.8% | 11.7%(+30.1)#73 | 13.7%(+28.1)#4,688 |
| 74. | Hackettstown | 42.0% | 11.7%(+30.3)#74 | 13.7%(+28.3)#4,702 |
| 75. | Guttenberg | 42.4% | 11.7%(+30.6)#75 | 13.7%(+28.6)#4,724 |
| 76. | Long Valley | 42.9% | 11.7%(+31.1)#76 | 13.7%(+29.1)#4,744 |
| 77. | Bellmawr Borough | 43.1% | 11.7%(+31.4)#77 | 13.7%(+29.4)#4,771 |
| 78. | Caldwell Borough | 43.6% | 11.7%(+31.9)#78 | 13.7%(+29.9)#4,797 |
| 79. | Cranbury | 46.2% | 11.7%(+34.4)#79 | 13.7%(+32.4)#4,912 |
| 80. | Hamburg Borough | 47.7% | 11.7%(+36.0)#80 | 13.7%(+34.0)#4,981 |
| 81. | Laurel Lake | 49.1% | 11.7%(+37.4)#81 | 13.7%(+35.4)#5,029 |
| 82. | Presidential Lakes Estates | 49.3% | 11.7%(+37.6)#82 | 13.7%(+35.6)#5,037 |
| 83. | South Toms River Borough | 51.3% | 11.7%(+39.6)#83 | 13.7%(+37.6)#5,256 |
| 84. | Woodbine Borough | 52.2% | 11.7%(+40.5)#84 | 13.7%(+38.5)#5,287 |
| 85. | West Park | 52.2% | 11.7%(+40.5)#85 | 13.7%(+38.5)#5,289 |
| 86. | Atlantic City | 52.4% | 11.7%(+40.7)#86 | 13.7%(+38.7)#5,293 |
| 87. | Keansburg Borough | 53.9% | 11.7%(+42.2)#87 | 13.7%(+40.2)#5,367 |
| 88. | Sussex Borough | 54.5% | 11.7%(+42.8)#88 | 13.7%(+40.8)#5,386 |
| 89. | Hampton Borough | 54.5% | 11.7%(+42.8)#89 | 13.7%(+40.8)#5,390 |
| 90. | Lakewood | 55.6% | 11.7%(+43.9)#90 | 13.7%(+41.9)#5,443 |
| 91. | Margate City | 56.2% | 11.7%(+44.5)#91 | 13.7%(+42.5)#5,457 |
| 92. | Collingswood Borough | 56.5% | 11.7%(+44.8)#92 | 13.7%(+42.8)#5,463 |
| 93. | Netcong Borough | 61.5% | 11.7%(+49.8)#93 | 13.7%(+47.8)#5,678 |
| 94. | Somerset | 61.8% | 11.7%(+50.1)#94 | 13.7%(+48.1)#5,690 |
| 95. | Panther Valley | 62.1% | 11.7%(+50.4)#95 | 13.7%(+48.4)#5,700 |
| 96. | Atco | 63.4% | 11.7%(+51.7)#96 | 13.7%(+49.7)#5,735 |
| 97. | Tenafly Borough | 66.1% | 11.7%(+54.3)#97 | 13.7%(+52.3)#5,800 |
| 98. | Rockaway Borough | 67.9% | 11.7%(+56.1)#98 | 13.7%(+54.1)#5,897 |
| 99. | Carlstadt Borough | 73.7% | 11.7%(+62.0)#99 | 13.7%(+60.0)#6,054 |
| 100. | Basking Ridge | 81.6% | 11.7%(+69.9)#100 | 13.7%(+67.9)#6,208 |
Common Questions
What are the Top 10 Cities with the Lowest Poverty Level Among Single Fathers in New Jersey?
Top 10 Cities with the Lowest Poverty Level Among Single Fathers in New Jersey are:
#1
1.2%
#2
1.3%
#3
3.4%
#4
5.0%
#5
6.2%
#6
8.1%
#7
9.1%
#8
10.9%
#9
11.5%
#10
11.8%
What city has the Lowest Poverty Level Among Single Fathers in New Jersey?
Perth Amboy has the Lowest Poverty Level Among Single Fathers in New Jersey with 1.2%.
What is the Poverty Level Among Single Fathers in the State of New Jersey?
Poverty Level Among Single Fathers in New Jersey is 11.7%.
What is the Poverty Level Among Single Fathers in the United States?
Poverty Level Among Single Fathers in the United States is 13.7%.