Cities with the Oldest Population in New Jersey
RELATED REPORTS & OPTIONS
Oldest Population
New Jersey
Compare Cities
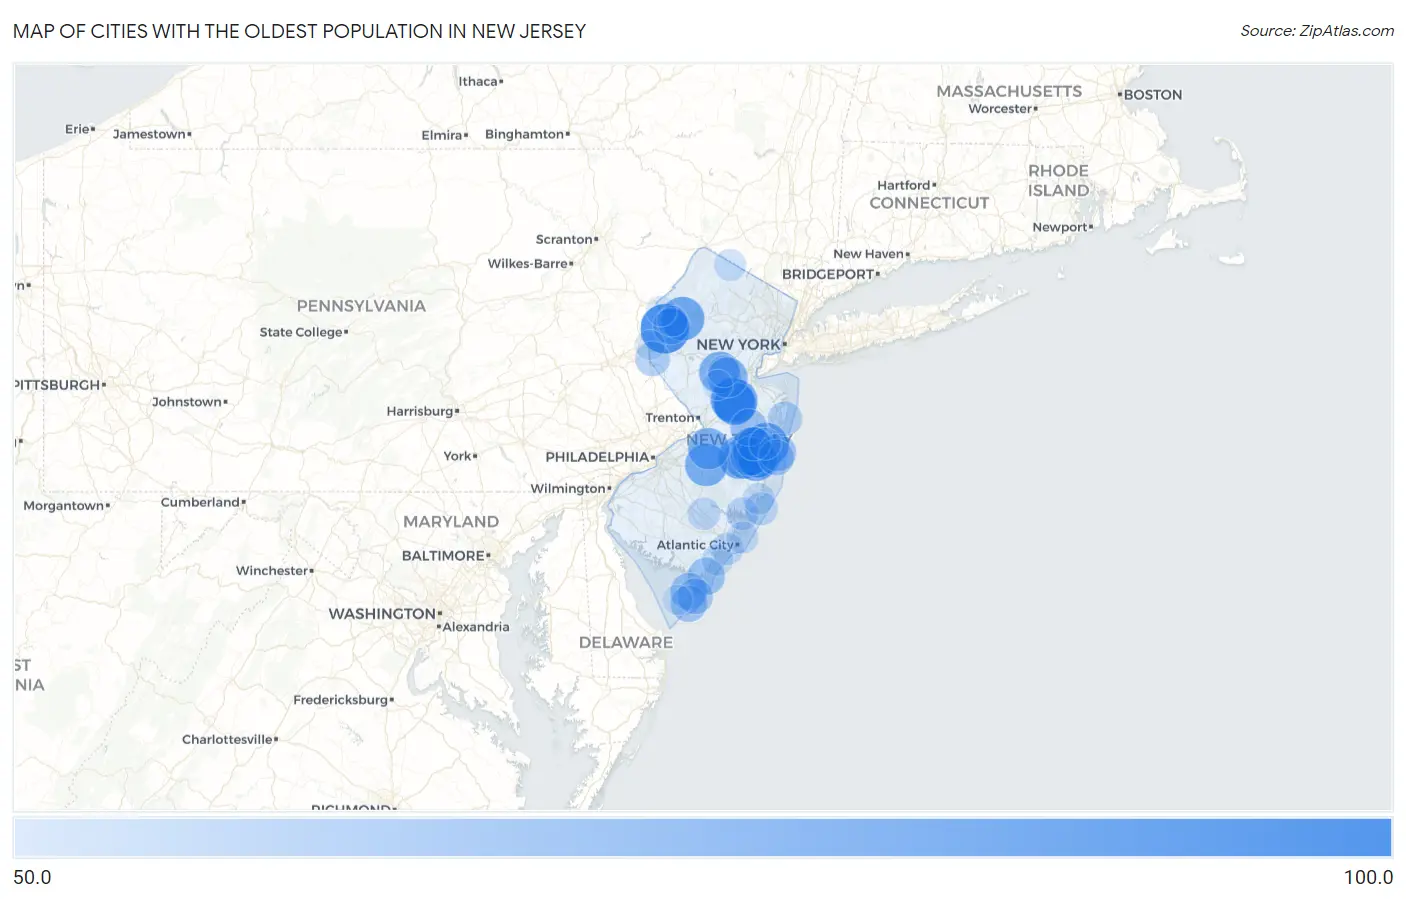
Map of Cities with the Oldest Population in New Jersey
0.0
100.0
Cities with the Oldest Population in New Jersey
| City | Median Age | vs State | vs National | |
| 1. | Brookfield | 82.5 | 40.0(+42.5)#1 | 38.5(+44.0)#29 |
| 2. | Deerfield Street | 78.2 | 40.0(+38.2)#2 | 38.5(+39.7)#65 |
| 3. | Whittingham | 76.0 | 40.0(+36.0)#3 | 38.5(+37.5)#110 |
| 4. | Encore At Monroe | 75.7 | 40.0(+35.7)#4 | 38.5(+37.2)#116 |
| 5. | Tavistock Borough | 75.3 | 40.0(+35.3)#5 | 38.5(+36.8)#132 |
| 6. | Leisure Village East | 74.9 | 40.0(+34.9)#6 | 38.5(+36.4)#143 |
| 7. | Rossmoor | 74.5 | 40.0(+34.5)#7 | 38.5(+36.0)#159 |
| 8. | Silver Ridge | 74.3 | 40.0(+34.3)#8 | 38.5(+35.8)#171 |
| 9. | Great Meadows | 74.2 | 40.0(+34.2)#9 | 38.5(+35.7)#176 |
| 10. | Cedar Glen Lakes | 73.1 | 40.0(+33.1)#10 | 38.5(+34.6)#215 |
| 11. | Renaissance At Monroe | 72.9 | 40.0(+32.9)#11 | 38.5(+34.4)#219 |
| 12. | The Ponds | 72.8 | 40.0(+32.8)#12 | 38.5(+34.3)#224 |
| 13. | Clearbrook | 72.6 | 40.0(+32.6)#13 | 38.5(+34.1)#232 |
| 14. | Leisure Village West | 72.5 | 40.0(+32.5)#14 | 38.5(+34.0)#239 |
| 15. | Concordia | 72.4 | 40.0(+32.4)#15 | 38.5(+33.9)#243 |
| 16. | Crestwood Village | 72.3 | 40.0(+32.3)#16 | 38.5(+33.8)#249 |
| 17. | Leisuretowne | 72.3 | 40.0(+32.3)#17 | 38.5(+33.8)#250 |
| 18. | Stonebridge | 72.2 | 40.0(+32.2)#18 | 38.5(+33.7)#255 |
| 19. | Holiday Heights | 71.9 | 40.0(+31.9)#19 | 38.5(+33.4)#271 |
| 20. | Seeley | 71.9 | 40.0(+31.9)#20 | 38.5(+33.4)#272 |
| 21. | Regency At Monroe | 71.8 | 40.0(+31.8)#21 | 38.5(+33.3)#275 |
| 22. | Weston | 71.5 | 40.0(+31.5)#22 | 38.5(+33.0)#289 |
| 23. | Cape May Point Borough | 71.3 | 40.0(+31.3)#23 | 38.5(+32.8)#311 |
| 24. | Leisure Knoll | 70.7 | 40.0(+30.7)#24 | 38.5(+32.2)#354 |
| 25. | Juliustown | 70.7 | 40.0(+30.7)#25 | 38.5(+32.2)#360 |
| 26. | Holiday City Berkeley | 70.2 | 40.0(+30.2)#26 | 38.5(+31.7)#396 |
| 27. | Clyde | 69.5 | 40.0(+29.5)#27 | 38.5(+31.0)#451 |
| 28. | Money Island | 69.3 | 40.0(+29.3)#28 | 38.5(+30.8)#485 |
| 29. | Holiday City South | 69.2 | 40.0(+29.2)#29 | 38.5(+30.7)#487 |
| 30. | Rockleigh Borough | 68.5 | 40.0(+28.5)#30 | 38.5(+30.0)#545 |
| 31. | Pine Ridge At Crestwood | 67.6 | 40.0(+27.6)#31 | 38.5(+29.1)#634 |
| 32. | Dorchester | 66.6 | 40.0(+26.6)#32 | 38.5(+28.1)#775 |
| 33. | Longport Borough | 66.4 | 40.0(+26.4)#33 | 38.5(+27.9)#817 |
| 34. | Avalon Borough | 65.9 | 40.0(+25.9)#34 | 38.5(+27.4)#895 |
| 35. | Neshanic | 65.9 | 40.0(+25.9)#35 | 38.5(+27.4)#897 |
| 36. | Gandys Beach | 65.8 | 40.0(+25.8)#36 | 38.5(+27.3)#908 |
| 37. | Stone Harbor Borough | 65.7 | 40.0(+25.7)#37 | 38.5(+27.2)#911 |
| 38. | Dutch Neck | 65.4 | 40.0(+25.4)#38 | 38.5(+26.9)#968 |
| 39. | Sea Isle City | 65.1 | 40.0(+25.1)#39 | 38.5(+26.6)#1,021 |
| 40. | Mauricetown | 65.0 | 40.0(+25.0)#40 | 38.5(+26.5)#1,046 |
| 41. | Othello | 65.0 | 40.0(+25.0)#41 | 38.5(+26.5)#1,056 |
| 42. | Dover Beaches North | 64.9 | 40.0(+24.9)#42 | 38.5(+26.4)#1,063 |
| 43. | Vista Center | 64.7 | 40.0(+24.7)#43 | 38.5(+26.2)#1,089 |
| 44. | Fortescue | 64.7 | 40.0(+24.7)#44 | 38.5(+26.2)#1,100 |
| 45. | Burleigh | 64.3 | 40.0(+24.3)#45 | 38.5(+25.8)#1,158 |
| 46. | Diamond Beach | 63.9 | 40.0(+23.9)#46 | 38.5(+25.4)#1,240 |
| 47. | Buttzville | 63.9 | 40.0(+23.9)#47 | 38.5(+25.4)#1,246 |
| 48. | West Wildwood Borough | 63.2 | 40.0(+23.2)#48 | 38.5(+24.7)#1,390 |
| 49. | Ship Bottom Borough | 63.1 | 40.0(+23.1)#49 | 38.5(+24.6)#1,416 |
| 50. | Wildwood Crest Borough | 63.0 | 40.0(+23.0)#50 | 38.5(+24.5)#1,439 |
| 51. | North Wildwood | 62.9 | 40.0(+22.9)#51 | 38.5(+24.4)#1,463 |
| 52. | Dover Beaches South | 62.8 | 40.0(+22.8)#52 | 38.5(+24.3)#1,482 |
| 53. | Surf City Borough | 62.8 | 40.0(+22.8)#53 | 38.5(+24.3)#1,483 |
| 54. | Titusville | 62.0 | 40.0(+22.0)#54 | 38.5(+23.5)#1,660 |
| 55. | Harvey Cedars Borough | 62.0 | 40.0(+22.0)#55 | 38.5(+23.5)#1,663 |
| 56. | Finesville | 61.6 | 40.0(+21.6)#56 | 38.5(+23.1)#1,761 |
| 57. | Lavallette Borough | 61.5 | 40.0(+21.5)#57 | 38.5(+23.0)#1,777 |
| 58. | Ocean Grove | 61.0 | 40.0(+21.0)#58 | 38.5(+22.5)#1,923 |
| 59. | Barnegat Light Borough | 60.9 | 40.0(+20.9)#59 | 38.5(+22.4)#1,956 |
| 60. | Cologne | 60.5 | 40.0(+20.5)#60 | 38.5(+22.0)#2,042 |
| 61. | West Cape May Borough | 60.3 | 40.0(+20.3)#61 | 38.5(+21.8)#2,124 |
| 62. | Mount Hope | 60.1 | 40.0(+20.1)#62 | 38.5(+21.6)#2,198 |
| 63. | Cedar Glen West | 59.6 | 40.0(+19.6)#63 | 38.5(+21.1)#2,339 |
| 64. | Seaside Park Borough | 59.5 | 40.0(+19.5)#64 | 38.5(+21.0)#2,366 |
| 65. | North Beach Haven | 59.0 | 40.0(+19.0)#65 | 38.5(+20.5)#2,531 |
| 66. | Beach Haven Borough | 58.7 | 40.0(+18.7)#66 | 38.5(+20.2)#2,621 |
| 67. | Mystic Island | 58.6 | 40.0(+18.6)#67 | 38.5(+20.1)#2,642 |
| 68. | Spring Lake Borough | 58.6 | 40.0(+18.6)#68 | 38.5(+20.1)#2,644 |
| 69. | Connecticut Farms | 58.5 | 40.0(+18.5)#69 | 38.5(+20.0)#2,683 |
| 70. | Laurel Heights | 58.5 | 40.0(+18.5)#70 | 38.5(+20.0)#2,685 |
| 71. | Elwood | 58.4 | 40.0(+18.4)#71 | 38.5(+19.9)#2,718 |
| 72. | Margate City | 57.9 | 40.0(+17.9)#72 | 38.5(+19.4)#2,889 |
| 73. | Monmouth Beach Borough | 57.9 | 40.0(+17.9)#73 | 38.5(+19.4)#2,891 |
| 74. | Interlaken Borough | 57.9 | 40.0(+17.9)#74 | 38.5(+19.4)#2,904 |
| 75. | Leisure Village | 57.8 | 40.0(+17.8)#75 | 38.5(+19.3)#2,927 |
| 76. | Leesburg | 57.8 | 40.0(+17.8)#76 | 38.5(+19.3)#2,947 |
| 77. | Dorothy | 57.7 | 40.0(+17.7)#77 | 38.5(+19.2)#2,974 |
| 78. | Brigantine | 57.6 | 40.0(+17.6)#78 | 38.5(+19.1)#2,995 |
| 79. | Vernon Valley | 57.6 | 40.0(+17.6)#79 | 38.5(+19.1)#3,003 |
| 80. | Franklin Center | 57.5 | 40.0(+17.5)#80 | 38.5(+19.0)#3,030 |
| 81. | Bay Head Borough | 57.5 | 40.0(+17.5)#81 | 38.5(+19.0)#3,033 |
| 82. | Beach Haven West | 57.3 | 40.0(+17.3)#82 | 38.5(+18.8)#3,111 |
| 83. | Thorofare | 57.1 | 40.0(+17.1)#83 | 38.5(+18.6)#3,187 |
| 84. | Ocean City | 56.9 | 40.0(+16.9)#84 | 38.5(+18.4)#3,261 |
| 85. | Pottersville | 56.9 | 40.0(+16.9)#85 | 38.5(+18.4)#3,278 |
| 86. | Mantoloking Borough | 56.7 | 40.0(+16.7)#86 | 38.5(+18.2)#3,346 |
| 87. | English Creek | 56.3 | 40.0(+16.3)#87 | 38.5(+17.8)#3,483 |
| 88. | Cumberland-Hesstown | 56.3 | 40.0(+16.3)#88 | 38.5(+17.8)#3,513 |
| 89. | Avon By The Sea Borough | 56.2 | 40.0(+16.2)#89 | 38.5(+17.7)#3,534 |
| 90. | Oceanville | 56.1 | 40.0(+16.1)#90 | 38.5(+17.6)#3,574 |
| 91. | Oldwick | 55.8 | 40.0(+15.8)#91 | 38.5(+17.3)#3,693 |
| 92. | Mountain Lake | 55.6 | 40.0(+15.6)#92 | 38.5(+17.1)#3,756 |
| 93. | Germania | 55.5 | 40.0(+15.5)#93 | 38.5(+17.0)#3,786 |
| 94. | Silver Lake Cdp Warren County | 55.5 | 40.0(+15.5)#94 | 38.5(+17.0)#3,802 |
| 95. | Lower Berkshire Valley | 55.3 | 40.0(+15.3)#95 | 38.5(+16.8)#3,899 |
| 96. | Jobstown | 55.3 | 40.0(+15.3)#96 | 38.5(+16.8)#3,905 |
| 97. | Columbia | 55.3 | 40.0(+15.3)#97 | 38.5(+16.8)#3,909 |
| 98. | North Cape May | 55.2 | 40.0(+15.2)#98 | 38.5(+16.7)#3,932 |
| 99. | Griggstown | 55.2 | 40.0(+15.2)#99 | 38.5(+16.7)#3,939 |
| 100. | Delaware Park | 55.1 | 40.0(+15.1)#100 | 38.5(+16.6)#3,990 |
Common Questions
What are the Top 10 Cities with the Oldest Population in New Jersey?
Top 10 Cities with the Oldest Population in New Jersey are:
#1
82.5
#2
76.0
#3
74.9
#4
74.5
#5
74.3
#6
74.2
#7
73.1
#8
72.5
#9
72.4
#10
72.3
What city has the Oldest Population in New Jersey?
Brookfield has the Oldest Population in New Jersey with 82.5.
What is the Median Age in the State of New Jersey?
Median Age in New Jersey is 40.0.
What is the Median Age in the United States?
Median Age in the United States is 38.5.