Cities with the Most Immigrants from Latvia in New Jersey
RELATED REPORTS & OPTIONS
Latvia
New Jersey
Compare Cities
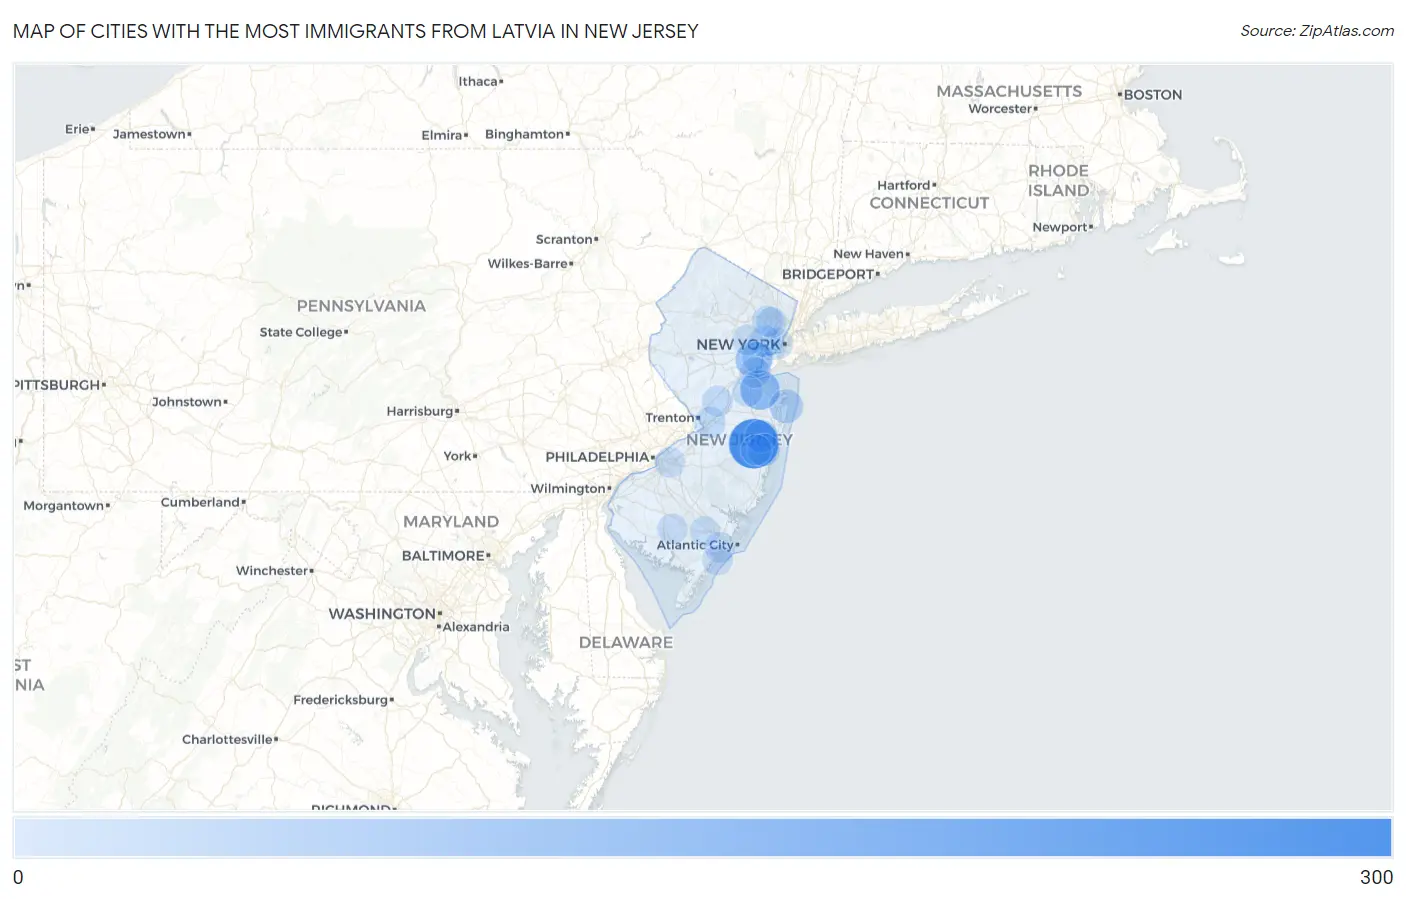
Map of Cities with the Most Immigrants from Latvia in New Jersey
0
300
Cities with the Most Immigrants from Latvia in New Jersey
| City | Latvia | vs State | vs National | |
| 1. | Cedar Glen West | 285 | 1,789(15.93%)#1 | 23,603(1.21%)#6 |
| 2. | Fair Lawn Borough | 138 | 1,789(7.71%)#2 | 23,603(0.58%)#12 |
| 3. | Strathmore | 132 | 1,789(7.38%)#3 | 23,603(0.56%)#13 |
| 4. | Rahway | 89 | 1,789(4.97%)#4 | 23,603(0.38%)#31 |
| 5. | Tinton Falls Borough | 89 | 1,789(4.97%)#5 | 23,603(0.38%)#32 |
| 6. | Long Branch | 53 | 1,789(2.96%)#6 | 23,603(0.22%)#74 |
| 7. | Tenafly Borough | 50 | 1,789(2.79%)#7 | 23,603(0.21%)#86 |
| 8. | Pine Brook | 44 | 1,789(2.46%)#8 | 23,603(0.19%)#99 |
| 9. | Lakewood | 40 | 1,789(2.24%)#9 | 23,603(0.17%)#110 |
| 10. | Toms River | 34 | 1,789(1.90%)#10 | 23,603(0.14%)#140 |
| 11. | Lavallette Borough | 33 | 1,789(1.84%)#11 | 23,603(0.14%)#152 |
| 12. | South Plainfield Borough | 32 | 1,789(1.79%)#12 | 23,603(0.14%)#155 |
| 13. | Edgewater Borough | 26 | 1,789(1.45%)#13 | 23,603(0.11%)#187 |
| 14. | Spotswood Borough | 24 | 1,789(1.34%)#14 | 23,603(0.10%)#199 |
| 15. | Elmwood Park Borough | 23 | 1,789(1.29%)#15 | 23,603(0.10%)#208 |
| 16. | Newark | 20 | 1,789(1.12%)#16 | 23,603(0.08%)#223 |
| 17. | Linden | 20 | 1,789(1.12%)#17 | 23,603(0.08%)#228 |
| 18. | Yardville | 19 | 1,789(1.06%)#18 | 23,603(0.08%)#245 |
| 19. | Chatham Borough | 18 | 1,789(1.01%)#19 | 23,603(0.08%)#258 |
| 20. | Cliffside Park Borough | 17 | 1,789(0.95%)#20 | 23,603(0.07%)#275 |
| 21. | Jersey City | 16 | 1,789(0.89%)#21 | 23,603(0.07%)#281 |
| 22. | Clifton | 16 | 1,789(0.89%)#22 | 23,603(0.07%)#283 |
| 23. | Merchantville Borough | 15 | 1,789(0.84%)#23 | 23,603(0.06%)#309 |
| 24. | Westmont | 14 | 1,789(0.78%)#24 | 23,603(0.06%)#322 |
| 25. | Plainsboro Center | 14 | 1,789(0.78%)#25 | 23,603(0.06%)#329 |
| 26. | Passaic | 13 | 1,789(0.73%)#26 | 23,603(0.06%)#335 |
| 27. | Bogota Borough | 13 | 1,789(0.73%)#27 | 23,603(0.06%)#345 |
| 28. | Hasbrouck Heights Borough | 12 | 1,789(0.67%)#28 | 23,603(0.05%)#362 |
| 29. | Perth Amboy | 11 | 1,789(0.61%)#29 | 23,603(0.05%)#381 |
| 30. | Old Bridge | 11 | 1,789(0.61%)#30 | 23,603(0.05%)#386 |
| 31. | Short Hills | 10 | 1,789(0.56%)#31 | 23,603(0.04%)#424 |
| 32. | Linwood | 9 | 1,789(0.50%)#32 | 23,603(0.04%)#471 |
| 33. | Vineland | 8 | 1,789(0.45%)#33 | 23,603(0.03%)#483 |
| 34. | Highland Park Borough | 7 | 1,789(0.39%)#34 | 23,603(0.03%)#517 |
| 35. | Mays Landing | 7 | 1,789(0.39%)#35 | 23,603(0.03%)#520 |
| 36. | Vauxhall | 7 | 1,789(0.39%)#36 | 23,603(0.03%)#522 |
| 37. | Ocean City | 6 | 1,789(0.34%)#37 | 23,603(0.03%)#555 |
| 38. | Ellisburg | 6 | 1,789(0.34%)#38 | 23,603(0.03%)#561 |
| 39. | Roosevelt Borough | 6 | 1,789(0.34%)#39 | 23,603(0.03%)#567 |
| 40. | Fort Lee Borough | 5 | 1,789(0.28%)#40 | 23,603(0.02%)#576 |
| 41. | Pine Lake Park | 5 | 1,789(0.28%)#41 | 23,603(0.02%)#586 |
| 42. | Millington | 4 | 1,789(0.22%)#42 | 23,603(0.02%)#610 |
Common Questions
What are the Top 10 Cities with the Most Immigrants from Latvia in New Jersey?
Top 10 Cities with the Most Immigrants from Latvia in New Jersey are:
#1
285
#2
132
#3
89
#4
53
#5
40
#6
34
#7
20
#8
20
#9
19
#10
16
What city has the Most Immigrants from Latvia in New Jersey?
Cedar Glen West has the Most Immigrants from Latvia in New Jersey with 285.
What is the Total Immigrants from Latvia in the State of New Jersey?
Total Immigrants from Latvia in New Jersey is 1,789.
What is the Total Immigrants from Latvia in the United States?
Total Immigrants from Latvia in the United States is 23,603.