Cities with the Highest Percentage of Immigrants from Switzerland in New Jersey

RELATED REPORTS & OPTIONS

Switzerland
Population
Families and Households
Female Fertility
Female Fertility (Unmarried)
Race (Community Size)
Race (Percentage)
Ancestry (Community Size)
AfghanAfricanAlaska NativeAlaskan AthabascanAlbanianAleutAlsatianAmericanApacheArabArapahoArgentineanArmenianAssyrian / Chaldean / SyriacAustralianAustrianBahamianBangladeshiBarbadianBasqueBelgianBelizeanBermudanBhutaneseBlackfeetBolivianBrazilianBritishBritish West IndianBulgarianBurmeseCajunCambodianCanadianCape VerdeanCarpatho RusynCelticCentral AmericanCentral American IndianCherokeeCheyenneChickasawChileanChineseChippewaChoctawColombianColvilleComancheCosta RicanCreeCreekCroatianCrowCubanCypriotCzechCzechoslovakianDanishDelawareDominicanDutchDutch West IndianEastern EuropeanEcuadorianEgyptianEnglishEstonianEthiopianEuropeanFijianFilipinoFinnishFrenchFrench American IndianFrench CanadianGermanGerman RussianGhanaianGreekGuamanian / ChamorroGuatemalanGuyaneseHaitianHmongHonduranHopiHoumaHungarianIcelanderIndian (Asian)IndonesianInupiatIranianIraqiIrishIroquoisIsraeliItalianJamaicanJapaneseJordanianKenyanKiowaKoreanLaotianLatvianLebaneseLiberianLithuanianLumbeeLuxembourgerMacedonianMalaysianMalteseMarshalleseMenomineeMexicanMexican American IndianMongolianMoroccanNative HawaiianNavajoNepaleseNew ZealanderNicaraguanNigerianNorthern EuropeanNorwegianOkinawanOsageOttawaPaiutePakistaniPalestinianPanamanianParaguayanPennsylvania GermanPeruvianPimaPolishPortuguesePotawatomiPuebloPuerto RicanPuget Sound SalishRomanianRussianSalvadoranSamoanScandinavianScotch-IrishScottishSeminoleSenegaleseSerbianShoshoneSierra LeoneanSiouxSlavicSlovakSloveneSomaliSouth AfricanSouth AmericanSouth American IndianSoviet UnionSpaniardSpanishSpanish AmericanSpanish American IndianSri LankanSubsaharan AfricanSudaneseSwedishSwissSyrianTaiwaneseThaiTlingit-HaidaTohono O'OdhamTonganTrinidadian and TobagonianTsimshianTurkishU.S. Virgin IslanderUgandanUkrainianUruguayanUteVenezuelanVietnameseWelshWest IndianYakamaYaquiYugoslavianYumanYup'ikZimbabwean
Ancestry (Percentage)
AfghanAfricanAlaska NativeAlaskan AthabascanAlbanianAleutAlsatianAmericanApacheArabArapahoArgentineanArmenianAssyrian / Chaldean / SyriacAustralianAustrianBahamianBangladeshiBarbadianBasqueBelgianBelizeanBermudanBhutaneseBlackfeetBolivianBrazilianBritishBritish West IndianBulgarianBurmeseCajunCambodianCanadianCape VerdeanCarpatho RusynCelticCentral AmericanCentral American IndianCherokeeCheyenneChickasawChileanChineseChippewaChoctawColombianColvilleComancheCosta RicanCreeCreekCroatianCrowCubanCypriotCzechCzechoslovakianDanishDelawareDominicanDutchDutch West IndianEastern EuropeanEcuadorianEgyptianEnglishEstonianEthiopianEuropeanFijianFilipinoFinnishFrenchFrench American IndianFrench CanadianGermanGerman RussianGhanaianGreekGuamanian / ChamorroGuatemalanGuyaneseHaitianHmongHonduranHopiHoumaHungarianIcelanderIndian (Asian)IndonesianInupiatIranianIraqiIrishIroquoisIsraeliItalianJamaicanJapaneseJordanianKenyanKiowaKoreanLaotianLatvianLebaneseLiberianLithuanianLumbeeLuxembourgerMacedonianMalaysianMalteseMarshalleseMenomineeMexicanMexican American IndianMongolianMoroccanNative HawaiianNavajoNepaleseNew ZealanderNicaraguanNigerianNorthern EuropeanNorwegianOkinawanOsageOttawaPaiutePakistaniPalestinianPanamanianParaguayanPennsylvania GermanPeruvianPimaPolishPortuguesePotawatomiPuebloPuerto RicanPuget Sound SalishRomanianRussianSalvadoranSamoanScandinavianScotch-IrishScottishSeminoleSenegaleseSerbianShoshoneSierra LeoneanSiouxSlavicSlovakSloveneSomaliSouth AfricanSouth AmericanSouth American IndianSoviet UnionSpaniardSpanishSpanish AmericanSpanish American IndianSri LankanSubsaharan AfricanSudaneseSwedishSwissSyrianTaiwaneseThaiTlingit-HaidaTohono O'OdhamTonganTrinidadian and TobagonianTsimshianTurkishU.S. Virgin IslanderUgandanUkrainianUruguayanUteVenezuelanVietnameseWelshWest IndianYakamaYaquiYugoslavianYumanYup'ikZimbabwean
Immigrant Origin (Total)
AfghanistanAfricaAlbaniaArgentinaArmeniaAsiaAustraliaAustriaAzoresBahamasBangladeshBarbadosBelarusBelgiumBelizeBoliviaBosnia and HerzegovinaBrazilBulgariaBurma / MyanmarCabo VerdeCambodiaCameroonCanadaCaribbeanCentral AmericaChileChinaColombiaCongoCosta RicaCroatiaCubaCzechoslovakiaDenmarkDominicaDominican RepublicEastern AfricaEastern AsiaEastern EuropeEcuadorEgyptEl SalvadorEnglandEritreaEthiopiaEuropeFijiFranceGermanyGhanaGreeceGrenadaGuatemalaGuyanaHaitiHondurasHong KongHungaryIndiaIndonesiaIranIraqIrelandIsraelItalyJamaicaJapanJordanKazakhstanKenyaKoreaKuwaitLaosLatin AmericaLatviaLebanonLiberiaLithuaniaMalaysiaMexicoMicronesiaMiddle AfricaMoldovaMoroccoNepalNetherlandsNicaraguaNigeriaNorth MacedoniaNorthern AfricaNorthern EuropeNorwayOceaniaPakistanPanamaPeruPhilippinesPolandPortugalRomaniaRussiaSaudi ArabiaScotlandSenegalSerbiaSierra LeoneSingaporeSomaliaSouth AfricaSouth AmericaSouth Central AsiaSouth Eastern AsiaSouthern EuropeSpainSri LankaSt. Vincent and the GrenadinesSudanSwedenSwitzerlandSyriaTaiwanThailandTrinidad and TobagoTurkeyUgandaUkraineUruguayUzbekistanVenezuelaVietnamWest IndiesWestern AfricaWestern AsiaWestern EuropeYemenZaireZimbabwe
Immigrant Origin (Percentage)
AfghanistanAfricaAlbaniaArgentinaArmeniaAsiaAustraliaAustriaAzoresBahamasBangladeshBarbadosBelarusBelgiumBelizeBoliviaBosnia and HerzegovinaBrazilBulgariaBurma / MyanmarCabo VerdeCambodiaCameroonCanadaCaribbeanCentral AmericaChileChinaColombiaCongoCosta RicaCroatiaCubaCzechoslovakiaDenmarkDominicaDominican RepublicEastern AfricaEastern AsiaEastern EuropeEcuadorEgyptEl SalvadorEnglandEritreaEthiopiaEuropeFijiFranceGermanyGhanaGreeceGrenadaGuatemalaGuyanaHaitiHondurasHong KongHungaryIndiaIndonesiaIranIraqIrelandIsraelItalyJamaicaJapanJordanKazakhstanKenyaKoreaKuwaitLaosLatin AmericaLatviaLebanonLiberiaLithuaniaMalaysiaMexicoMicronesiaMiddle AfricaMoldovaMoroccoNepalNetherlandsNicaraguaNigeriaNorth MacedoniaNorthern AfricaNorthern EuropeNorwayOceaniaPakistanPanamaPeruPhilippinesPolandPortugalRomaniaRussiaSaudi ArabiaScotlandSenegalSerbiaSierra LeoneSingaporeSomaliaSouth AfricaSouth AmericaSouth Central AsiaSouth Eastern AsiaSouthern EuropeSpainSri LankaSt. Vincent and the GrenadinesSudanSwedenSwitzerlandSyriaTaiwanThailandTrinidad and TobagoTurkeyUgandaUkraineUruguayUzbekistanVenezuelaVietnamWest IndiesWestern AfricaWestern AsiaWestern EuropeYemenZaireZimbabwe
Income
Income (Families)
Income (Households)
Poverty
Poverty (Families)
Unemployment
Employment Occupations
Employment Industries
Employer Class
Commute Time
Commute Means
School Enrollment
Education by Degree Field
Occupancy
Finances
Physical Characteristics
New Jersey
Compare Cities
Comparison Subject

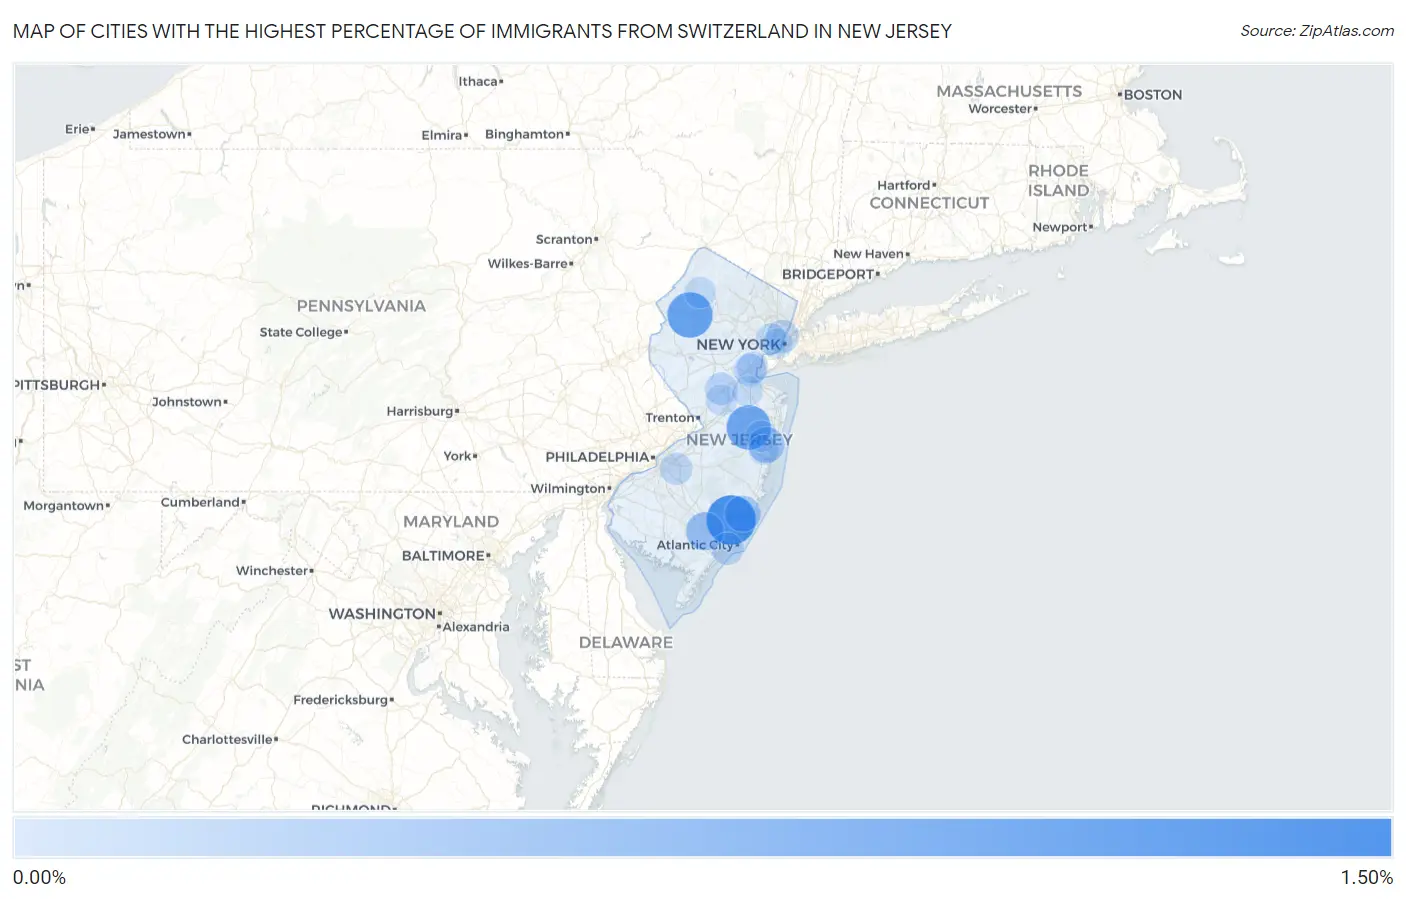
Map of Cities with the Highest Percentage of Immigrants from Switzerland in New Jersey

0.00%
1.50%
Cities with the Highest Percentage of Immigrants from Switzerland in New Jersey Map

Cities with the Highest Percentage of Immigrants from Switzerland in New Jersey

City Switzerland vs State vs National
1.Port Republic1.12%0.015%(+1.11)#10.011%(+1.11)#32
2.Liberty Corner1.08%0.015%(+1.07)#20.011%(+1.07)#34
3.Panther Valley0.88%0.015%(+0.862)#30.011%(+0.865)#45
4.Vista Center0.81%0.015%(+0.799)#40.011%(+0.803)#47
5.Mays Landing0.45%0.015%(+0.438)#50.011%(+0.442)#101
6.Pines Lake0.43%0.015%(+0.413)#60.011%(+0.417)#105
7.Collingswood Borough0.35%0.015%(+0.332)#70.011%(+0.335)#132
8.Leisure Village East0.34%0.015%(+0.329)#80.011%(+0.333)#134
9.Mystic Island0.34%0.015%(+0.325)#90.011%(+0.329)#137
10.Ramapo College Of New Jersey0.31%0.015%(+0.297)#100.011%(+0.301)#152
11.Pitman Borough0.31%0.015%(+0.292)#110.011%(+0.295)#156
12.Atlantic Highlands Borough0.29%0.015%(+0.280)#120.011%(+0.284)#164
13.Madison Borough0.28%0.015%(+0.269)#130.011%(+0.273)#170
14.Millington0.24%0.015%(+0.223)#140.011%(+0.227)#201
15.Lake Como Borough0.18%0.015%(+0.160)#150.011%(+0.164)#281
16.Lincoln Park Borough0.16%0.015%(+0.141)#160.011%(+0.145)#310
17.Union City0.15%0.015%(+0.140)#170.011%(+0.143)#313
18.Metuchen Borough0.15%0.015%(+0.139)#180.011%(+0.142)#315
19.Midland Park Borough0.14%0.015%(+0.127)#190.011%(+0.131)#334
20.Kendall Park0.14%0.015%(+0.126)#200.011%(+0.130)#335
21.Pompton Plains0.14%0.015%(+0.122)#210.011%(+0.126)#343
22.Fords0.13%0.015%(+0.119)#220.011%(+0.123)#349
23.Margate City0.13%0.015%(+0.116)#230.011%(+0.120)#357
24.Bogota Borough0.12%0.015%(+0.108)#240.011%(+0.112)#368
25.Chatham Borough0.11%0.015%(+0.094)#250.011%(+0.097)#396
26.Springdale0.10%0.015%(+0.090)#260.011%(+0.094)#401
27.Stratford Borough0.10%0.015%(+0.085)#270.011%(+0.089)#407
28.Woodbridge0.091%0.015%(+0.076)#280.011%(+0.079)#438
29.Waldwick Borough0.089%0.015%(+0.074)#290.011%(+0.078)#445
30.Florham Park Borough0.086%0.015%(+0.071)#300.011%(+0.075)#454
31.Newton0.084%0.015%(+0.069)#310.011%(+0.072)#463
32.Lakewood0.079%0.015%(+0.064)#320.011%(+0.067)#479
33.Princeton Meadows0.064%0.015%(+0.049)#330.011%(+0.053)#527
34.Kearny0.051%0.015%(+0.036)#340.011%(+0.040)#591
35.Red Bank Borough0.047%0.015%(+0.032)#350.011%(+0.035)#617
36.Parsippany0.041%0.015%(+0.026)#360.011%(+0.030)#653
37.Old Bridge0.032%0.015%(+0.017)#370.011%(+0.021)#713
38.Jersey City0.031%0.015%(+0.015)#380.011%(+0.019)#731
39.South Plainfield Borough0.016%0.015%(+0.001)#390.011%(+0.005)#884
40.Toms River0.013%0.015%(-0.002)#400.011%(+0.002)#920
41.Hillsborough0.0046%0.015%(-0.011)#410.011%(-0.007)#1,018

Common Questions

What are the Top 10 Cities with the Highest Percentage of Immigrants from Switzerland in New Jersey?
Top 10 Cities with the Highest Percentage of Immigrants from Switzerland in New Jersey are:
What city has the Highest Percentage of Immigrants from Switzerland in New Jersey?
Port Republic has the Highest Percentage of Immigrants from Switzerland in New Jersey with 1.12%.
What is the Percentage of Immigrants from Switzerland in the State of New Jersey?
Percentage of Immigrants from Switzerland in New Jersey is 0.015%.
What is the Percentage of Immigrants from Switzerland in the United States?
Percentage of Immigrants from Switzerland in the United States is 0.011%.