Cities with the Highest Percentage of Immigrants from Morocco in New Jersey
RELATED REPORTS & OPTIONS
Morocco
New Jersey
Compare Cities
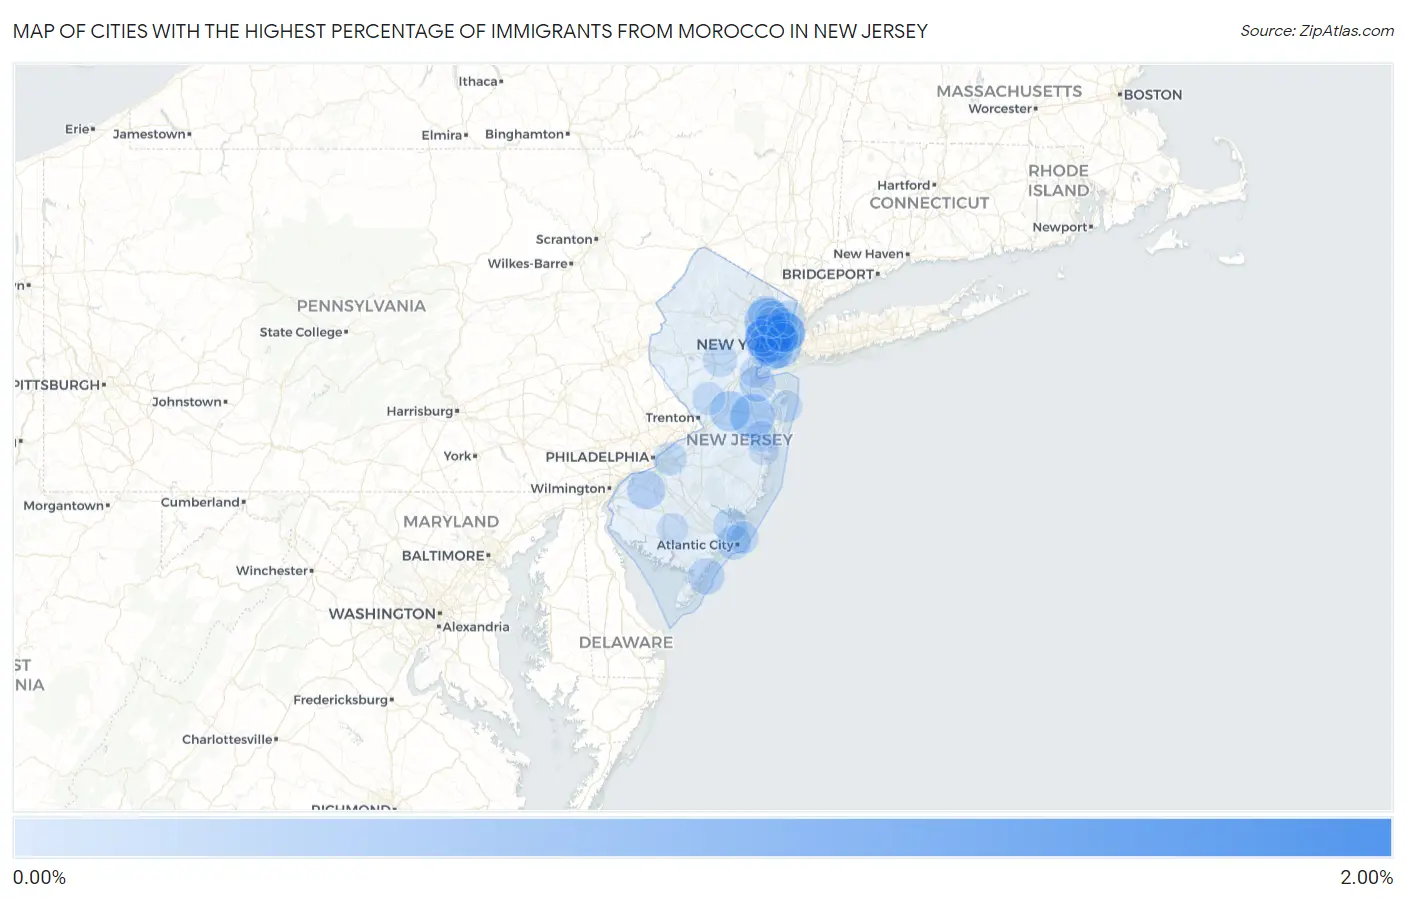
Map of Cities with the Highest Percentage of Immigrants from Morocco in New Jersey
0.00%
2.00%
Cities with the Highest Percentage of Immigrants from Morocco in New Jersey
| City | Morocco | vs State | vs National | |
| 1. | East Newark Borough | 1.73% | 0.061%(+1.67)#-1 | 0.027%(+1.70)#0 |
| 2. | Saddle River Borough | 1.46% | 0.061%(+1.40)#0 | 0.027%(+1.43)#1 |
| 3. | Pleasantdale | 1.14% | 0.061%(+1.08)#1 | 0.027%(+1.11)#2 |
| 4. | Frenchtown Borough | 0.98% | 0.061%(+0.915)#2 | 0.027%(+0.950)#3 |
| 5. | Beach Haven Borough | 0.94% | 0.061%(+0.882)#3 | 0.027%(+0.916)#4 |
| 6. | Macopin | 0.85% | 0.061%(+0.786)#4 | 0.027%(+0.820)#5 |
| 7. | Flemington Borough | 0.80% | 0.061%(+0.741)#5 | 0.027%(+0.775)#6 |
| 8. | Kearny | 0.58% | 0.061%(+0.522)#6 | 0.027%(+0.557)#7 |
| 9. | Jersey City | 0.56% | 0.061%(+0.501)#9 | 0.027%(+0.535)#358 |
| 10. | Harrison | 0.53% | 0.061%(+0.470)#10 | 0.027%(+0.504)#359 |
| 11. | North Arlington Borough | 0.53% | 0.061%(+0.465)#11 | 0.027%(+0.499)#360 |
| 12. | Spring Lake Heights Borough | 0.51% | 0.061%(+0.453)#12 | 0.027%(+0.487)#361 |
| 13. | Clifton | 0.49% | 0.061%(+0.424)#13 | 0.027%(+0.459)#362 |
| 14. | West Freehold | 0.43% | 0.061%(+0.368)#14 | 0.027%(+0.403)#363 |
| 15. | West New York | 0.33% | 0.061%(+0.271)#15 | 0.027%(+0.305)#364 |
| 16. | Twin Rivers | 0.32% | 0.061%(+0.258)#16 | 0.027%(+0.293)#365 |
| 17. | East Rutherford Borough | 0.31% | 0.061%(+0.249)#17 | 0.027%(+0.283)#366 |
| 18. | Guttenberg | 0.29% | 0.061%(+0.228)#18 | 0.027%(+0.262)#367 |
| 19. | Bayonne | 0.28% | 0.061%(+0.217)#19 | 0.027%(+0.251)#368 |
| 20. | Alpine Borough | 0.28% | 0.061%(+0.215)#20 | 0.027%(+0.249)#369 |
| 21. | River Edge Borough | 0.25% | 0.061%(+0.189)#21 | 0.027%(+0.223)#370 |
| 22. | Mullica Hill | 0.25% | 0.061%(+0.186)#22 | 0.027%(+0.220)#371 |
| 23. | Sea Isle City | 0.20% | 0.061%(+0.135)#23 | 0.027%(+0.169)#372 |
| 24. | Norwood Borough | 0.19% | 0.061%(+0.134)#24 | 0.027%(+0.168)#373 |
| 25. | Laurence Harbor | 0.19% | 0.061%(+0.126)#25 | 0.027%(+0.160)#374 |
| 26. | Paterson | 0.19% | 0.061%(+0.126)#26 | 0.027%(+0.160)#375 |
| 27. | Raritan Borough | 0.18% | 0.061%(+0.120)#27 | 0.027%(+0.154)#376 |
| 28. | Secaucus | 0.18% | 0.061%(+0.116)#28 | 0.027%(+0.150)#377 |
| 29. | Gibbsboro Borough | 0.18% | 0.061%(+0.115)#29 | 0.027%(+0.149)#378 |
| 30. | Garfield | 0.18% | 0.061%(+0.115)#30 | 0.027%(+0.149)#379 |
| 31. | Keansburg Borough | 0.17% | 0.061%(+0.113)#31 | 0.027%(+0.148)#380 |
| 32. | Waldwick Borough | 0.17% | 0.061%(+0.108)#32 | 0.027%(+0.142)#381 |
| 33. | Westwood Borough | 0.16% | 0.061%(+0.099)#33 | 0.027%(+0.134)#382 |
| 34. | Atlantic City | 0.14% | 0.061%(+0.074)#34 | 0.027%(+0.109)#383 |
| 35. | Highland Park Borough | 0.13% | 0.061%(+0.073)#35 | 0.027%(+0.107)#384 |
| 36. | Sayreville Borough | 0.13% | 0.061%(+0.072)#36 | 0.027%(+0.106)#385 |
| 37. | New Milford Borough | 0.13% | 0.061%(+0.069)#37 | 0.027%(+0.104)#386 |
| 38. | Martinsville | 0.13% | 0.061%(+0.069)#38 | 0.027%(+0.103)#387 |
| 39. | Fort Lee Borough | 0.13% | 0.061%(+0.067)#39 | 0.027%(+0.102)#388 |
| 40. | Point Pleasant Borough | 0.12% | 0.061%(+0.060)#40 | 0.027%(+0.094)#389 |
| 41. | Englewood | 0.12% | 0.061%(+0.059)#41 | 0.027%(+0.094)#390 |
| 42. | Preakness | 0.11% | 0.061%(+0.052)#42 | 0.027%(+0.086)#391 |
| 43. | Smithville | 0.11% | 0.061%(+0.049)#43 | 0.027%(+0.083)#392 |
| 44. | Cherry Hill Mall | 0.11% | 0.061%(+0.046)#44 | 0.027%(+0.081)#393 |
| 45. | Princeton | 0.092% | 0.061%(+0.031)#45 | 0.027%(+0.065)#394 |
| 46. | Hawthorne Borough | 0.082% | 0.061%(+0.021)#46 | 0.027%(+0.056)#395 |
| 47. | Brigantine | 0.077% | 0.061%(+0.016)#47 | 0.027%(+0.050)#396 |
| 48. | East Orange | 0.065% | 0.061%(+0.005)#48 | 0.027%(+0.039)#397 |
| 49. | Long Branch | 0.060% | 0.061%(-0.001)#49 | 0.027%(+0.033)#398 |
| 50. | Union City | 0.054% | 0.061%(-0.007)#50 | 0.027%(+0.027)#399 |
| 51. | Hoboken | 0.049% | 0.061%(-0.011)#51 | 0.027%(+0.023)#400 |
| 52. | Fair Lawn Borough | 0.049% | 0.061%(-0.012)#52 | 0.027%(+0.022)#401 |
| 53. | Haddonfield Borough | 0.048% | 0.061%(-0.013)#53 | 0.027%(+0.022)#402 |
| 54. | Vineland | 0.048% | 0.061%(-0.013)#54 | 0.027%(+0.021)#403 |
| 55. | Paramus Borough | 0.041% | 0.061%(-0.019)#55 | 0.027%(+0.015)#404 |
| 56. | Lakewood | 0.028% | 0.061%(-0.033)#56 | 0.027%(+0.001)#405 |
| 57. | Perth Amboy | 0.025% | 0.061%(-0.035)#57 | 0.027%(-0.001)#406 |
| 58. | Newark | 0.020% | 0.061%(-0.041)#58 | 0.027%(-0.007)#407 |
| 59. | Elizabeth | 0.018% | 0.061%(-0.042)#59 | 0.027%(-0.008)#408 |
| 60. | South Plainfield Borough | 0.016% | 0.061%(-0.044)#60 | 0.027%(-0.010)#409 |
| 61. | Toms River | 0.015% | 0.061%(-0.046)#61 | 0.027%(-0.012)#410 |
| 62. | Passaic | 0.014% | 0.061%(-0.046)#62 | 0.027%(-0.012)#411 |
| 63. | Ridgefield Park | 0.0076% | 0.061%(-0.053)#63 | 0.027%(-0.019)#412 |
Common Questions
What are the Top 10 Cities with the Highest Percentage of Immigrants from Morocco in New Jersey?
Top 10 Cities with the Highest Percentage of Immigrants from Morocco in New Jersey are:
#1
0.58%
#2
0.56%
#3
0.53%
#4
0.49%
#5
0.43%
#6
0.33%
#7
0.32%
#8
0.29%
#9
0.28%
#10
0.25%
What city has the Highest Percentage of Immigrants from Morocco in New Jersey?
Kearny has the Highest Percentage of Immigrants from Morocco in New Jersey with 0.58%.
What is the Percentage of Immigrants from Morocco in the State of New Jersey?
Percentage of Immigrants from Morocco in New Jersey is 0.061%.
What is the Percentage of Immigrants from Morocco in the United States?
Percentage of Immigrants from Morocco in the United States is 0.027%.