Cities with the Highest Child Poverty Level Among Girls Under the Age of 16 in New Jersey
RELATED REPORTS & OPTIONS
Highest Poverty | Girls 0-16
New Jersey
Compare Cities
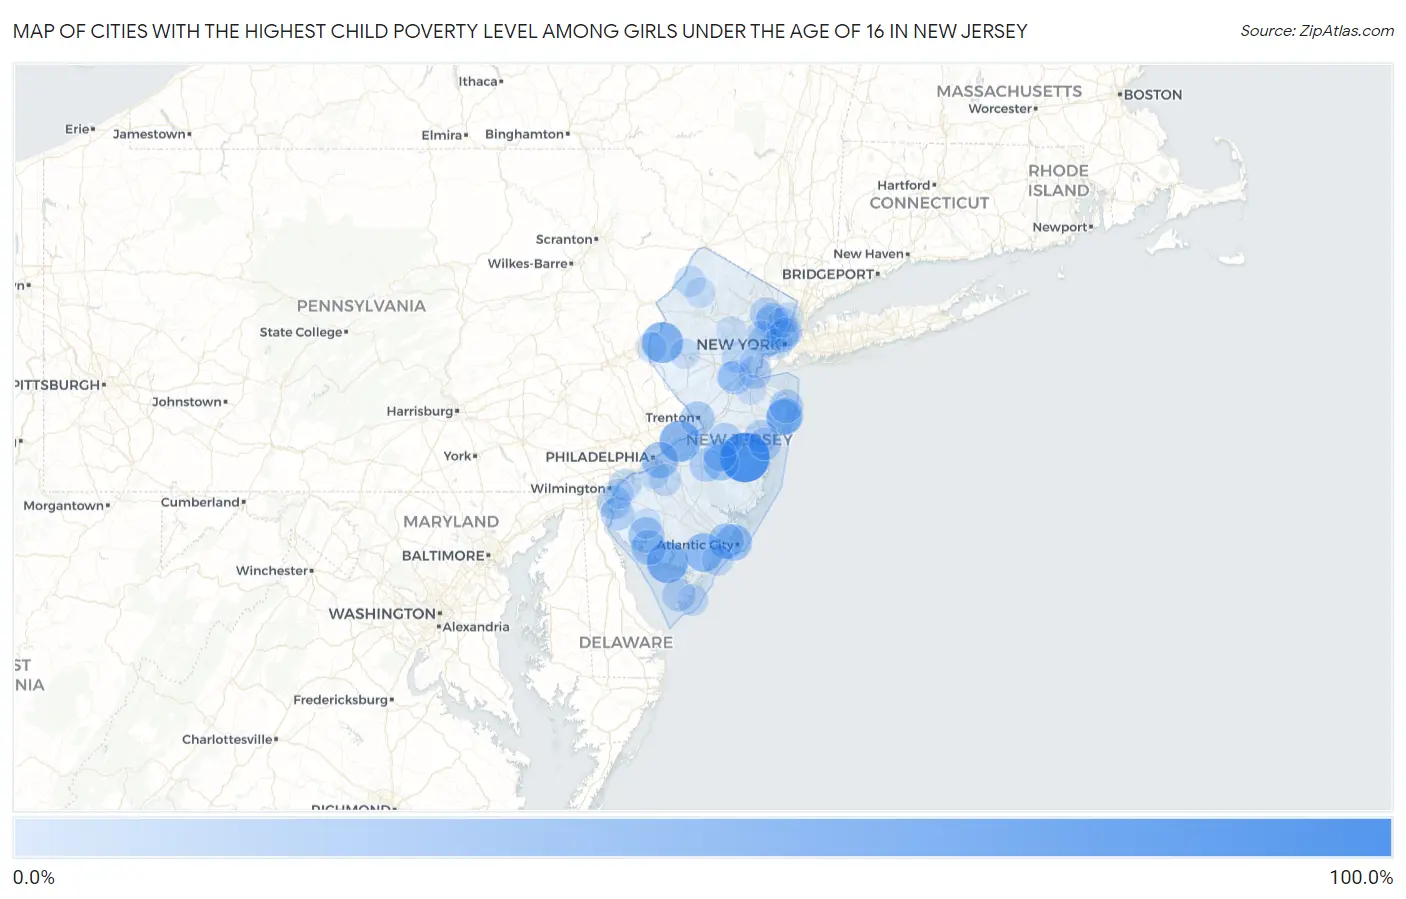
Map of Cities with the Highest Child Poverty Level Among Girls Under the Age of 16 in New Jersey
0.0%
100.0%
Cities with the Highest Child Poverty Level Among Girls Under the Age of 16 in New Jersey
| City | Child Poverty (Girls) | vs State | vs National | |
| 1. | Crestwood Village | 100.0% | 13.6%(+86.4)#1 | 17.0%(+83.0)#1 |
| 2. | Sunset Lake | 100.0% | 13.6%(+86.4)#2 | 17.0%(+83.0)#85 |
| 3. | Pluckemin | 100.0% | 13.6%(+86.4)#3 | 17.0%(+83.0)#198 |
| 4. | Arrowhead Lake | 100.0% | 13.6%(+86.4)#4 | 17.0%(+83.0)#515 |
| 5. | Teterboro Borough | 100.0% | 13.6%(+86.4)#5 | 17.0%(+83.0)#539 |
| 6. | Seaside Heights Borough | 86.1% | 13.6%(+72.5)#6 | 17.0%(+69.1)#848 |
| 7. | Port Norris | 65.2% | 13.6%(+51.5)#7 | 17.0%(+48.2)#1,745 |
| 8. | Beverly | 64.4% | 13.6%(+50.8)#8 | 17.0%(+47.4)#1,768 |
| 9. | New Village | 64.0% | 13.6%(+50.4)#9 | 17.0%(+47.0)#1,810 |
| 10. | Victory Gardens Borough | 58.6% | 13.6%(+44.9)#10 | 17.0%(+41.6)#2,209 |
| 11. | Penns Grove Borough | 58.5% | 13.6%(+44.9)#11 | 17.0%(+41.6)#2,215 |
| 12. | English Creek | 56.0% | 13.6%(+42.4)#12 | 17.0%(+39.0)#2,411 |
| 13. | Corbin City | 53.8% | 13.6%(+40.2)#13 | 17.0%(+36.9)#2,630 |
| 14. | Port Morris | 48.3% | 13.6%(+34.6)#14 | 17.0%(+31.3)#3,260 |
| 15. | Lindenwold Borough | 46.3% | 13.6%(+32.7)#15 | 17.0%(+29.4)#3,518 |
| 16. | Fairview Borough | 45.7% | 13.6%(+32.1)#16 | 17.0%(+28.7)#3,603 |
| 17. | Camden | 45.2% | 13.6%(+31.5)#17 | 17.0%(+28.2)#3,666 |
| 18. | Atlantic City | 45.0% | 13.6%(+31.4)#18 | 17.0%(+28.1)#3,674 |
| 19. | Dennisville | 44.8% | 13.6%(+31.2)#19 | 17.0%(+27.9)#3,704 |
| 20. | Loch Arbour | 44.4% | 13.6%(+30.8)#20 | 17.0%(+27.5)#3,778 |
| 21. | Somerdale Borough | 44.2% | 13.6%(+30.6)#21 | 17.0%(+27.2)#3,805 |
| 22. | Presidential Lakes Estates | 43.2% | 13.6%(+29.5)#22 | 17.0%(+26.2)#3,956 |
| 23. | Rutgers University-Busch Campus | 43.1% | 13.6%(+29.4)#23 | 17.0%(+26.1)#3,968 |
| 24. | Pleasantville | 42.3% | 13.6%(+28.7)#24 | 17.0%(+25.4)#4,085 |
| 25. | Bridgeton | 41.3% | 13.6%(+27.7)#25 | 17.0%(+24.4)#4,226 |
| 26. | Asbury Park | 40.8% | 13.6%(+27.1)#26 | 17.0%(+23.8)#4,313 |
| 27. | Westville Borough | 40.3% | 13.6%(+26.6)#27 | 17.0%(+23.3)#4,399 |
| 28. | Woodbine Borough | 40.1% | 13.6%(+26.4)#28 | 17.0%(+23.1)#4,432 |
| 29. | Cedarville | 40.0% | 13.6%(+26.4)#29 | 17.0%(+23.0)#4,449 |
| 30. | Woodstown Borough | 39.1% | 13.6%(+25.4)#30 | 17.0%(+22.1)#4,632 |
| 31. | Trenton | 37.6% | 13.6%(+24.0)#31 | 17.0%(+20.6)#4,885 |
| 32. | Laurel Heights | 36.9% | 13.6%(+23.3)#32 | 17.0%(+19.9)#5,055 |
| 33. | West New York | 36.8% | 13.6%(+23.2)#33 | 17.0%(+19.9)#5,082 |
| 34. | Neptune City Borough | 36.3% | 13.6%(+22.6)#34 | 17.0%(+19.3)#5,199 |
| 35. | Prospect Park Borough | 36.2% | 13.6%(+22.6)#35 | 17.0%(+19.2)#5,213 |
| 36. | Atco | 36.1% | 13.6%(+22.5)#36 | 17.0%(+19.2)#5,228 |
| 37. | New Brunswick | 35.7% | 13.6%(+22.1)#37 | 17.0%(+18.7)#5,327 |
| 38. | New Egypt | 35.0% | 13.6%(+21.4)#38 | 17.0%(+18.0)#5,447 |
| 39. | Long Branch | 34.4% | 13.6%(+20.8)#39 | 17.0%(+17.4)#5,577 |
| 40. | Audubon Park Borough | 34.4% | 13.6%(+20.7)#40 | 17.0%(+17.4)#5,581 |
| 41. | Keasbey | 34.1% | 13.6%(+20.5)#41 | 17.0%(+17.1)#5,641 |
| 42. | Leisuretowne | 34.1% | 13.6%(+20.5)#42 | 17.0%(+17.1)#5,642 |
| 43. | Pennsville | 33.9% | 13.6%(+20.2)#43 | 17.0%(+16.9)#5,704 |
| 44. | Wrightstown Borough | 33.8% | 13.6%(+20.2)#44 | 17.0%(+16.8)#5,712 |
| 45. | Newark | 33.2% | 13.6%(+19.6)#45 | 17.0%(+16.2)#5,937 |
| 46. | Salem | 33.0% | 13.6%(+19.4)#46 | 17.0%(+16.1)#5,972 |
| 47. | Browns Mills | 32.4% | 13.6%(+18.8)#47 | 17.0%(+15.4)#6,108 |
| 48. | Passaic | 32.1% | 13.6%(+18.5)#48 | 17.0%(+15.1)#6,186 |
| 49. | Villas | 31.8% | 13.6%(+18.2)#49 | 17.0%(+14.9)#6,239 |
| 50. | Lakewood | 31.8% | 13.6%(+18.2)#50 | 17.0%(+14.8)#6,256 |
| 51. | Leisure Village | 30.9% | 13.6%(+17.2)#51 | 17.0%(+13.9)#6,459 |
| 52. | Paterson | 30.7% | 13.6%(+17.1)#52 | 17.0%(+13.7)#6,513 |
| 53. | Keansburg Borough | 30.0% | 13.6%(+16.4)#53 | 17.0%(+13.0)#6,672 |
| 54. | Perth Amboy | 29.6% | 13.6%(+16.0)#54 | 17.0%(+12.6)#6,801 |
| 55. | Pedricktown | 29.2% | 13.6%(+15.5)#55 | 17.0%(+12.2)#6,906 |
| 56. | Garfield | 28.5% | 13.6%(+14.8)#56 | 17.0%(+11.5)#7,093 |
| 57. | Elmwood Park Borough | 28.4% | 13.6%(+14.7)#57 | 17.0%(+11.4)#7,109 |
| 58. | Woodlynne Borough | 28.0% | 13.6%(+14.4)#58 | 17.0%(+11.0)#7,193 |
| 59. | Thorofare | 27.9% | 13.6%(+14.3)#59 | 17.0%(+10.9)#7,231 |
| 60. | Union City | 27.3% | 13.6%(+13.6)#60 | 17.0%(+10.3)#7,383 |
| 61. | Mount Ephraim Borough | 27.1% | 13.6%(+13.4)#61 | 17.0%(+10.1)#7,470 |
| 62. | Union | 26.8% | 13.6%(+13.2)#62 | 17.0%(+9.85)#7,528 |
| 63. | Watsessing | 26.7% | 13.6%(+13.0)#63 | 17.0%(+9.69)#7,572 |
| 64. | Wharton Borough | 26.4% | 13.6%(+12.8)#64 | 17.0%(+9.44)#7,660 |
| 65. | Blackwood | 26.2% | 13.6%(+12.5)#65 | 17.0%(+9.18)#7,735 |
| 66. | Wallington Borough | 26.0% | 13.6%(+12.4)#66 | 17.0%(+9.07)#7,770 |
| 67. | Wildwood | 25.8% | 13.6%(+12.2)#67 | 17.0%(+8.86)#7,845 |
| 68. | Plainfield | 25.7% | 13.6%(+12.1)#68 | 17.0%(+8.77)#7,883 |
| 69. | Ocean City | 25.7% | 13.6%(+12.1)#69 | 17.0%(+8.76)#7,888 |
| 70. | Shiloh Borough | 25.7% | 13.6%(+12.1)#70 | 17.0%(+8.74)#7,904 |
| 71. | High Bridge Borough | 25.6% | 13.6%(+12.0)#71 | 17.0%(+8.65)#7,929 |
| 72. | Crandon Lakes | 24.1% | 13.6%(+10.4)#72 | 17.0%(+7.10)#8,406 |
| 73. | West Park | 24.1% | 13.6%(+10.4)#73 | 17.0%(+7.07)#8,412 |
| 74. | East Newark Borough | 24.0% | 13.6%(+10.4)#74 | 17.0%(+7.02)#8,431 |
| 75. | East Orange | 23.8% | 13.6%(+10.2)#75 | 17.0%(+6.81)#8,509 |
| 76. | Jersey City | 23.7% | 13.6%(+10.1)#76 | 17.0%(+6.74)#8,524 |
| 77. | Sussex Borough | 23.7% | 13.6%(+10.0)#77 | 17.0%(+6.69)#8,539 |
| 78. | Phillipsburg | 23.4% | 13.6%(+9.81)#78 | 17.0%(+6.47)#8,625 |
| 79. | Hampton Borough | 23.2% | 13.6%(+9.53)#79 | 17.0%(+6.18)#8,724 |
| 80. | Avon By The Sea Borough | 23.1% | 13.6%(+9.45)#80 | 17.0%(+6.10)#8,748 |
| 81. | Woodland Park Borough | 23.0% | 13.6%(+9.37)#81 | 17.0%(+6.02)#8,780 |
| 82. | Woodbury | 22.9% | 13.6%(+9.27)#82 | 17.0%(+5.93)#8,807 |
| 83. | Avenel | 21.8% | 13.6%(+8.13)#83 | 17.0%(+4.78)#9,191 |
| 84. | Sewell | 21.7% | 13.6%(+8.04)#84 | 17.0%(+4.69)#9,236 |
| 85. | Ridgefield Park | 21.5% | 13.6%(+7.91)#85 | 17.0%(+4.57)#9,276 |
| 86. | Seabrook Farms | 21.5% | 13.6%(+7.86)#86 | 17.0%(+4.51)#9,294 |
| 87. | Newton | 21.4% | 13.6%(+7.76)#87 | 17.0%(+4.41)#9,357 |
| 88. | North Plainfield Borough | 21.2% | 13.6%(+7.55)#88 | 17.0%(+4.21)#9,429 |
| 89. | Brownville | 20.9% | 13.6%(+7.25)#89 | 17.0%(+3.91)#9,529 |
| 90. | Palisades Park Borough | 20.8% | 13.6%(+7.13)#90 | 17.0%(+3.79)#9,577 |
| 91. | Annandale | 20.8% | 13.6%(+7.12)#91 | 17.0%(+3.78)#9,579 |
| 92. | Carneys Point | 20.7% | 13.6%(+7.07)#92 | 17.0%(+3.73)#9,600 |
| 93. | Englewood | 20.7% | 13.6%(+7.03)#93 | 17.0%(+3.69)#9,621 |
| 94. | Cliffside Park Borough | 20.4% | 13.6%(+6.81)#94 | 17.0%(+3.46)#9,694 |
| 95. | South Bound Brook Borough | 20.4% | 13.6%(+6.78)#95 | 17.0%(+3.43)#9,701 |
| 96. | Guttenberg | 20.3% | 13.6%(+6.71)#96 | 17.0%(+3.36)#9,726 |
| 97. | Gouldtown | 20.3% | 13.6%(+6.64)#97 | 17.0%(+3.29)#9,745 |
| 98. | Morristown | 20.2% | 13.6%(+6.54)#98 | 17.0%(+3.20)#9,764 |
| 99. | Bellmawr Borough | 19.7% | 13.6%(+6.03)#99 | 17.0%(+2.69)#9,999 |
| 100. | East Franklin | 19.4% | 13.6%(+5.72)#100 | 17.0%(+2.38)#10,101 |
Common Questions
What are the Top 10 Cities with the Highest Child Poverty Level Among Girls Under the Age of 16 in New Jersey?
Top 10 Cities with the Highest Child Poverty Level Among Girls Under the Age of 16 in New Jersey are:
#1
100.0%
#2
65.2%
#3
64.4%
#4
64.0%
#5
53.8%
#6
45.2%
#7
45.0%
#8
44.4%
#9
43.2%
#10
42.3%
What city has the Highest Child Poverty Level Among Girls Under the Age of 16 in New Jersey?
Crestwood Village has the Highest Child Poverty Level Among Girls Under the Age of 16 in New Jersey with 100.0%.
What is the Poverty Level Among Girls Under the Age of 16 in the State of New Jersey?
Poverty Level Among Girls Under the Age of 16 in New Jersey is 13.6%.
What is the Poverty Level Among Girls Under the Age of 16 in the United States?
Poverty Level Among Girls Under the Age of 16 in the United States is 17.0%.