Cities with the Highest Percentage of Population Employed in Transportation & Warehousing in New Jersey
RELATED REPORTS & OPTIONS
Transportation & Warehousing
New Jersey
Compare Cities
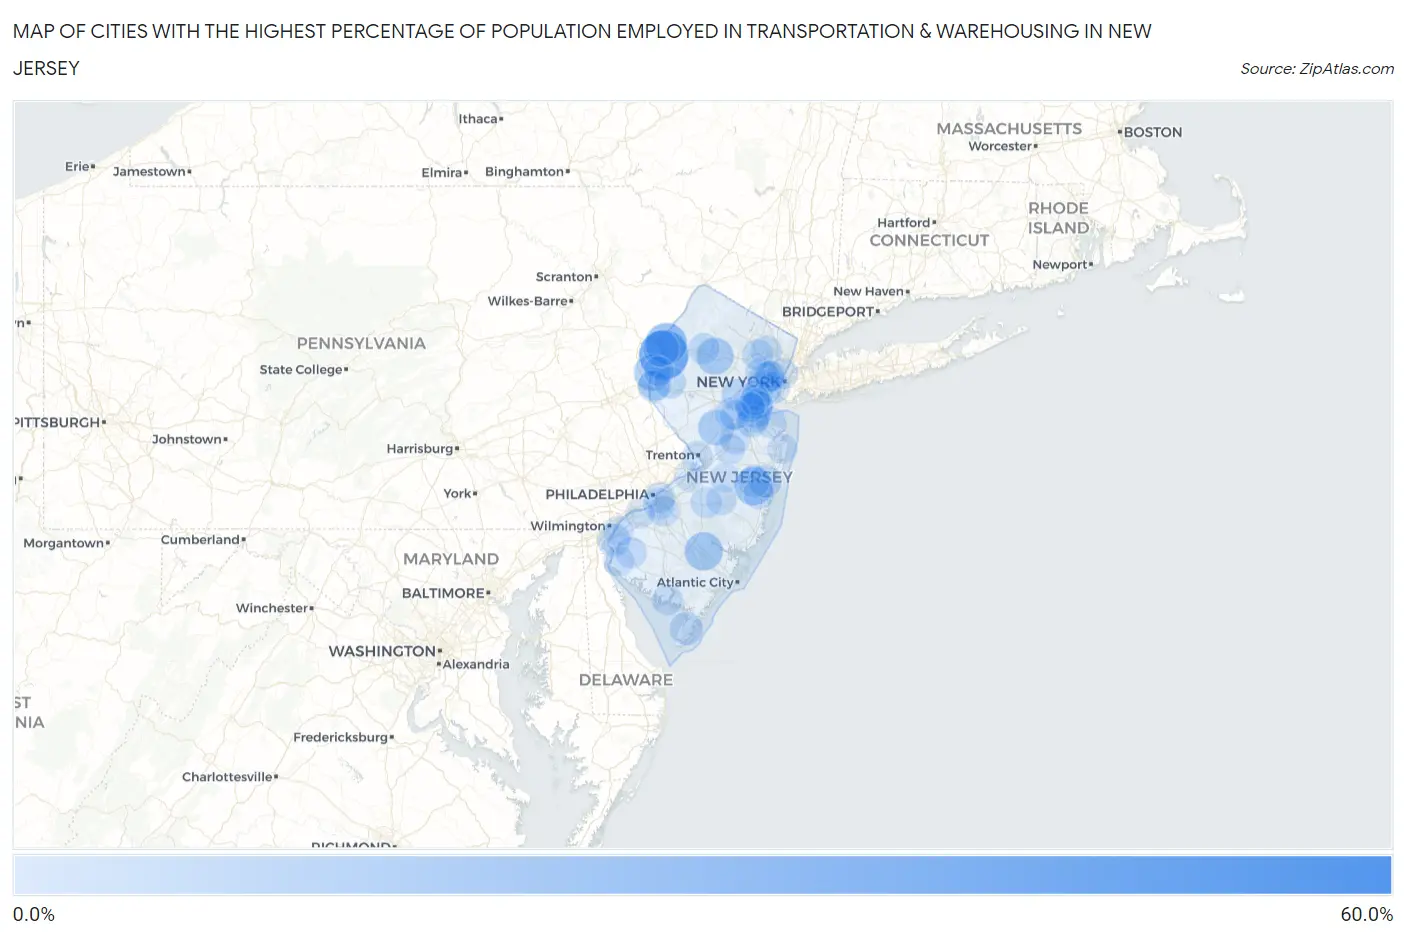
Map of Cities with the Highest Percentage of Population Employed in Transportation & Warehousing in New Jersey
0.0%
60.0%
Cities with the Highest Percentage of Population Employed in Transportation & Warehousing in New Jersey
| City | % Employed | vs State | vs National | |
| 1. | Lamington | 58.1% | 5.8%(+52.4)#1 | 4.9%(+53.2)#76 |
| 2. | Delaware | 42.9% | 5.8%(+37.1)#2 | 4.9%(+37.9)#173 |
| 3. | Gandys Beach | 41.7% | 5.8%(+35.9)#3 | 4.9%(+36.7)#183 |
| 4. | Mizpah | 32.8% | 5.8%(+27.1)#4 | 4.9%(+27.9)#315 |
| 5. | Hainesburg | 28.4% | 5.8%(+22.7)#5 | 4.9%(+23.5)#410 |
| 6. | Elwood | 22.8% | 5.8%(+17.0)#6 | 4.9%(+17.8)#646 |
| 7. | Leisure Village West | 22.7% | 5.8%(+16.9)#7 | 4.9%(+17.8)#652 |
| 8. | Kenvil | 20.5% | 5.8%(+14.7)#8 | 4.9%(+15.5)#795 |
| 9. | Brainards | 20.3% | 5.8%(+14.6)#9 | 4.9%(+15.4)#806 |
| 10. | Columbia | 19.1% | 5.8%(+13.3)#10 | 4.9%(+14.2)#898 |
| 11. | East Rocky Hill | 18.8% | 5.8%(+13.0)#11 | 4.9%(+13.8)#930 |
| 12. | Cumberland-Hesstown | 18.5% | 5.8%(+12.8)#12 | 4.9%(+13.6)#954 |
| 13. | Perth Amboy | 17.8% | 5.8%(+12.0)#13 | 4.9%(+12.8)#1,053 |
| 14. | Grenloch | 17.6% | 5.8%(+11.8)#14 | 4.9%(+12.6)#1,082 |
| 15. | Elizabeth | 16.9% | 5.8%(+11.1)#15 | 4.9%(+12.0)#1,182 |
| 16. | Neshanic | 16.3% | 5.8%(+10.5)#16 | 4.9%(+11.3)#1,302 |
| 17. | Little Ferry Borough | 15.8% | 5.8%(+10.1)#17 | 4.9%(+10.9)#1,359 |
| 18. | Carteret Borough | 15.5% | 5.8%(+9.74)#18 | 4.9%(+10.6)#1,426 |
| 19. | Dutch Neck | 14.8% | 5.8%(+8.99)#19 | 4.9%(+9.81)#1,598 |
| 20. | Roselle Borough | 14.4% | 5.8%(+8.60)#20 | 4.9%(+9.42)#1,688 |
| 21. | Newtonville | 14.3% | 5.8%(+8.52)#21 | 4.9%(+9.34)#1,707 |
| 22. | Ampere North | 14.2% | 5.8%(+8.45)#22 | 4.9%(+9.27)#1,750 |
| 23. | Vauxhall | 13.9% | 5.8%(+8.11)#23 | 4.9%(+8.93)#1,828 |
| 24. | Whitesboro | 13.8% | 5.8%(+8.03)#24 | 4.9%(+8.85)#1,846 |
| 25. | Titusville | 13.8% | 5.8%(+8.00)#25 | 4.9%(+8.82)#1,859 |
| 26. | Leisure Village | 13.6% | 5.8%(+7.81)#26 | 4.9%(+8.62)#1,910 |
| 27. | Sewaren | 13.3% | 5.8%(+7.54)#27 | 4.9%(+8.36)#1,986 |
| 28. | Pennsville | 13.3% | 5.8%(+7.50)#28 | 4.9%(+8.32)#2,000 |
| 29. | South Amboy | 13.0% | 5.8%(+7.27)#29 | 4.9%(+8.09)#2,077 |
| 30. | Fortescue | 12.9% | 5.8%(+7.14)#30 | 4.9%(+7.96)#2,121 |
| 31. | Lopatcong Overlook | 12.8% | 5.8%(+7.00)#31 | 4.9%(+7.82)#2,164 |
| 32. | East Franklin | 12.7% | 5.8%(+6.98)#32 | 4.9%(+7.80)#2,170 |
| 33. | Iselin | 12.6% | 5.8%(+6.87)#33 | 4.9%(+7.69)#2,205 |
| 34. | Newark | 12.4% | 5.8%(+6.61)#34 | 4.9%(+7.43)#2,314 |
| 35. | Hopelawn | 12.4% | 5.8%(+6.59)#35 | 4.9%(+7.41)#2,319 |
| 36. | Plainfield | 12.0% | 5.8%(+6.28)#36 | 4.9%(+7.10)#2,444 |
| 37. | Cedar Glen West | 12.0% | 5.8%(+6.28)#37 | 4.9%(+7.10)#2,445 |
| 38. | Victory Gardens Borough | 11.8% | 5.8%(+5.99)#38 | 4.9%(+6.81)#2,577 |
| 39. | Madison Park | 11.7% | 5.8%(+5.97)#39 | 4.9%(+6.79)#2,582 |
| 40. | Upper Pohatcong | 11.6% | 5.8%(+5.87)#40 | 4.9%(+6.69)#2,622 |
| 41. | East Orange | 11.6% | 5.8%(+5.85)#41 | 4.9%(+6.67)#2,636 |
| 42. | Asbury | 11.6% | 5.8%(+5.81)#42 | 4.9%(+6.63)#2,651 |
| 43. | Bayonne | 11.2% | 5.8%(+5.42)#43 | 4.9%(+6.24)#2,856 |
| 44. | Leisuretowne | 11.1% | 5.8%(+5.33)#44 | 4.9%(+6.15)#2,919 |
| 45. | Swedesboro Borough | 10.9% | 5.8%(+5.18)#45 | 4.9%(+6.00)#2,972 |
| 46. | Byram Center | 10.8% | 5.8%(+5.07)#46 | 4.9%(+5.89)#3,030 |
| 47. | Gloucester City | 10.8% | 5.8%(+5.06)#47 | 4.9%(+5.88)#3,034 |
| 48. | Linden | 10.7% | 5.8%(+4.95)#48 | 4.9%(+5.77)#3,106 |
| 49. | South River Borough | 10.6% | 5.8%(+4.88)#49 | 4.9%(+5.70)#3,144 |
| 50. | Paterson | 10.5% | 5.8%(+4.78)#50 | 4.9%(+5.60)#3,185 |
| 51. | Fieldsboro Borough | 10.5% | 5.8%(+4.77)#51 | 4.9%(+5.59)#3,188 |
| 52. | Singac | 10.5% | 5.8%(+4.69)#52 | 4.9%(+5.51)#3,241 |
| 53. | Westville Borough | 10.4% | 5.8%(+4.66)#53 | 4.9%(+5.48)#3,257 |
| 54. | Alloway | 10.3% | 5.8%(+4.55)#54 | 4.9%(+5.37)#3,341 |
| 55. | Hightstown Borough | 10.3% | 5.8%(+4.53)#55 | 4.9%(+5.35)#3,359 |
| 56. | North Middletown | 10.3% | 5.8%(+4.50)#56 | 4.9%(+5.32)#3,371 |
| 57. | Roselle Park Borough | 10.3% | 5.8%(+4.49)#57 | 4.9%(+5.31)#3,377 |
| 58. | Elmer Borough | 10.3% | 5.8%(+4.49)#58 | 4.9%(+5.31)#3,378 |
| 59. | Rockaway Borough | 10.3% | 5.8%(+4.49)#59 | 4.9%(+5.31)#3,388 |
| 60. | Chesilhurst Borough | 10.1% | 5.8%(+4.35)#60 | 4.9%(+5.17)#3,463 |
| 61. | Union City | 10.1% | 5.8%(+4.34)#61 | 4.9%(+5.16)#3,473 |
| 62. | Port Reading | 10.1% | 5.8%(+4.32)#62 | 4.9%(+5.14)#3,484 |
| 63. | Silver Ridge | 10.0% | 5.8%(+4.27)#63 | 4.9%(+5.09)#3,515 |
| 64. | Camden | 10.0% | 5.8%(+4.24)#64 | 4.9%(+5.06)#3,518 |
| 65. | Whittingham | 9.9% | 5.8%(+4.15)#65 | 4.9%(+4.97)#3,591 |
| 66. | Trenton | 9.9% | 5.8%(+4.14)#66 | 4.9%(+4.96)#3,605 |
| 67. | Kearny | 9.9% | 5.8%(+4.10)#67 | 4.9%(+4.92)#3,633 |
| 68. | Port Norris | 9.8% | 5.8%(+4.07)#68 | 4.9%(+4.89)#3,653 |
| 69. | Cologne | 9.8% | 5.8%(+4.03)#69 | 4.9%(+4.85)#3,685 |
| 70. | Lawnside Borough | 9.7% | 5.8%(+3.90)#70 | 4.9%(+4.72)#3,773 |
| 71. | Harrison | 9.6% | 5.8%(+3.88)#71 | 4.9%(+4.70)#3,790 |
| 72. | Glendora | 9.6% | 5.8%(+3.86)#72 | 4.9%(+4.68)#3,810 |
| 73. | Cranford | 9.6% | 5.8%(+3.85)#73 | 4.9%(+4.67)#3,812 |
| 74. | Menlo Park Terrace | 9.6% | 5.8%(+3.81)#74 | 4.9%(+4.63)#3,856 |
| 75. | Sayreville Borough | 9.4% | 5.8%(+3.63)#75 | 4.9%(+4.45)#3,986 |
| 76. | Clearbrook | 9.3% | 5.8%(+3.53)#76 | 4.9%(+4.35)#4,060 |
| 77. | Dunellen Borough | 9.2% | 5.8%(+3.46)#77 | 4.9%(+4.28)#4,110 |
| 78. | Hancocks Bridge | 9.2% | 5.8%(+3.40)#78 | 4.9%(+4.22)#4,157 |
| 79. | Presidential Lakes Estates | 9.1% | 5.8%(+3.32)#79 | 4.9%(+4.14)#4,254 |
| 80. | Oakhurst | 9.0% | 5.8%(+3.22)#80 | 4.9%(+4.04)#4,323 |
| 81. | Carneys Point | 9.0% | 5.8%(+3.21)#81 | 4.9%(+4.03)#4,329 |
| 82. | Palmyra Borough | 9.0% | 5.8%(+3.19)#82 | 4.9%(+4.01)#4,347 |
| 83. | Jamesburg Borough | 8.9% | 5.8%(+3.15)#83 | 4.9%(+3.97)#4,381 |
| 84. | Twin Rivers | 8.9% | 5.8%(+3.14)#84 | 4.9%(+3.96)#4,398 |
| 85. | Avenel | 8.8% | 5.8%(+3.04)#85 | 4.9%(+3.86)#4,489 |
| 86. | Keyport Borough | 8.8% | 5.8%(+3.04)#86 | 4.9%(+3.86)#4,495 |
| 87. | Franklinville | 8.8% | 5.8%(+3.03)#87 | 4.9%(+3.85)#4,502 |
| 88. | New Brunswick | 8.7% | 5.8%(+2.97)#88 | 4.9%(+3.79)#4,554 |
| 89. | Monroe Manor | 8.7% | 5.8%(+2.96)#89 | 4.9%(+3.78)#4,568 |
| 90. | Alpha Borough | 8.7% | 5.8%(+2.91)#90 | 4.9%(+3.73)#4,627 |
| 91. | Lindenwold Borough | 8.6% | 5.8%(+2.82)#91 | 4.9%(+3.64)#4,717 |
| 92. | Freehold Borough | 8.5% | 5.8%(+2.75)#92 | 4.9%(+3.57)#4,776 |
| 93. | Fords | 8.4% | 5.8%(+2.68)#93 | 4.9%(+3.50)#4,850 |
| 94. | Gouldtown | 8.4% | 5.8%(+2.67)#94 | 4.9%(+3.49)#4,867 |
| 95. | Gibbstown | 8.4% | 5.8%(+2.66)#95 | 4.9%(+3.48)#4,870 |
| 96. | New Egypt | 8.4% | 5.8%(+2.62)#96 | 4.9%(+3.44)#4,910 |
| 97. | Riverdale Borough | 8.3% | 5.8%(+2.52)#97 | 4.9%(+3.33)#5,041 |
| 98. | Haledon Borough | 8.2% | 5.8%(+2.45)#98 | 4.9%(+3.27)#5,111 |
| 99. | Hutchinson | 8.2% | 5.8%(+2.45)#99 | 4.9%(+3.27)#5,117 |
| 100. | Burlington | 8.2% | 5.8%(+2.44)#100 | 4.9%(+3.26)#5,127 |
Common Questions
What are the Top 10 Cities with the Highest Percentage of Population Employed in Transportation & Warehousing in New Jersey?
Top 10 Cities with the Highest Percentage of Population Employed in Transportation & Warehousing in New Jersey are:
#1
42.9%
#2
28.4%
#3
22.8%
#4
22.7%
#5
20.5%
#6
20.3%
#7
19.1%
#8
18.8%
#9
17.8%
#10
16.9%
What city has the Highest Percentage of Population Employed in Transportation & Warehousing in New Jersey?
Delaware has the Highest Percentage of Population Employed in Transportation & Warehousing in New Jersey with 42.9%.
What is the Percentage of Population Employed in Transportation & Warehousing in the State of New Jersey?
Percentage of Population Employed in Transportation & Warehousing in New Jersey is 5.8%.
What is the Percentage of Population Employed in Transportation & Warehousing in the United States?
Percentage of Population Employed in Transportation & Warehousing in the United States is 4.9%.