East Rutherford borough, NJ Map & Demographics
East Rutherford borough Overview
$48,616
PER CAPITA INCOME
$110,271
AVG FAMILY INCOME
$92,536
AVG HOUSEHOLD INCOME
27.7%
WAGE / INCOME GAP [ % ]
72.3¢/ $1
WAGE / INCOME GAP [ $ ]
0.43
INEQUALITY / GINI INDEX
10,020
TOTAL POPULATION
4,683
MALE POPULATION
5,337
FEMALE POPULATION
87.75
MALES / 100 FEMALES
113.97
FEMALES / 100 MALES
38.3
MEDIAN AGE
3.0
AVG FAMILY SIZE
2.4
AVG HOUSEHOLD SIZE
5,896
LABOR FORCE [ PEOPLE ]
69.5%
PERCENT IN LABOR FORCE
4.2%
UNEMPLOYMENT RATE
Income in East Rutherford borough
Income Overview in East Rutherford borough
Per Capita Income in East Rutherford borough is $48,616, while median incomes of families and households are $110,271 and $92,536 respectively.
| Characteristic | Number | Measure |
| Per Capita Income | 10,020 | $48,616 |
| Median Family Income | 2,523 | $110,271 |
| Mean Family Income | 2,523 | $129,105 |
| Median Household Income | 4,258 | $92,536 |
| Mean Household Income | 4,258 | $113,668 |
| Income Deficit | 2,523 | $0 |
| Wage / Income Gap (%) | 10,020 | 27.73% |
| Wage / Income Gap ($) | 10,020 | 72.27¢ per $1 |
| Gini / Inequality Index | 10,020 | 0.43 |
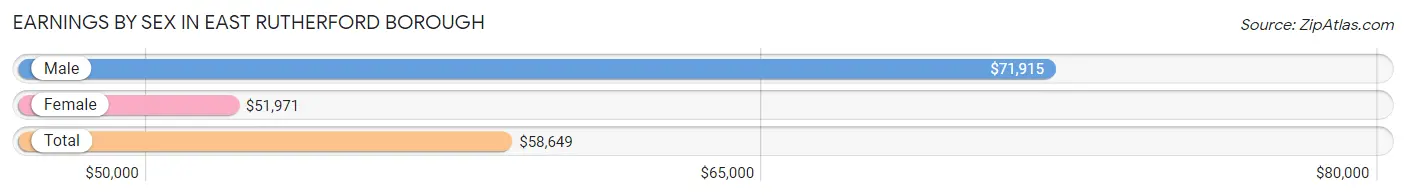
Earnings by Sex in East Rutherford borough
Average Earnings in East Rutherford borough are $58,649, $71,915 for men and $51,971 for women, a difference of 27.7%.
| Sex | Number | Average Earnings |
| Male | 2,870 (48.3%) | $71,915 |
| Female | 3,070 (51.7%) | $51,971 |
| Total | 5,940 (100.0%) | $58,649 |
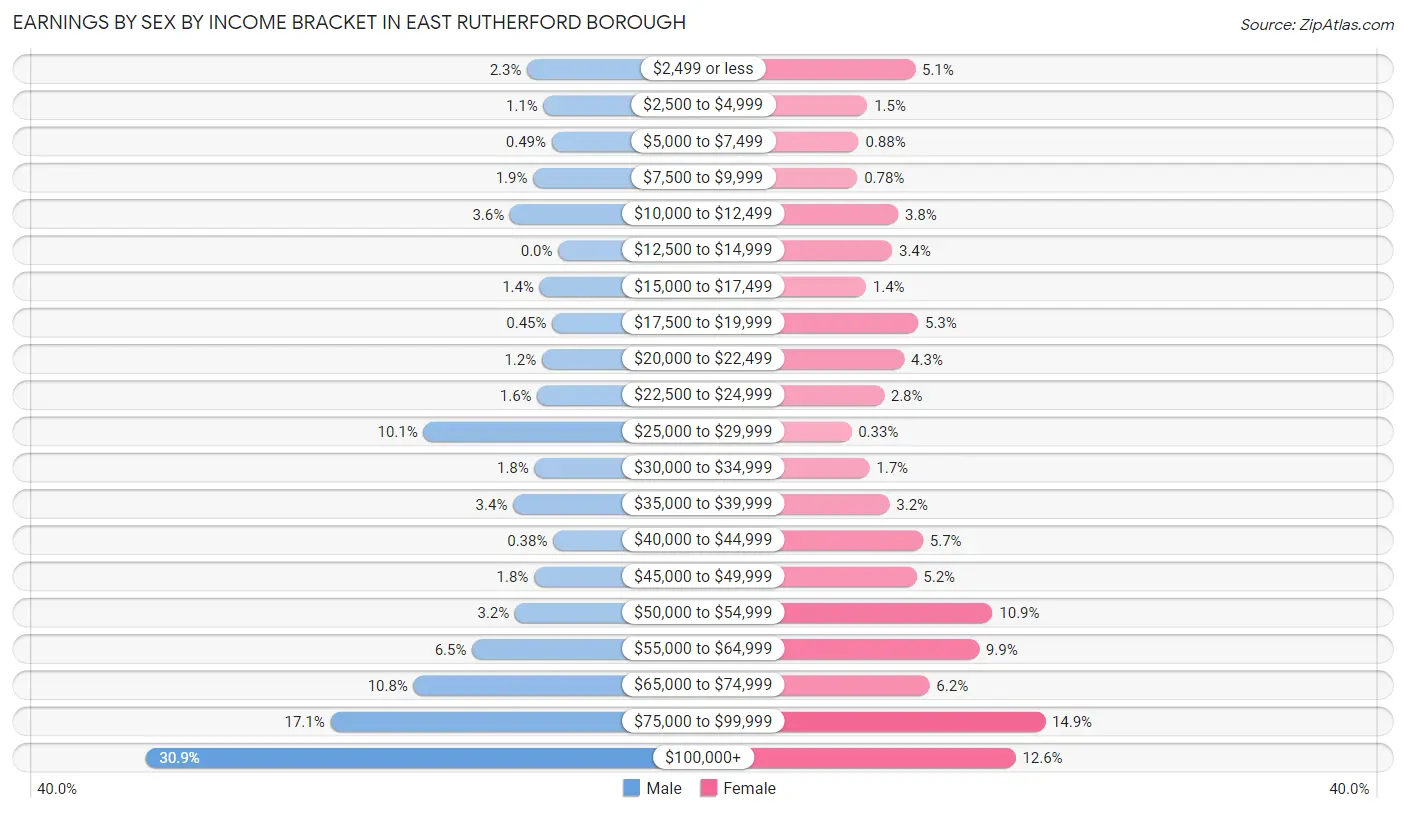
Earnings by Sex by Income Bracket in East Rutherford borough
The most common earnings brackets in East Rutherford borough are $100,000+ for men (886 | 30.9%) and $75,000 to $99,999 for women (456 | 14.8%).
| Income | Male | Female |
| $2,499 or less | 67 (2.3%) | 157 (5.1%) |
| $2,500 to $4,999 | 32 (1.1%) | 47 (1.5%) |
| $5,000 to $7,499 | 14 (0.5%) | 27 (0.9%) |
| $7,500 to $9,999 | 54 (1.9%) | 24 (0.8%) |
| $10,000 to $12,499 | 104 (3.6%) | 118 (3.8%) |
| $12,500 to $14,999 | 0 (0.0%) | 104 (3.4%) |
| $15,000 to $17,499 | 40 (1.4%) | 44 (1.4%) |
| $17,500 to $19,999 | 13 (0.4%) | 164 (5.3%) |
| $20,000 to $22,499 | 35 (1.2%) | 132 (4.3%) |
| $22,500 to $24,999 | 45 (1.6%) | 85 (2.8%) |
| $25,000 to $29,999 | 290 (10.1%) | 10 (0.3%) |
| $30,000 to $34,999 | 51 (1.8%) | 52 (1.7%) |
| $35,000 to $39,999 | 97 (3.4%) | 98 (3.2%) |
| $40,000 to $44,999 | 11 (0.4%) | 175 (5.7%) |
| $45,000 to $49,999 | 52 (1.8%) | 160 (5.2%) |
| $50,000 to $54,999 | 93 (3.2%) | 335 (10.9%) |
| $55,000 to $64,999 | 185 (6.5%) | 304 (9.9%) |
| $65,000 to $74,999 | 311 (10.8%) | 190 (6.2%) |
| $75,000 to $99,999 | 490 (17.1%) | 456 (14.8%) |
| $100,000+ | 886 (30.9%) | 388 (12.6%) |
| Total | 2,870 (100.0%) | 3,070 (100.0%) |
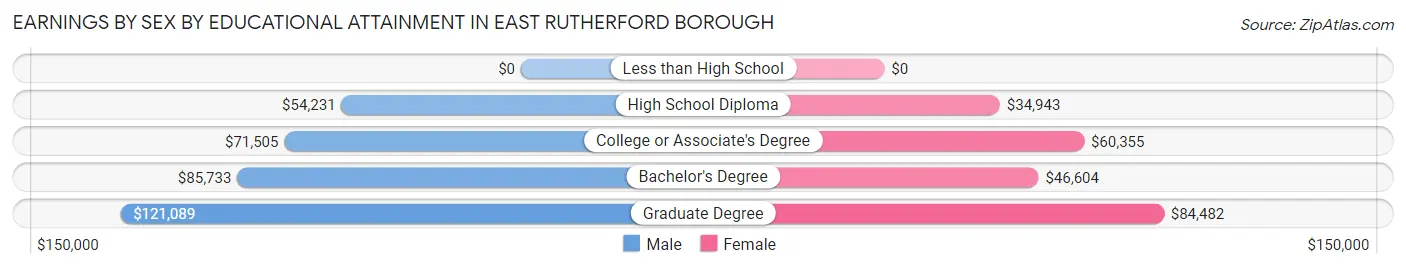
Earnings by Sex by Educational Attainment in East Rutherford borough
Average earnings in East Rutherford borough are $77,791 for men and $54,602 for women, a difference of 29.8%. Men with an educational attainment of graduate degree enjoy the highest average annual earnings of $121,089, while those with high school diploma education earn the least with $54,231. Women with an educational attainment of graduate degree earn the most with the average annual earnings of $84,482, while those with high school diploma education have the smallest earnings of $34,943.
| Educational Attainment | Male Income | Female Income |
| Less than High School | - | - |
| High School Diploma | $54,231 | $34,943 |
| College or Associate's Degree | $71,505 | $60,355 |
| Bachelor's Degree | $85,733 | $46,604 |
| Graduate Degree | $121,089 | $84,482 |
| Total | $77,791 | $54,602 |
Family Income in East Rutherford borough
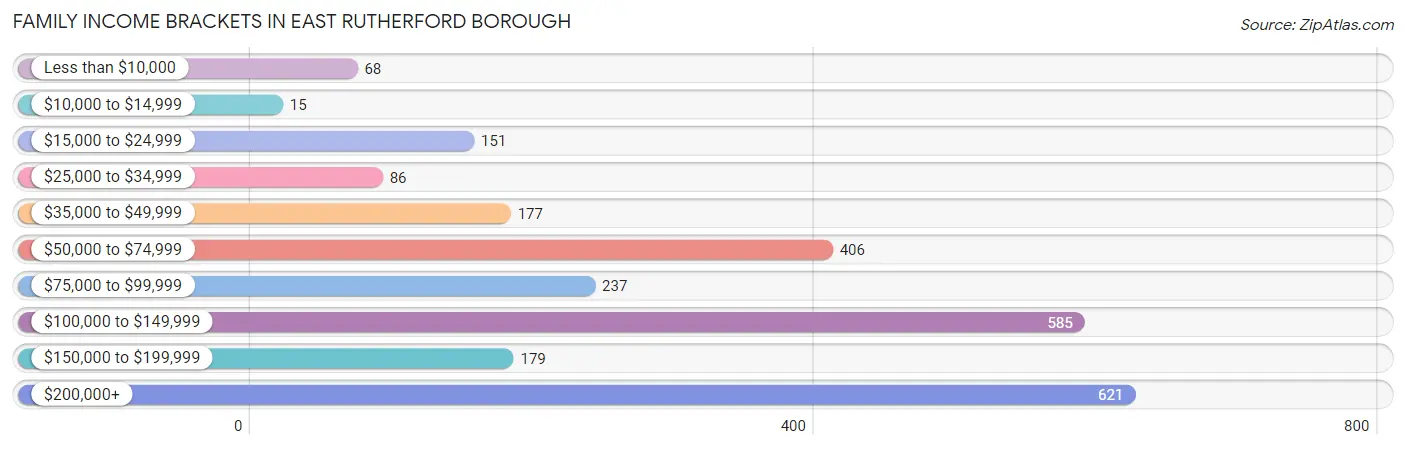
Family Income Brackets in East Rutherford borough
According to the East Rutherford borough family income data, there are 621 families falling into the $200,000+ income range, which is the most common income bracket and makes up 24.6% of all families. Conversely, the $10,000 to $14,999 income bracket is the least frequent group with only 15 families (0.6%) belonging to this category.
| Income Bracket | # Families | % Families |
| Less than $10,000 | 68 | 2.7% |
| $10,000 to $14,999 | 15 | 0.6% |
| $15,000 to $24,999 | 151 | 6.0% |
| $25,000 to $34,999 | 86 | 3.4% |
| $35,000 to $49,999 | 177 | 7.0% |
| $50,000 to $74,999 | 406 | 16.1% |
| $75,000 to $99,999 | 237 | 9.4% |
| $100,000 to $149,999 | 585 | 23.2% |
| $150,000 to $199,999 | 179 | 7.1% |
| $200,000+ | 621 | 24.6% |
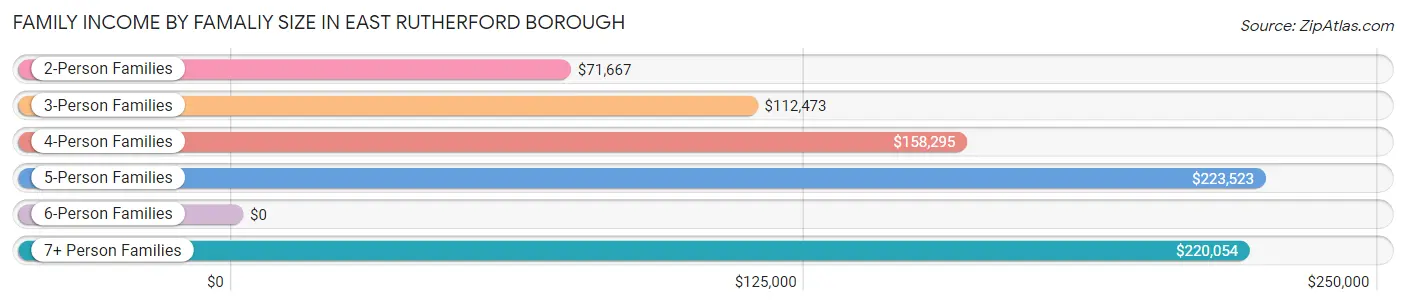
Family Income by Famaliy Size in East Rutherford borough
5-person families (219 | 8.7%) account for the highest median family income in East Rutherford borough with $223,523 per family, while 5-person families (219 | 8.7%) have the highest median income of $44,705 per family member.
| Income Bracket | # Families | Median Income |
| 2-Person Families | 1,194 (47.3%) | $71,667 |
| 3-Person Families | 716 (28.4%) | $112,473 |
| 4-Person Families | 349 (13.8%) | $158,295 |
| 5-Person Families | 219 (8.7%) | $223,523 |
| 6-Person Families | 0 (0.0%) | $0 |
| 7+ Person Families | 45 (1.8%) | $220,054 |
| Total | 2,523 (100.0%) | $110,271 |
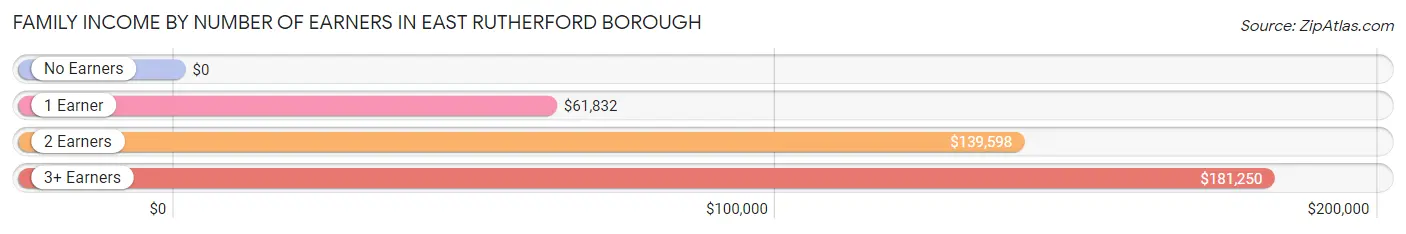
Family Income by Number of Earners in East Rutherford borough
| Number of Earners | # Families | Median Income |
| No Earners | 135 (5.3%) | $0 |
| 1 Earner | 1,021 (40.5%) | $61,832 |
| 2 Earners | 1,075 (42.6%) | $139,598 |
| 3+ Earners | 292 (11.6%) | $181,250 |
| Total | 2,523 (100.0%) | $110,271 |
Household Income in East Rutherford borough
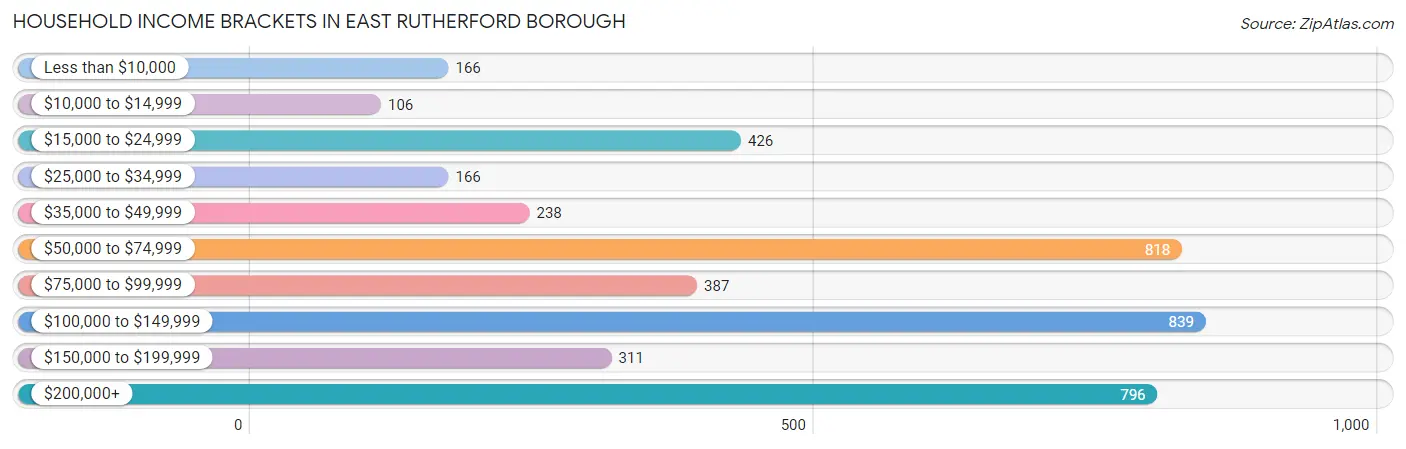
Household Income Brackets in East Rutherford borough
With 839 households falling in the category, the $100,000 to $149,999 income range is the most frequent in East Rutherford borough, accounting for 19.7% of all households. In contrast, only 106 households (2.5%) fall into the $10,000 to $14,999 income bracket, making it the least populous group.
| Income Bracket | # Households | % Households |
| Less than $10,000 | 166 | 3.9% |
| $10,000 to $14,999 | 106 | 2.5% |
| $15,000 to $24,999 | 426 | 10.0% |
| $25,000 to $34,999 | 166 | 3.9% |
| $35,000 to $49,999 | 238 | 5.6% |
| $50,000 to $74,999 | 818 | 19.2% |
| $75,000 to $99,999 | 387 | 9.1% |
| $100,000 to $149,999 | 839 | 19.7% |
| $150,000 to $199,999 | 311 | 7.3% |
| $200,000+ | 796 | 18.7% |
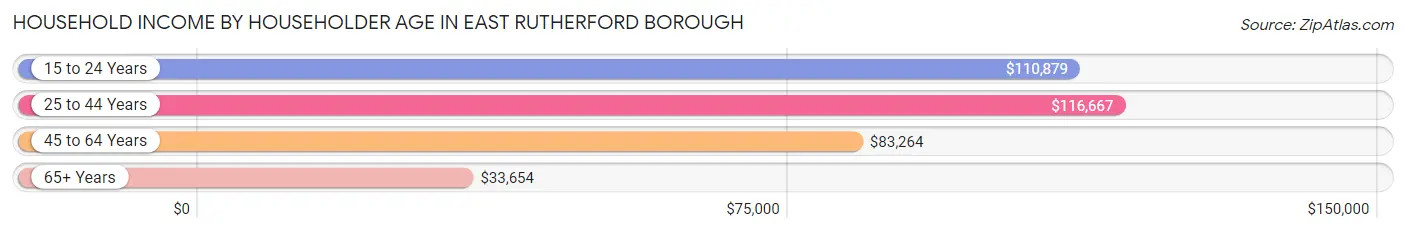
Household Income by Householder Age in East Rutherford borough
The median household income in East Rutherford borough is $92,536, with the highest median household income of $116,667 found in the 25 to 44 years age bracket for the primary householder. A total of 1,764 households (41.4%) fall into this category. Meanwhile, the 65+ years age bracket for the primary householder has the lowest median household income of $33,654, with 940 households (22.1%) in this group.
| Income Bracket | # Households | Median Income |
| 15 to 24 Years | 220 (5.2%) | $110,879 |
| 25 to 44 Years | 1,764 (41.4%) | $116,667 |
| 45 to 64 Years | 1,334 (31.3%) | $83,264 |
| 65+ Years | 940 (22.1%) | $33,654 |
| Total | 4,258 (100.0%) | $92,536 |
Poverty in East Rutherford borough
Income Below Poverty by Sex and Age in East Rutherford borough
With 7.0% poverty level for males and 4.6% for females among the residents of East Rutherford borough, 75 year old and over males and 75 year old and over females are the most vulnerable to poverty, with 26 males (17.1%) and 92 females (26.6%) in their respective age groups living below the poverty level.
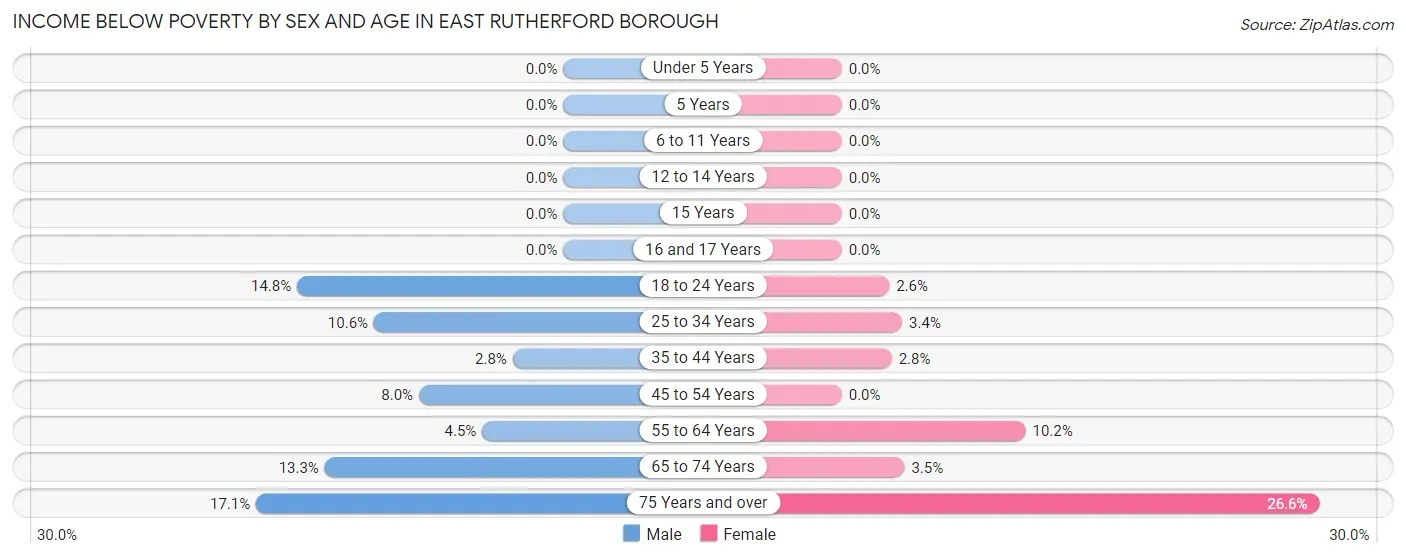
| Age Bracket | Male | Female |
| Under 5 Years | 0 (0.0%) | 0 (0.0%) |
| 5 Years | 0 (0.0%) | 0 (0.0%) |
| 6 to 11 Years | 0 (0.0%) | 0 (0.0%) |
| 12 to 14 Years | 0 (0.0%) | 0 (0.0%) |
| 15 Years | 0 (0.0%) | 0 (0.0%) |
| 16 and 17 Years | 0 (0.0%) | 0 (0.0%) |
| 18 to 24 Years | 66 (14.8%) | 14 (2.6%) |
| 25 to 34 Years | 89 (10.5%) | 35 (3.4%) |
| 35 to 44 Years | 29 (2.8%) | 22 (2.8%) |
| 45 to 54 Years | 32 (8.0%) | 0 (0.0%) |
| 55 to 64 Years | 25 (4.5%) | 68 (10.2%) |
| 65 to 74 Years | 57 (13.3%) | 16 (3.5%) |
| 75 Years and over | 26 (17.1%) | 92 (26.6%) |
| Total | 324 (7.0%) | 247 (4.6%) |
Income Above Poverty by Sex and Age in East Rutherford borough
According to the poverty statistics in East Rutherford borough, males aged under 5 years and females aged under 5 years are the age groups that are most secure financially, with 100.0% of males and 100.0% of females in these age groups living above the poverty line.
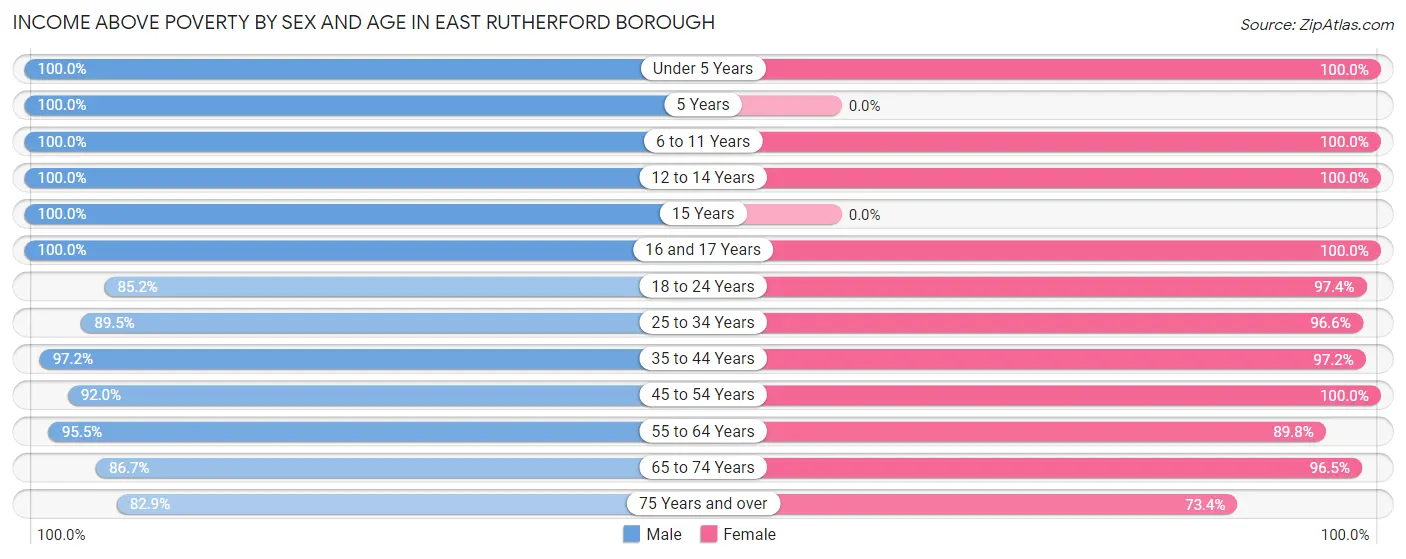
| Age Bracket | Male | Female |
| Under 5 Years | 392 (100.0%) | 506 (100.0%) |
| 5 Years | 100 (100.0%) | 0 (0.0%) |
| 6 to 11 Years | 164 (100.0%) | 76 (100.0%) |
| 12 to 14 Years | 95 (100.0%) | 139 (100.0%) |
| 15 Years | 38 (100.0%) | 0 (0.0%) |
| 16 and 17 Years | 17 (100.0%) | 98 (100.0%) |
| 18 to 24 Years | 379 (85.2%) | 517 (97.4%) |
| 25 to 34 Years | 755 (89.4%) | 1,008 (96.6%) |
| 35 to 44 Years | 1,001 (97.2%) | 769 (97.2%) |
| 45 to 54 Years | 366 (92.0%) | 683 (100.0%) |
| 55 to 64 Years | 528 (95.5%) | 597 (89.8%) |
| 65 to 74 Years | 372 (86.7%) | 443 (96.5%) |
| 75 Years and over | 126 (82.9%) | 254 (73.4%) |
| Total | 4,333 (93.0%) | 5,090 (95.4%) |
Income Below Poverty Among Married-Couple Families in East Rutherford borough
The poverty statistics for married-couple families in East Rutherford borough show that 2.9% or 48 of the total 1,680 families live below the poverty line. Families with no children have the highest poverty rate of 6.0%, comprising of 48 families. On the other hand, families with 1 or 2 children have the lowest poverty rate of 0.0%, which includes 0 families.
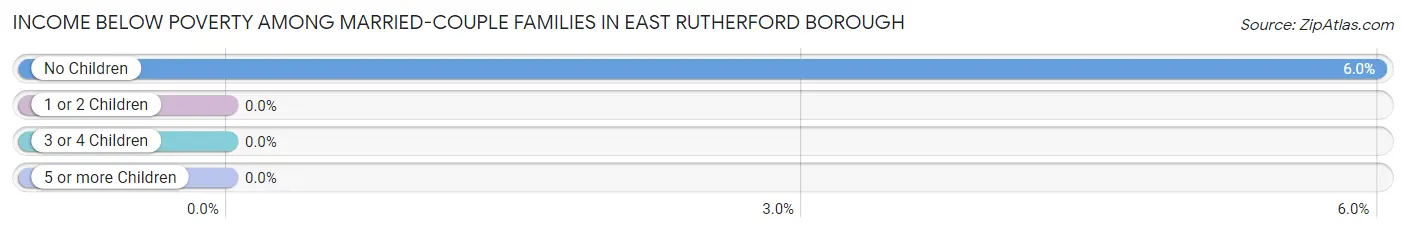
| Children | Above Poverty | Below Poverty |
| No Children | 752 (94.0%) | 48 (6.0%) |
| 1 or 2 Children | 801 (100.0%) | 0 (0.0%) |
| 3 or 4 Children | 79 (100.0%) | 0 (0.0%) |
| 5 or more Children | 0 (0.0%) | 0 (0.0%) |
| Total | 1,632 (97.1%) | 48 (2.9%) |
Income Below Poverty Among Single-Parent Households in East Rutherford borough
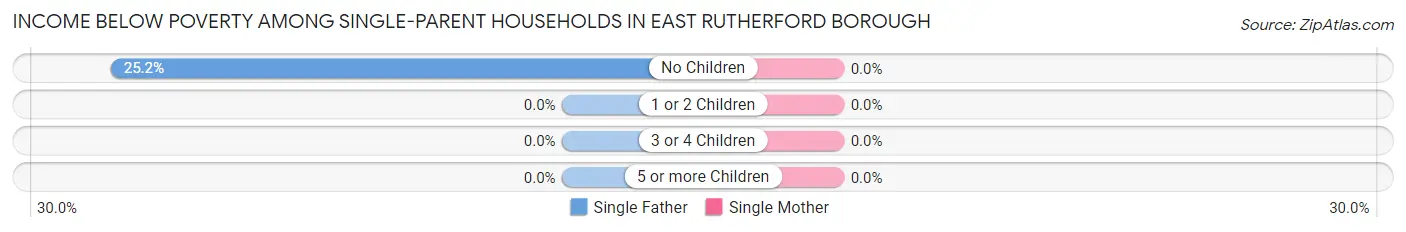
| Children | Single Father | Single Mother |
| No Children | 35 (25.2%) | 0 (0.0%) |
| 1 or 2 Children | 0 (0.0%) | 0 (0.0%) |
| 3 or 4 Children | 0 (0.0%) | 0 (0.0%) |
| 5 or more Children | 0 (0.0%) | 0 (0.0%) |
| Total | 35 (18.3%) | 0 (0.0%) |
Income Below Poverty Among Married-Couple vs Single-Parent Households in East Rutherford borough
The poverty data for East Rutherford borough shows that 48 of the married-couple family households (2.9%) and 35 of the single-parent households (4.2%) are living below the poverty level. Within the married-couple family households, those with no children have the highest poverty rate, with 48 households (6.0%) falling below the poverty line. Among the single-parent households, those with no children have the highest poverty rate, with 35 household (5.8%) living below poverty.
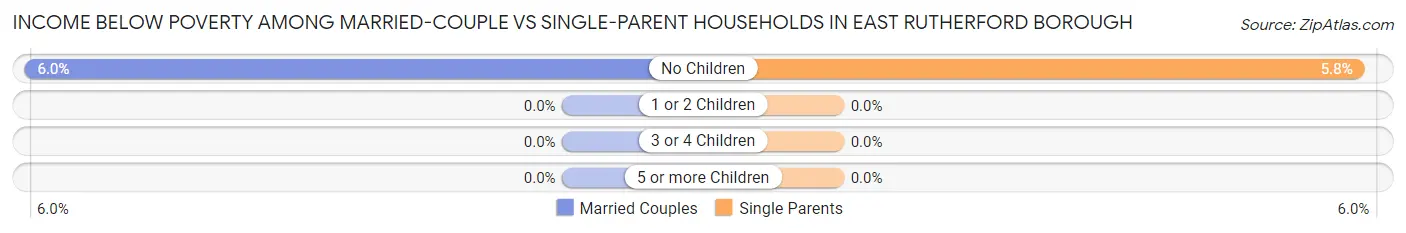
| Children | Married-Couple Families | Single-Parent Households |
| No Children | 48 (6.0%) | 35 (5.8%) |
| 1 or 2 Children | 0 (0.0%) | 0 (0.0%) |
| 3 or 4 Children | 0 (0.0%) | 0 (0.0%) |
| 5 or more Children | 0 (0.0%) | 0 (0.0%) |
| Total | 48 (2.9%) | 35 (4.2%) |
Race in East Rutherford borough
The most populous races in East Rutherford borough are White / Caucasian (5,603 | 55.9%), Asian (2,516 | 25.1%), and Hispanic or Latino (1,874 | 18.7%).
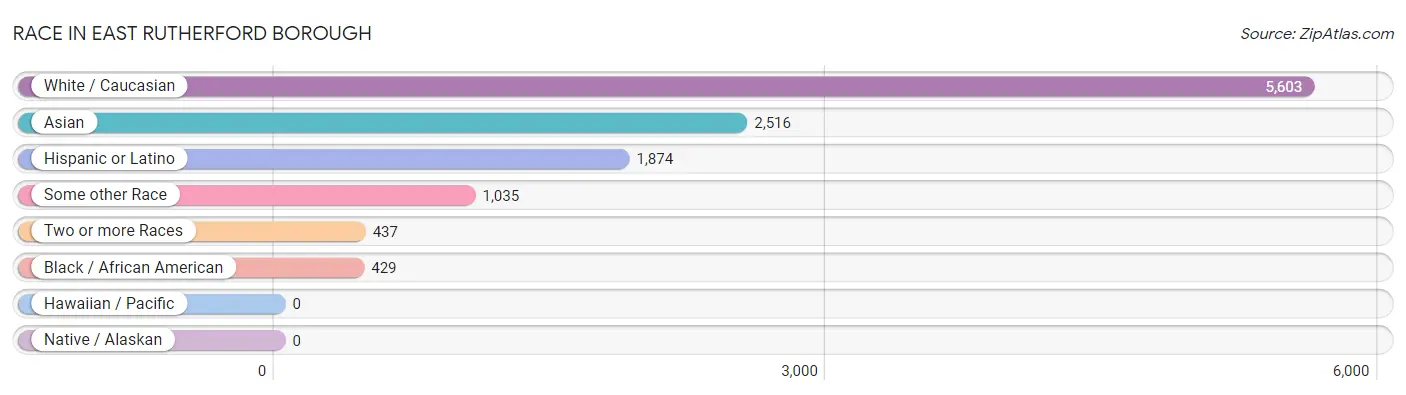
| Race | # Population | % Population |
| Asian | 2,516 | 25.1% |
| Black / African American | 429 | 4.3% |
| Hawaiian / Pacific | 0 | 0.0% |
| Hispanic or Latino | 1,874 | 18.7% |
| Native / Alaskan | 0 | 0.0% |
| White / Caucasian | 5,603 | 55.9% |
| Two or more Races | 437 | 4.4% |
| Some other Race | 1,035 | 10.3% |
| Total | 10,020 | 100.0% |
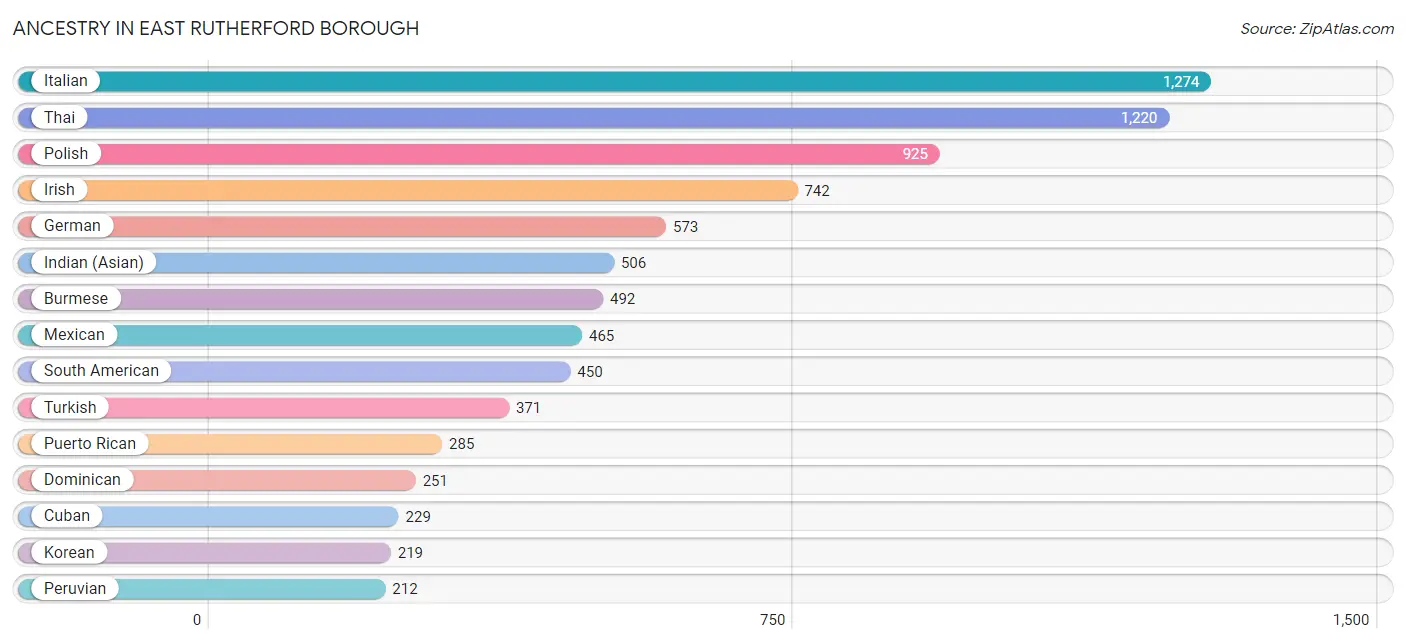
Ancestry in East Rutherford borough
The most populous ancestries reported in East Rutherford borough are Italian (1,274 | 12.7%), Thai (1,220 | 12.2%), Polish (925 | 9.2%), Irish (742 | 7.4%), and German (573 | 5.7%), together accounting for 47.3% of all East Rutherford borough residents.
| Ancestry | # Population | % Population |
| American | 151 | 1.5% |
| Arab | 59 | 0.6% |
| Argentinean | 14 | 0.1% |
| Armenian | 71 | 0.7% |
| Austrian | 63 | 0.6% |
| Bhutanese | 39 | 0.4% |
| Brazilian | 40 | 0.4% |
| Burmese | 492 | 4.9% |
| Central American Indian | 23 | 0.2% |
| Cherokee | 17 | 0.2% |
| Colombian | 187 | 1.9% |
| Croatian | 31 | 0.3% |
| Cuban | 229 | 2.3% |
| Czech | 21 | 0.2% |
| Dominican | 251 | 2.5% |
| Dutch | 18 | 0.2% |
| Eastern European | 18 | 0.2% |
| Ecuadorian | 37 | 0.4% |
| English | 15 | 0.2% |
| European | 21 | 0.2% |
| French | 20 | 0.2% |
| French Canadian | 10 | 0.1% |
| German | 573 | 5.7% |
| Greek | 31 | 0.3% |
| Hungarian | 10 | 0.1% |
| Indian (Asian) | 506 | 5.1% |
| Irish | 742 | 7.4% |
| Italian | 1,274 | 12.7% |
| Jamaican | 79 | 0.8% |
| Jordanian | 32 | 0.3% |
| Korean | 219 | 2.2% |
| Lithuanian | 31 | 0.3% |
| Macedonian | 34 | 0.3% |
| Maltese | 1 | 0.0% |
| Mexican | 465 | 4.6% |
| Moroccan | 18 | 0.2% |
| New Zealander | 10 | 0.1% |
| Pakistani | 105 | 1.1% |
| Peruvian | 212 | 2.1% |
| Polish | 925 | 9.2% |
| Portuguese | 68 | 0.7% |
| Puerto Rican | 285 | 2.8% |
| Russian | 93 | 0.9% |
| Scandinavian | 13 | 0.1% |
| Scotch-Irish | 39 | 0.4% |
| Scottish | 128 | 1.3% |
| Slavic | 1 | 0.0% |
| Slovak | 41 | 0.4% |
| South American | 450 | 4.5% |
| Spaniard | 84 | 0.8% |
| Swedish | 15 | 0.2% |
| Swiss | 19 | 0.2% |
| Syrian | 18 | 0.2% |
| Thai | 1,220 | 12.2% |
| Turkish | 371 | 3.7% |
| Ukrainian | 168 | 1.7% |
| Welsh | 32 | 0.3% | View All 57 Rows |
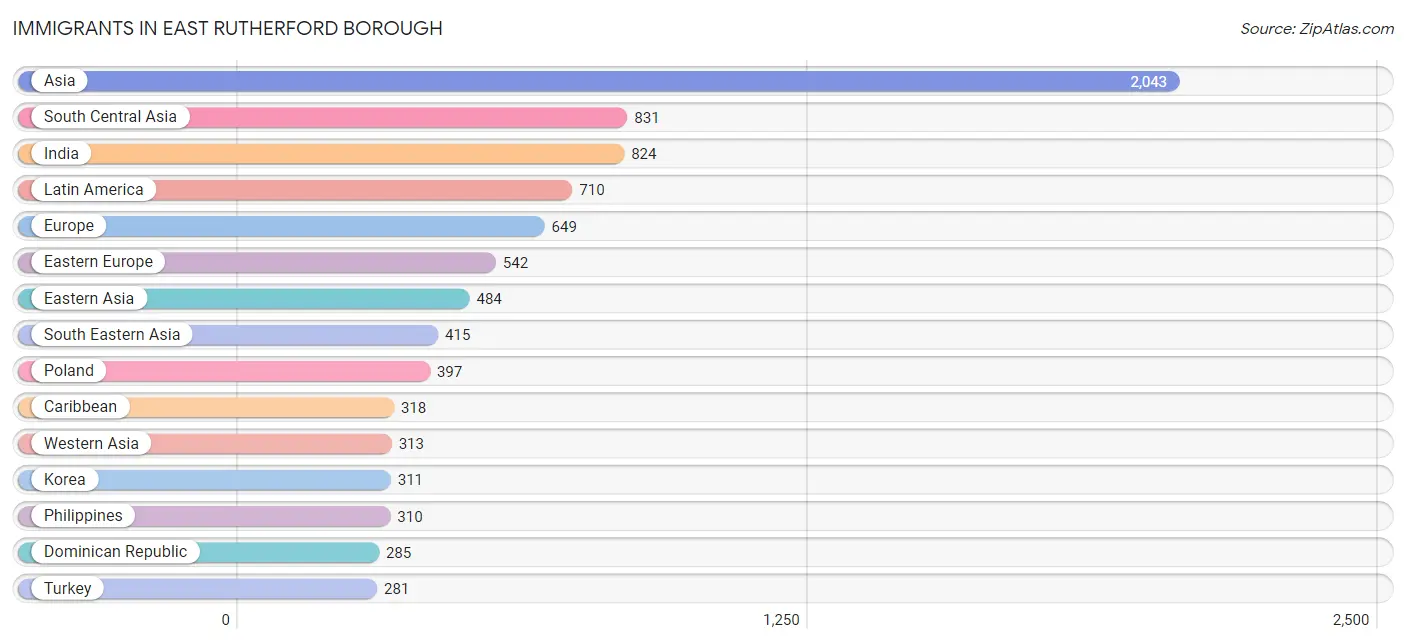
Immigrants in East Rutherford borough
The most numerous immigrant groups reported in East Rutherford borough came from Asia (2,043 | 20.4%), South Central Asia (831 | 8.3%), India (824 | 8.2%), Latin America (710 | 7.1%), and Europe (649 | 6.5%), together accounting for 50.5% of all East Rutherford borough residents.
| Immigration Origin | # Population | % Population |
| Africa | 31 | 0.3% |
| Asia | 2,043 | 20.4% |
| Bosnia and Herzegovina | 28 | 0.3% |
| Brazil | 15 | 0.2% |
| Bulgaria | 18 | 0.2% |
| Canada | 20 | 0.2% |
| Caribbean | 318 | 3.2% |
| Central America | 209 | 2.1% |
| China | 173 | 1.7% |
| Colombia | 61 | 0.6% |
| Croatia | 9 | 0.1% |
| Czechoslovakia | 18 | 0.2% |
| Dominican Republic | 285 | 2.8% |
| Eastern Asia | 484 | 4.8% |
| Eastern Europe | 542 | 5.4% |
| Europe | 649 | 6.5% |
| Hong Kong | 5 | 0.1% |
| India | 824 | 8.2% |
| Italy | 39 | 0.4% |
| Jordan | 32 | 0.3% |
| Korea | 311 | 3.1% |
| Latin America | 710 | 7.1% |
| Mexico | 209 | 2.1% |
| Morocco | 31 | 0.3% |
| North Macedonia | 51 | 0.5% |
| Northern Africa | 31 | 0.3% |
| Northern Europe | 25 | 0.3% |
| Pakistan | 7 | 0.1% |
| Peru | 107 | 1.1% |
| Philippines | 310 | 3.1% |
| Poland | 397 | 4.0% |
| Portugal | 21 | 0.2% |
| Scotland | 10 | 0.1% |
| South America | 183 | 1.8% |
| South Central Asia | 831 | 8.3% |
| South Eastern Asia | 415 | 4.1% |
| Southern Europe | 82 | 0.8% |
| Spain | 21 | 0.2% |
| Sweden | 15 | 0.2% |
| Thailand | 105 | 1.1% |
| Turkey | 281 | 2.8% |
| Ukraine | 21 | 0.2% |
| Western Asia | 313 | 3.1% | View All 43 Rows |
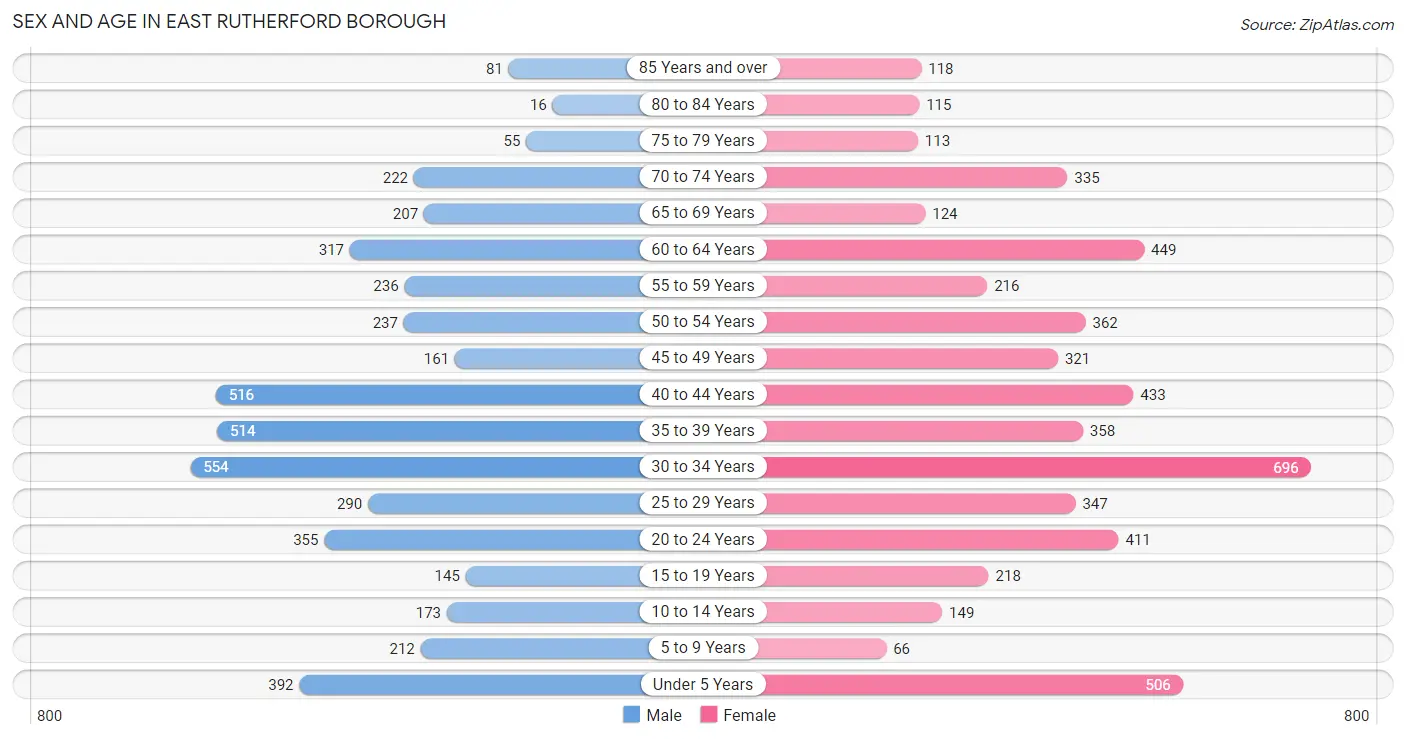
Sex and Age in East Rutherford borough
Sex and Age in East Rutherford borough
The most populous age groups in East Rutherford borough are 30 to 34 Years (554 | 11.8%) for men and 30 to 34 Years (696 | 13.0%) for women.
| Age Bracket | Male | Female |
| Under 5 Years | 392 (8.4%) | 506 (9.5%) |
| 5 to 9 Years | 212 (4.5%) | 66 (1.2%) |
| 10 to 14 Years | 173 (3.7%) | 149 (2.8%) |
| 15 to 19 Years | 145 (3.1%) | 218 (4.1%) |
| 20 to 24 Years | 355 (7.6%) | 411 (7.7%) |
| 25 to 29 Years | 290 (6.2%) | 347 (6.5%) |
| 30 to 34 Years | 554 (11.8%) | 696 (13.0%) |
| 35 to 39 Years | 514 (11.0%) | 358 (6.7%) |
| 40 to 44 Years | 516 (11.0%) | 433 (8.1%) |
| 45 to 49 Years | 161 (3.4%) | 321 (6.0%) |
| 50 to 54 Years | 237 (5.1%) | 362 (6.8%) |
| 55 to 59 Years | 236 (5.0%) | 216 (4.1%) |
| 60 to 64 Years | 317 (6.8%) | 449 (8.4%) |
| 65 to 69 Years | 207 (4.4%) | 124 (2.3%) |
| 70 to 74 Years | 222 (4.7%) | 335 (6.3%) |
| 75 to 79 Years | 55 (1.2%) | 113 (2.1%) |
| 80 to 84 Years | 16 (0.3%) | 115 (2.1%) |
| 85 Years and over | 81 (1.7%) | 118 (2.2%) |
| Total | 4,683 (100.0%) | 5,337 (100.0%) |
Families and Households in East Rutherford borough
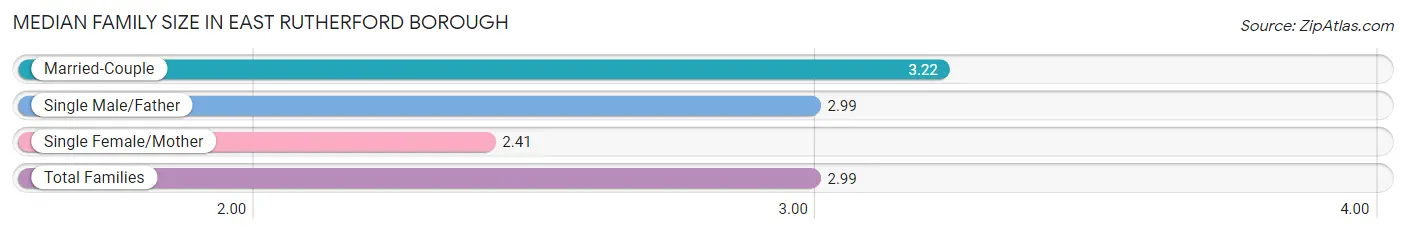
Median Family Size in East Rutherford borough
The median family size in East Rutherford borough is 2.99 persons per family, with married-couple families (1,680 | 66.6%) accounting for the largest median family size of 3.22 persons per family. On the other hand, single female/mother families (652 | 25.8%) represent the smallest median family size with 2.41 persons per family.
| Family Type | # Families | Family Size |
| Married-Couple | 1,680 (66.6%) | 3.22 |
| Single Male/Father | 191 (7.6%) | 2.99 |
| Single Female/Mother | 652 (25.8%) | 2.41 |
| Total Families | 2,523 (100.0%) | 2.99 |
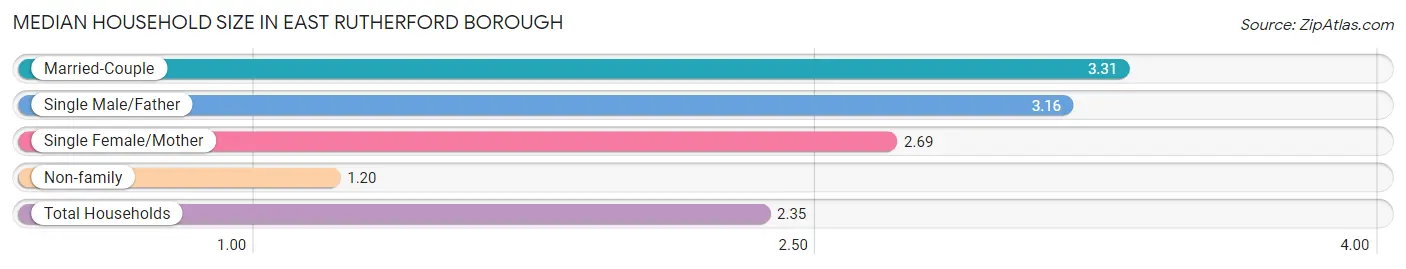
Median Household Size in East Rutherford borough
The median household size in East Rutherford borough is 2.35 persons per household, with married-couple households (1,680 | 39.5%) accounting for the largest median household size of 3.31 persons per household. non-family households (1,735 | 40.7%) represent the smallest median household size with 1.20 persons per household.
| Household Type | # Households | Household Size |
| Married-Couple | 1,680 (39.5%) | 3.31 |
| Single Male/Father | 191 (4.5%) | 3.16 |
| Single Female/Mother | 652 (15.3%) | 2.69 |
| Non-family | 1,735 (40.7%) | 1.20 |
| Total Households | 4,258 (100.0%) | 2.35 |
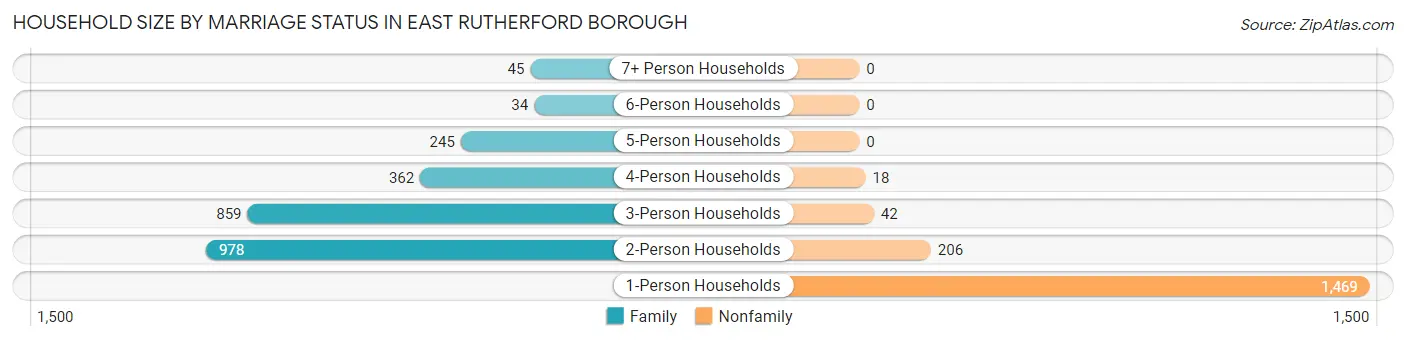
Household Size by Marriage Status in East Rutherford borough
Out of a total of 4,258 households in East Rutherford borough, 2,523 (59.3%) are family households, while 1,735 (40.7%) are nonfamily households. The most numerous type of family households are 2-person households, comprising 978, and the most common type of nonfamily households are 1-person households, comprising 1,469.
| Household Size | Family Households | Nonfamily Households |
| 1-Person Households | - | 1,469 (34.5%) |
| 2-Person Households | 978 (23.0%) | 206 (4.8%) |
| 3-Person Households | 859 (20.2%) | 42 (1.0%) |
| 4-Person Households | 362 (8.5%) | 18 (0.4%) |
| 5-Person Households | 245 (5.8%) | 0 (0.0%) |
| 6-Person Households | 34 (0.8%) | 0 (0.0%) |
| 7+ Person Households | 45 (1.1%) | 0 (0.0%) |
| Total | 2,523 (59.3%) | 1,735 (40.7%) |
Female Fertility in East Rutherford borough
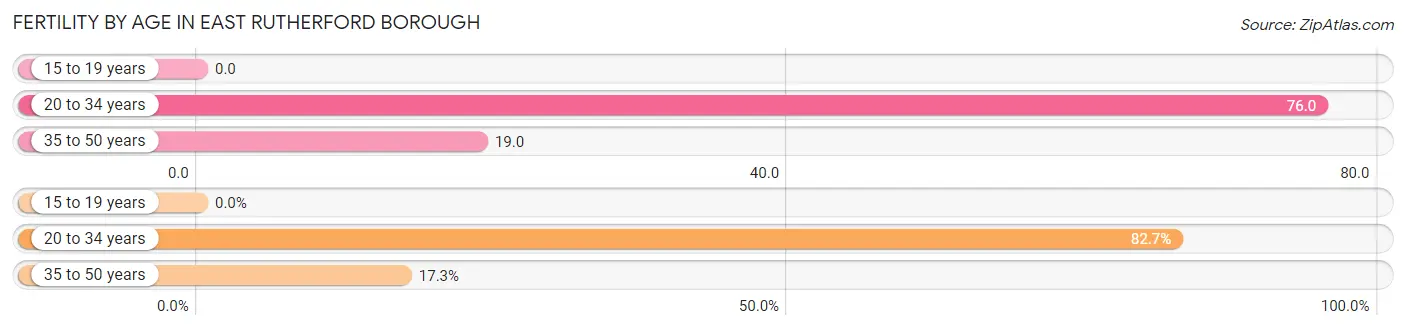
Fertility by Age in East Rutherford borough
Average fertility rate in East Rutherford borough is 46.0 births per 1,000 women. Women in the age bracket of 20 to 34 years have the highest fertility rate with 76.0 births per 1,000 women. Women in the age bracket of 20 to 34 years acount for 82.7% of all women with births.
| Age Bracket | Women with Births | Births / 1,000 Women |
| 15 to 19 years | 0 (0.0%) | 0.0 |
| 20 to 34 years | 110 (82.7%) | 76.0 |
| 35 to 50 years | 23 (17.3%) | 19.0 |
| Total | 133 (100.0%) | 46.0 |
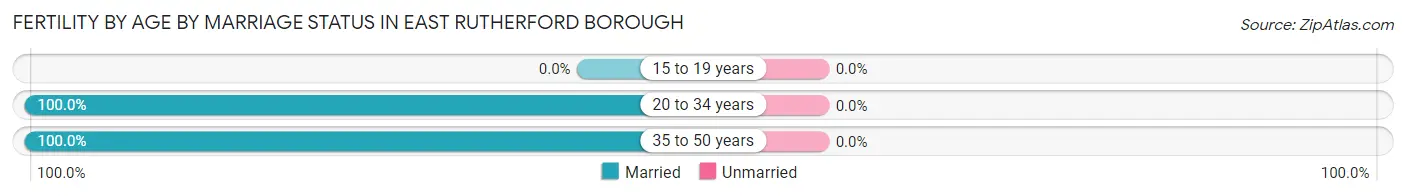
Fertility by Age by Marriage Status in East Rutherford borough
| Age Bracket | Married | Unmarried |
| 15 to 19 years | 0 (0.0%) | 0 (0.0%) |
| 20 to 34 years | 110 (100.0%) | 0 (0.0%) |
| 35 to 50 years | 23 (100.0%) | 0 (0.0%) |
| Total | 133 (100.0%) | 0 (0.0%) |
Fertility by Education in East Rutherford borough
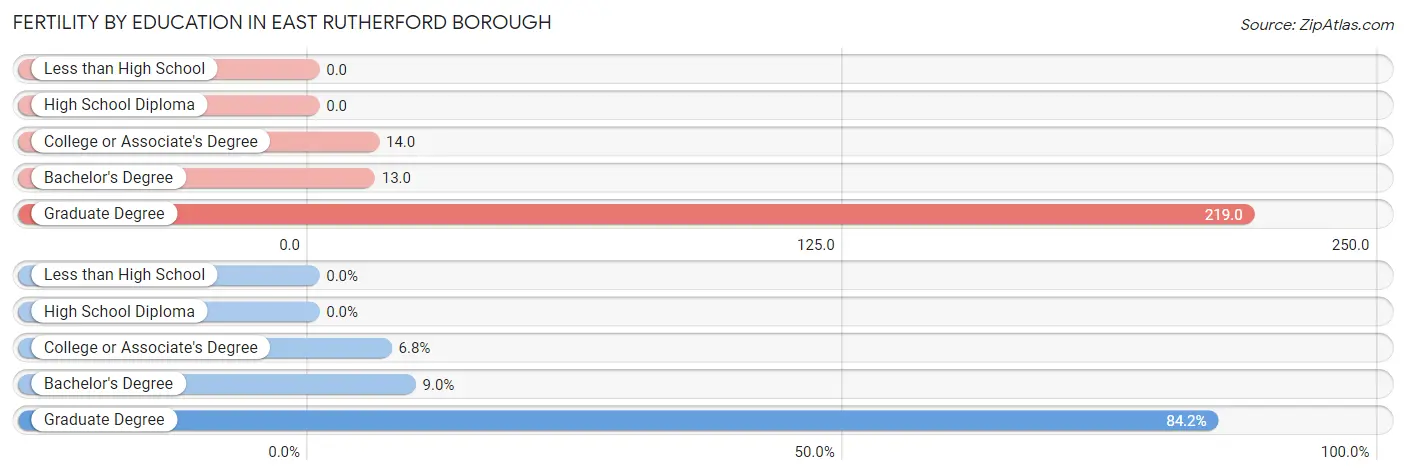
| Educational Attainment | Women with Births | Births / 1,000 Women |
| Less than High School | 0 (0.0%) | 0.0 |
| High School Diploma | 0 (0.0%) | 0.0 |
| College or Associate's Degree | 9 (6.8%) | 14.0 |
| Bachelor's Degree | 12 (9.0%) | 13.0 |
| Graduate Degree | 112 (84.2%) | 219.0 |
| Total | 133 (100.0%) | 46.0 |
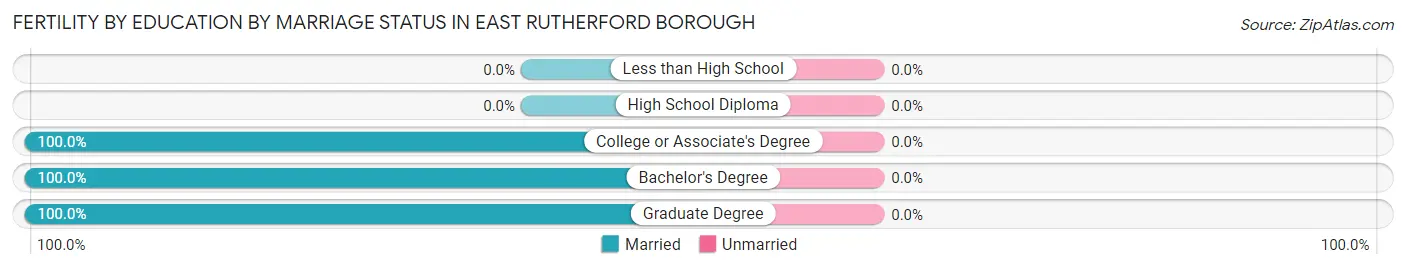
Fertility by Education by Marriage Status in East Rutherford borough
| Educational Attainment | Married | Unmarried |
| Less than High School | 0 (0.0%) | 0 (0.0%) |
| High School Diploma | 0 (0.0%) | 0 (0.0%) |
| College or Associate's Degree | 9 (100.0%) | 0 (0.0%) |
| Bachelor's Degree | 12 (100.0%) | 0 (0.0%) |
| Graduate Degree | 112 (100.0%) | 0 (0.0%) |
| Total | 133 (100.0%) | 0 (0.0%) |
Employment Characteristics in East Rutherford borough
Employment by Class of Employer in East Rutherford borough
Among the 5,524 employed individuals in East Rutherford borough, private company employees (4,174 | 75.6%), self-employed (not incorporated) (377 | 6.8%), and local government employees (274 | 5.0%) make up the most common classes of employment.
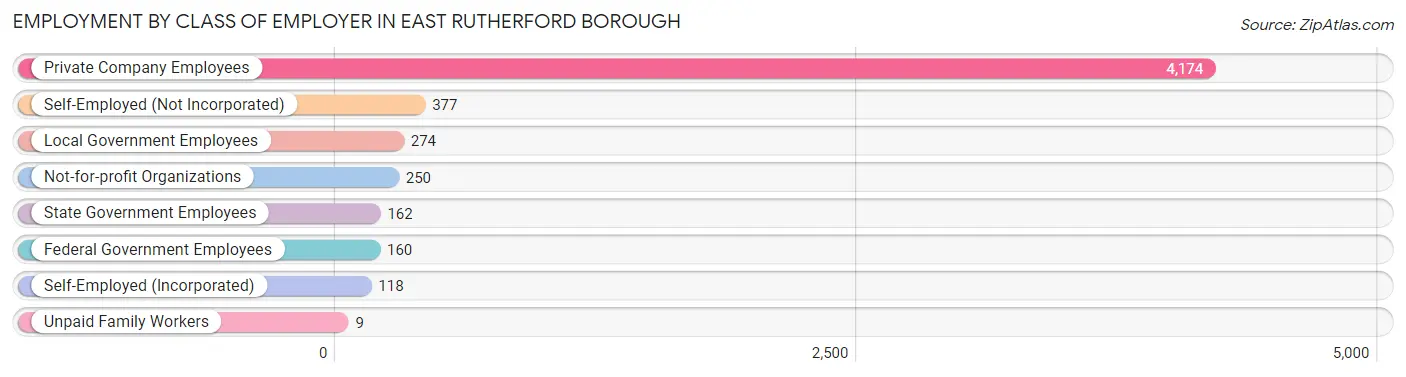
| Employer Class | # Employees | % Employees |
| Private Company Employees | 4,174 | 75.6% |
| Self-Employed (Incorporated) | 118 | 2.1% |
| Self-Employed (Not Incorporated) | 377 | 6.8% |
| Not-for-profit Organizations | 250 | 4.5% |
| Local Government Employees | 274 | 5.0% |
| State Government Employees | 162 | 2.9% |
| Federal Government Employees | 160 | 2.9% |
| Unpaid Family Workers | 9 | 0.2% |
| Total | 5,524 | 100.0% |
Employment Status by Age in East Rutherford borough
According to the labor force statistics for East Rutherford borough, out of the total population over 16 years of age (8,484), 69.5% or 5,896 individuals are in the labor force, with 4.2% or 248 of them unemployed. The age group with the highest labor force participation rate is 30 to 34 years, with 96.5% or 1,206 individuals in the labor force. Within the labor force, the 16 to 19 years age range has the highest percentage of unemployed individuals, with 13.8% or 9 of them being unemployed.
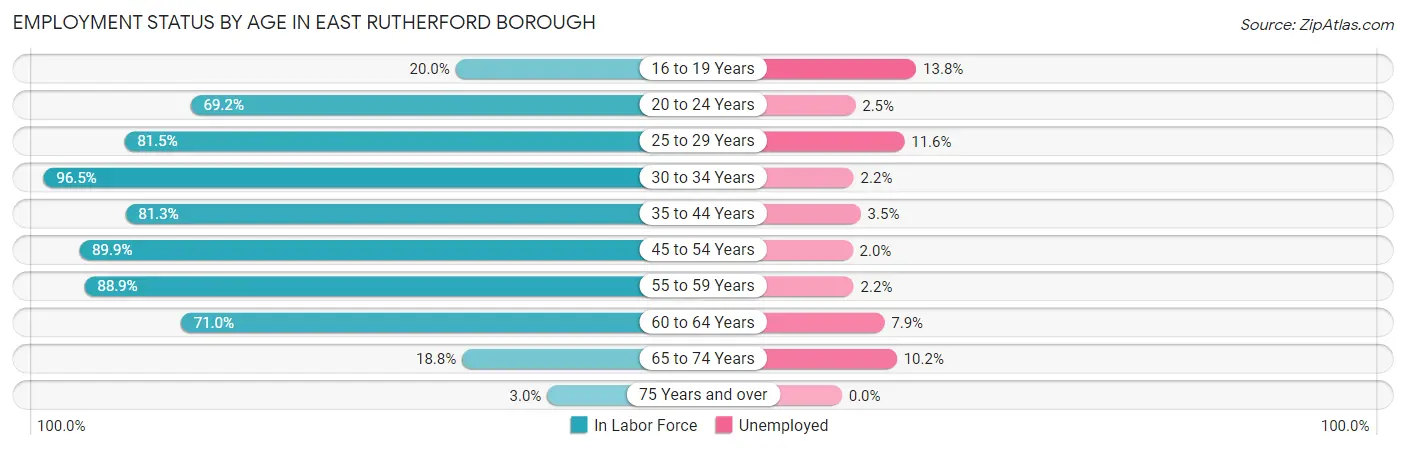
| Age Bracket | In Labor Force | Unemployed |
| 16 to 19 Years | 65 (20.0%) | 9 (13.8%) |
| 20 to 24 Years | 530 (69.2%) | 13 (2.5%) |
| 25 to 29 Years | 519 (81.5%) | 60 (11.6%) |
| 30 to 34 Years | 1,206 (96.5%) | 27 (2.2%) |
| 35 to 44 Years | 1,480 (81.3%) | 52 (3.5%) |
| 45 to 54 Years | 972 (89.9%) | 19 (2.0%) |
| 55 to 59 Years | 402 (88.9%) | 9 (2.2%) |
| 60 to 64 Years | 544 (71.0%) | 43 (7.9%) |
| 65 to 74 Years | 167 (18.8%) | 17 (10.2%) |
| 75 Years and over | 15 (3.0%) | 0 (0.0%) |
| Total | 5,896 (69.5%) | 248 (4.2%) |
Employment Status by Educational Attainment in East Rutherford borough
According to labor force statistics for East Rutherford borough, 85.3% of individuals (5,124) out of the total population between 25 and 64 years of age (6,007) are in the labor force, with 4.1% or 210 of them being unemployed. The group with the highest labor force participation rate are those with the educational attainment of college / associate degree, with 91.8% or 1,347 individuals in the labor force. Within the labor force, individuals with college / associate degree education have the highest percentage of unemployment, with 6.2% or 84 of them being unemployed.
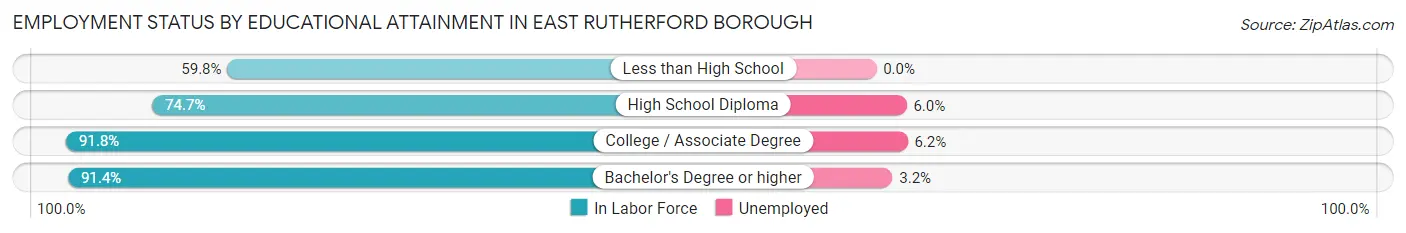
| Educational Attainment | In Labor Force | Unemployed |
| Less than High School | 419 (59.8%) | 0 (0.0%) |
| High School Diploma | 671 (74.7%) | 54 (6.0%) |
| College / Associate Degree | 1,347 (91.8%) | 91 (6.2%) |
| Bachelor's Degree or higher | 2,688 (91.4%) | 94 (3.2%) |
| Total | 5,124 (85.3%) | 246 (4.1%) |
Employment Occupations by Sex in East Rutherford borough
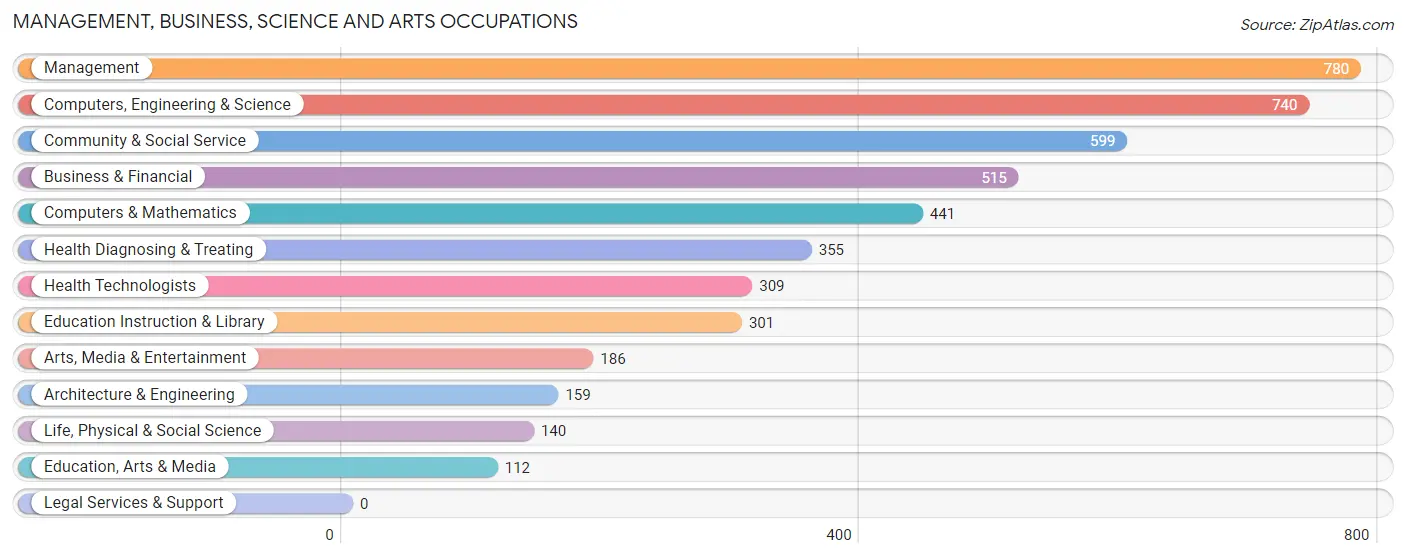
Management, Business, Science and Arts Occupations
The most common Management, Business, Science and Arts occupations in East Rutherford borough are Management (780 | 13.8%), Computers, Engineering & Science (740 | 13.1%), Community & Social Service (599 | 10.6%), Business & Financial (515 | 9.1%), and Computers & Mathematics (441 | 7.8%).
Management, Business, Science and Arts Occupations by Sex
Within the Management, Business, Science and Arts occupations in East Rutherford borough, the most male-oriented occupations are Architecture & Engineering (100.0%), Computers & Mathematics (84.1%), and Computers, Engineering & Science (80.3%), while the most female-oriented occupations are Education, Arts & Media (94.6%), Health Technologists (90.3%), and Education Instruction & Library (83.4%).
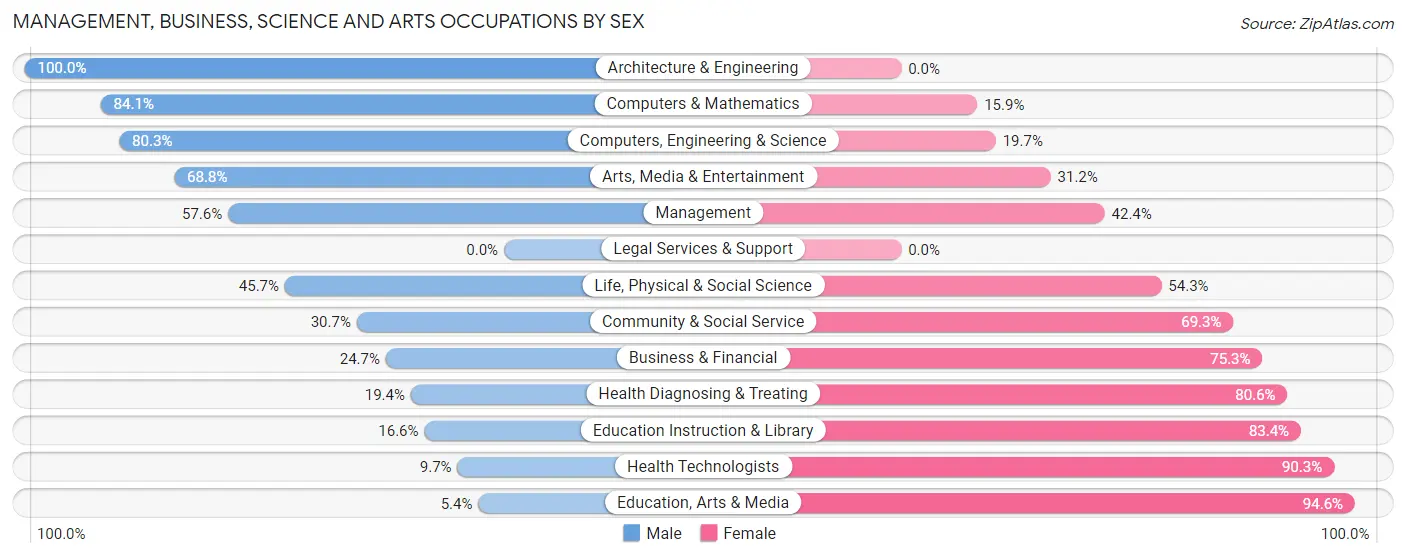
| Occupation | Male | Female |
| Management | 449 (57.6%) | 331 (42.4%) |
| Business & Financial | 127 (24.7%) | 388 (75.3%) |
| Computers, Engineering & Science | 594 (80.3%) | 146 (19.7%) |
| Computers & Mathematics | 371 (84.1%) | 70 (15.9%) |
| Architecture & Engineering | 159 (100.0%) | 0 (0.0%) |
| Life, Physical & Social Science | 64 (45.7%) | 76 (54.3%) |
| Community & Social Service | 184 (30.7%) | 415 (69.3%) |
| Education, Arts & Media | 6 (5.4%) | 106 (94.6%) |
| Legal Services & Support | 0 (0.0%) | 0 (0.0%) |
| Education Instruction & Library | 50 (16.6%) | 251 (83.4%) |
| Arts, Media & Entertainment | 128 (68.8%) | 58 (31.2%) |
| Health Diagnosing & Treating | 69 (19.4%) | 286 (80.6%) |
| Health Technologists | 30 (9.7%) | 279 (90.3%) |
| Total (Category) | 1,423 (47.6%) | 1,566 (52.4%) |
| Total (Overall) | 2,718 (48.1%) | 2,934 (51.9%) |
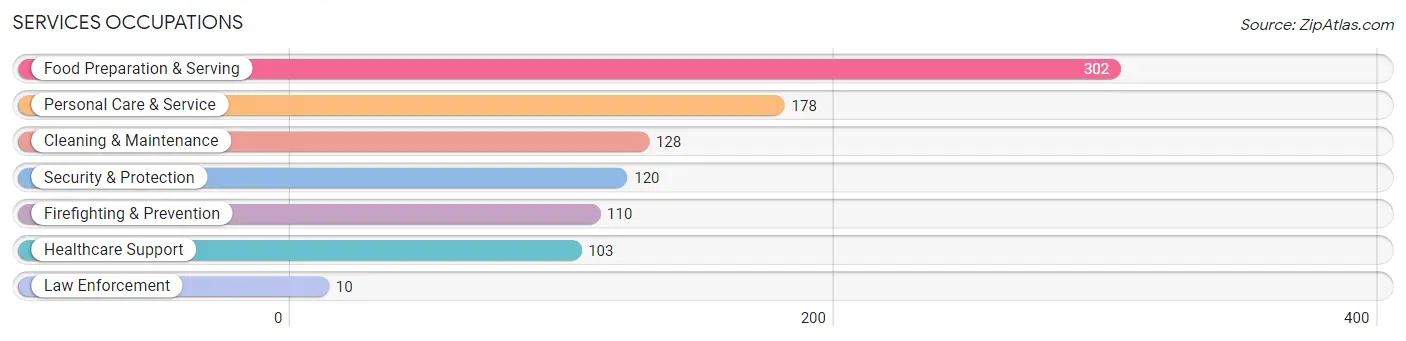
Services Occupations
The most common Services occupations in East Rutherford borough are Food Preparation & Serving (302 | 5.3%), Personal Care & Service (178 | 3.2%), Cleaning & Maintenance (128 | 2.3%), Security & Protection (120 | 2.1%), and Firefighting & Prevention (110 | 1.9%).
Services Occupations by Sex
Within the Services occupations in East Rutherford borough, the most male-oriented occupations are Law Enforcement (100.0%), Security & Protection (84.2%), and Firefighting & Prevention (82.7%), while the most female-oriented occupations are Healthcare Support (100.0%), Personal Care & Service (89.9%), and Cleaning & Maintenance (75.0%).
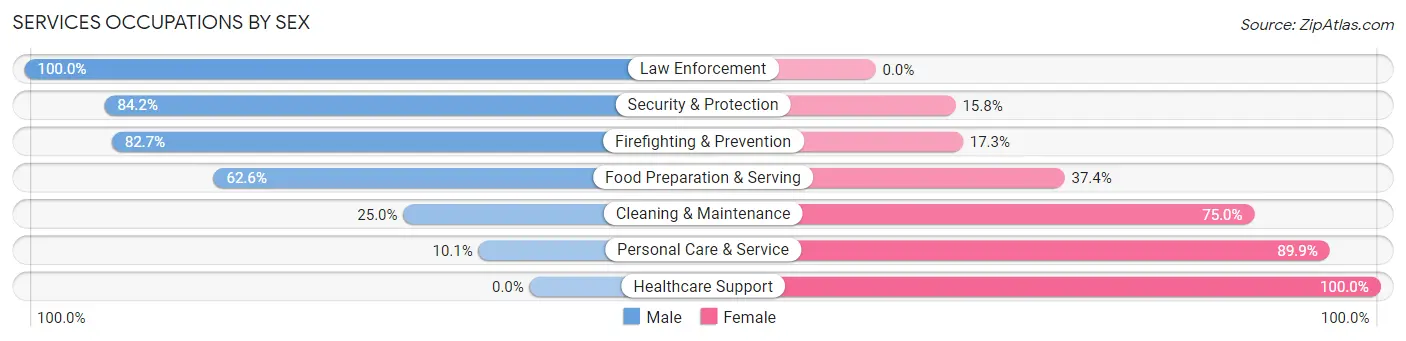
| Occupation | Male | Female |
| Healthcare Support | 0 (0.0%) | 103 (100.0%) |
| Security & Protection | 101 (84.2%) | 19 (15.8%) |
| Firefighting & Prevention | 91 (82.7%) | 19 (17.3%) |
| Law Enforcement | 10 (100.0%) | 0 (0.0%) |
| Food Preparation & Serving | 189 (62.6%) | 113 (37.4%) |
| Cleaning & Maintenance | 32 (25.0%) | 96 (75.0%) |
| Personal Care & Service | 18 (10.1%) | 160 (89.9%) |
| Total (Category) | 340 (40.9%) | 491 (59.1%) |
| Total (Overall) | 2,718 (48.1%) | 2,934 (51.9%) |
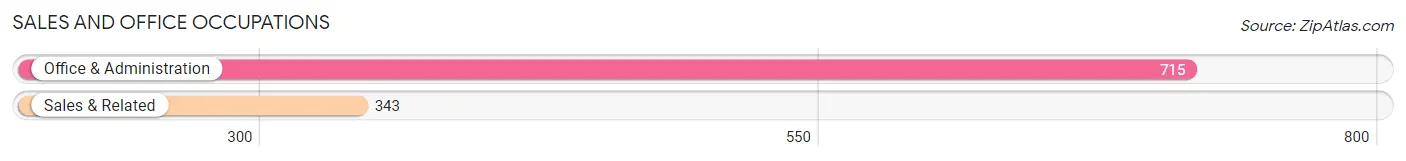
Sales and Office Occupations
The most common Sales and Office occupations in East Rutherford borough are Office & Administration (715 | 12.7%), and Sales & Related (343 | 6.1%).
Sales and Office Occupations by Sex
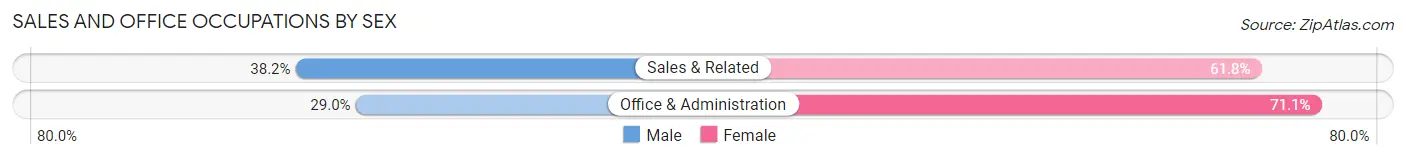
| Occupation | Male | Female |
| Sales & Related | 131 (38.2%) | 212 (61.8%) |
| Office & Administration | 207 (28.9%) | 508 (71.1%) |
| Total (Category) | 338 (32.0%) | 720 (68.0%) |
| Total (Overall) | 2,718 (48.1%) | 2,934 (51.9%) |
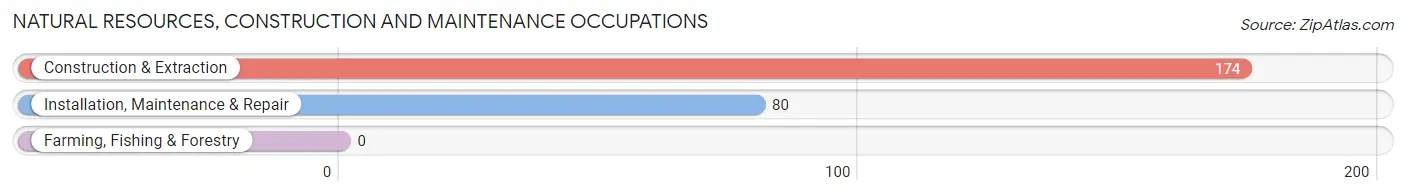
Natural Resources, Construction and Maintenance Occupations
The most common Natural Resources, Construction and Maintenance occupations in East Rutherford borough are Construction & Extraction (174 | 3.1%), and Installation, Maintenance & Repair (80 | 1.4%).
Natural Resources, Construction and Maintenance Occupations by Sex
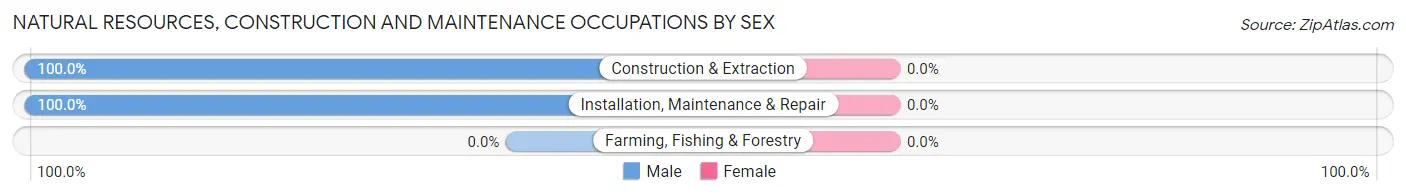
| Occupation | Male | Female |
| Farming, Fishing & Forestry | 0 (0.0%) | 0 (0.0%) |
| Construction & Extraction | 174 (100.0%) | 0 (0.0%) |
| Installation, Maintenance & Repair | 80 (100.0%) | 0 (0.0%) |
| Total (Category) | 254 (100.0%) | 0 (0.0%) |
| Total (Overall) | 2,718 (48.1%) | 2,934 (51.9%) |
Production, Transportation and Moving Occupations
The most common Production, Transportation and Moving occupations in East Rutherford borough are Material Moving (246 | 4.3%), Production (157 | 2.8%), and Transportation (117 | 2.1%).
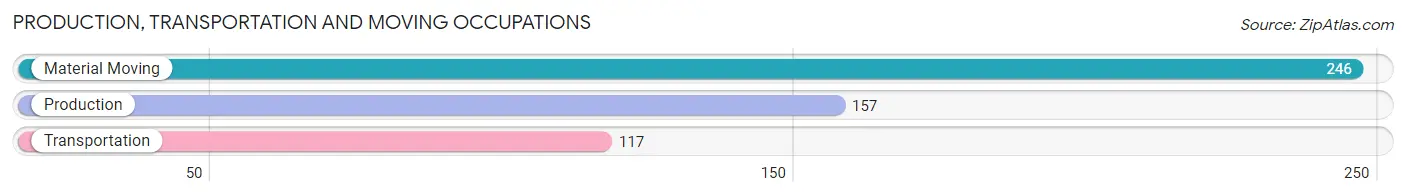
Production, Transportation and Moving Occupations by Sex
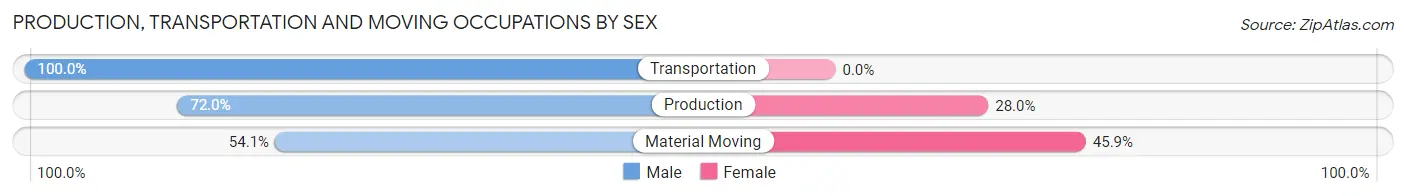
| Occupation | Male | Female |
| Production | 113 (72.0%) | 44 (28.0%) |
| Transportation | 117 (100.0%) | 0 (0.0%) |
| Material Moving | 133 (54.1%) | 113 (45.9%) |
| Total (Category) | 363 (69.8%) | 157 (30.2%) |
| Total (Overall) | 2,718 (48.1%) | 2,934 (51.9%) |
Employment Industries by Sex in East Rutherford borough
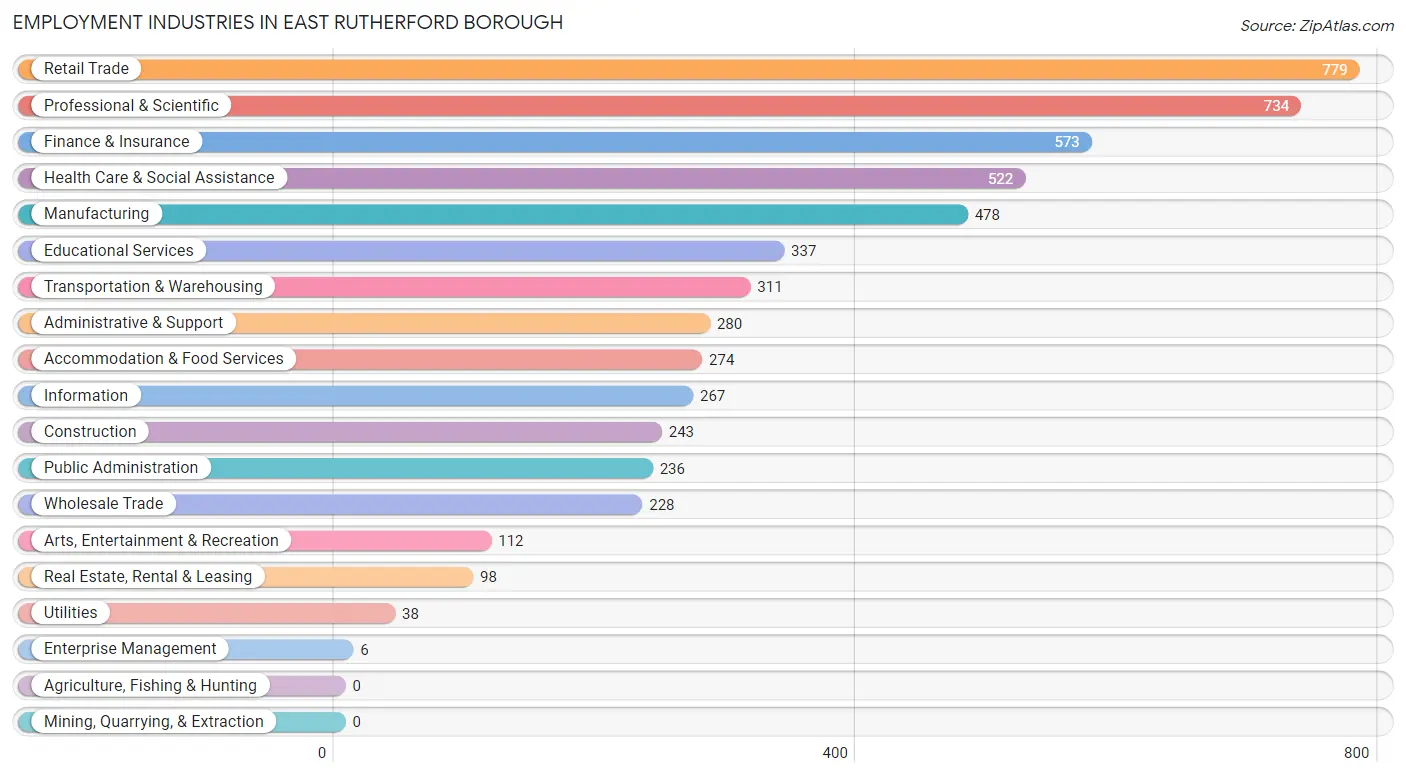
Employment Industries in East Rutherford borough
The major employment industries in East Rutherford borough include Retail Trade (779 | 13.8%), Professional & Scientific (734 | 13.0%), Finance & Insurance (573 | 10.1%), Health Care & Social Assistance (522 | 9.2%), and Manufacturing (478 | 8.5%).
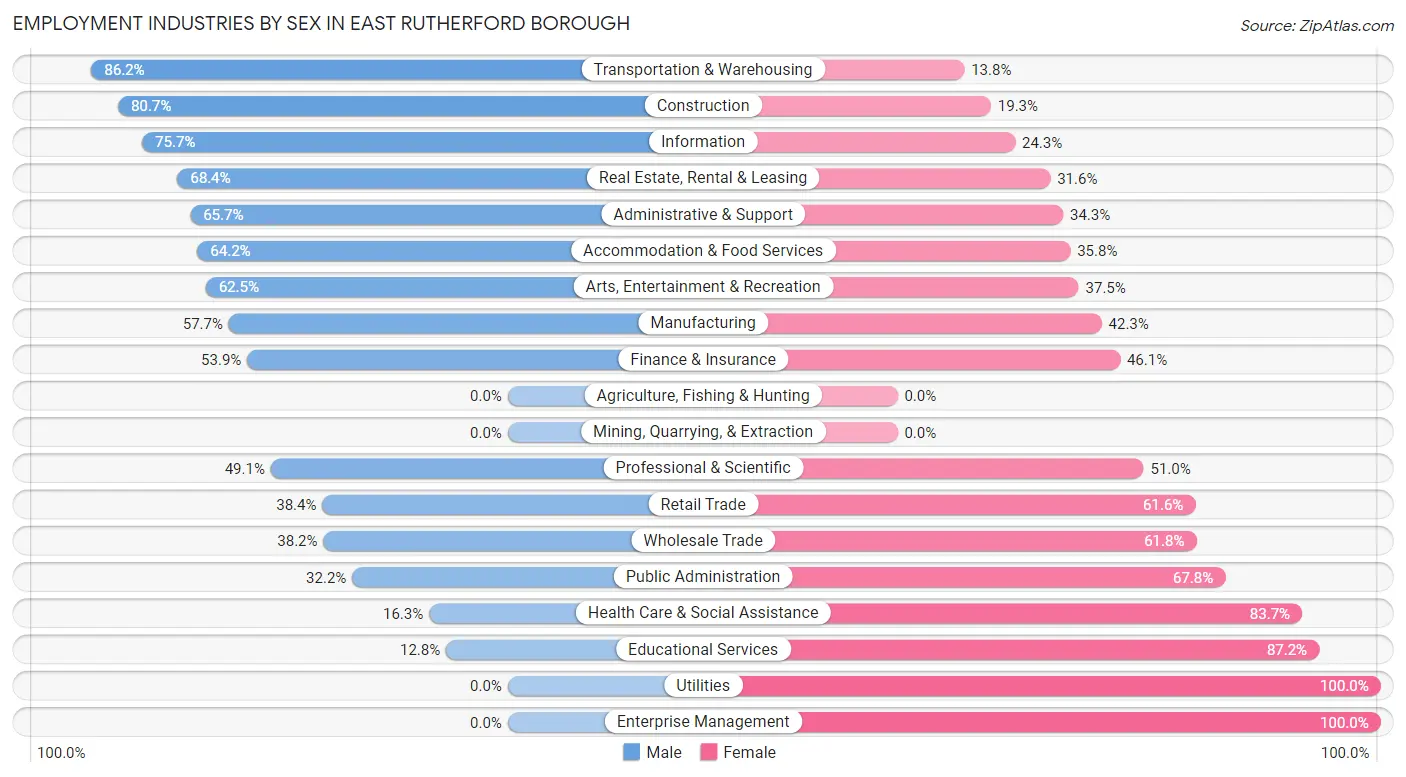
Employment Industries by Sex in East Rutherford borough
The East Rutherford borough industries that see more men than women are Transportation & Warehousing (86.2%), Construction (80.7%), and Information (75.7%), whereas the industries that tend to have a higher number of women are Utilities (100.0%), Enterprise Management (100.0%), and Educational Services (87.2%).
| Industry | Male | Female |
| Agriculture, Fishing & Hunting | 0 (0.0%) | 0 (0.0%) |
| Mining, Quarrying, & Extraction | 0 (0.0%) | 0 (0.0%) |
| Construction | 196 (80.7%) | 47 (19.3%) |
| Manufacturing | 276 (57.7%) | 202 (42.3%) |
| Wholesale Trade | 87 (38.2%) | 141 (61.8%) |
| Retail Trade | 299 (38.4%) | 480 (61.6%) |
| Transportation & Warehousing | 268 (86.2%) | 43 (13.8%) |
| Utilities | 0 (0.0%) | 38 (100.0%) |
| Information | 202 (75.7%) | 65 (24.3%) |
| Finance & Insurance | 309 (53.9%) | 264 (46.1%) |
| Real Estate, Rental & Leasing | 67 (68.4%) | 31 (31.6%) |
| Professional & Scientific | 360 (49.0%) | 374 (50.9%) |
| Enterprise Management | 0 (0.0%) | 6 (100.0%) |
| Administrative & Support | 184 (65.7%) | 96 (34.3%) |
| Educational Services | 43 (12.8%) | 294 (87.2%) |
| Health Care & Social Assistance | 85 (16.3%) | 437 (83.7%) |
| Arts, Entertainment & Recreation | 70 (62.5%) | 42 (37.5%) |
| Accommodation & Food Services | 176 (64.2%) | 98 (35.8%) |
| Public Administration | 76 (32.2%) | 160 (67.8%) |
| Total | 2,718 (48.1%) | 2,934 (51.9%) |
Education in East Rutherford borough
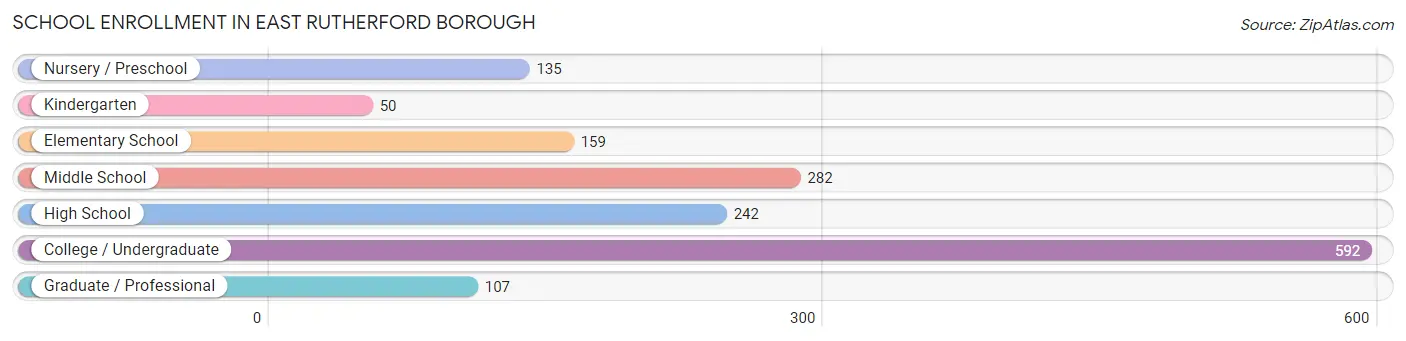
School Enrollment in East Rutherford borough
The most common levels of schooling among the 1,567 students in East Rutherford borough are college / undergraduate (592 | 37.8%), middle school (282 | 18.0%), and high school (242 | 15.4%).
| School Level | # Students | % Students |
| Nursery / Preschool | 135 | 8.6% |
| Kindergarten | 50 | 3.2% |
| Elementary School | 159 | 10.2% |
| Middle School | 282 | 18.0% |
| High School | 242 | 15.4% |
| College / Undergraduate | 592 | 37.8% |
| Graduate / Professional | 107 | 6.8% |
| Total | 1,567 | 100.0% |
School Enrollment by Age by Funding Source in East Rutherford borough
Out of a total of 1,567 students who are enrolled in schools in East Rutherford borough, 600 (38.3%) attend a private institution, while the remaining 967 (61.7%) are enrolled in public schools. The age group of 3 to 4 year olds has the highest likelihood of being enrolled in private schools, with 85 (100.0% in the age bracket) enrolled. Conversely, the age group of 5 to 9 year old has the lowest likelihood of being enrolled in a private school, with 259 (100.0% in the age bracket) attending a public institution.
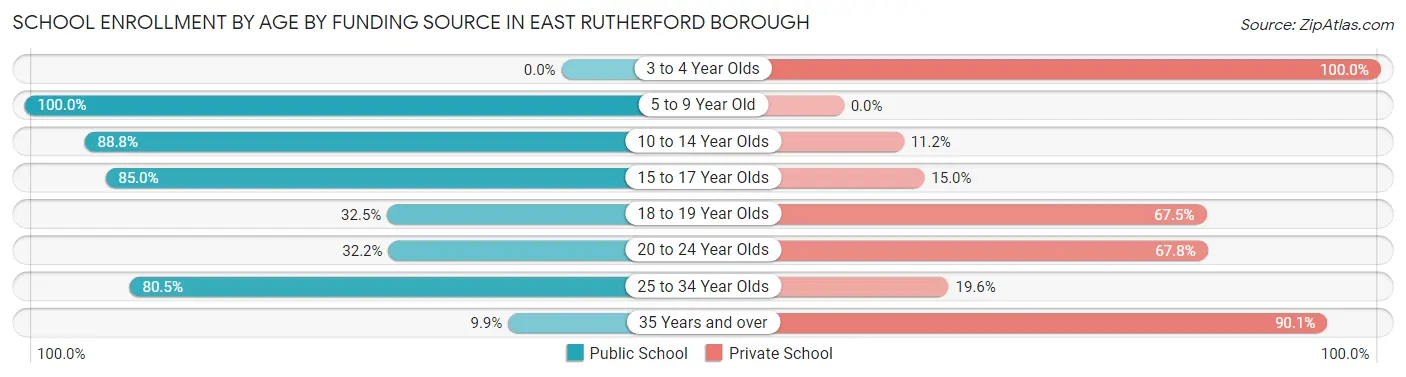
| Age Bracket | Public School | Private School |
| 3 to 4 Year Olds | 0 (0.0%) | 85 (100.0%) |
| 5 to 9 Year Old | 259 (100.0%) | 0 (0.0%) |
| 10 to 14 Year Olds | 286 (88.8%) | 36 (11.2%) |
| 15 to 17 Year Olds | 130 (85.0%) | 23 (15.0%) |
| 18 to 19 Year Olds | 63 (32.5%) | 131 (67.5%) |
| 20 to 24 Year Olds | 69 (32.2%) | 145 (67.8%) |
| 25 to 34 Year Olds | 144 (80.4%) | 35 (19.6%) |
| 35 Years and over | 16 (9.9%) | 145 (90.1%) |
| Total | 967 (61.7%) | 600 (38.3%) |
Educational Attainment by Field of Study in East Rutherford borough
Engineering (785 | 23.1%), business (632 | 18.6%), education (361 | 10.6%), science & technology (262 | 7.7%), and computers & mathematics (248 | 7.3%) are the most common fields of study among 3,398 individuals in East Rutherford borough who have obtained a bachelor's degree or higher.
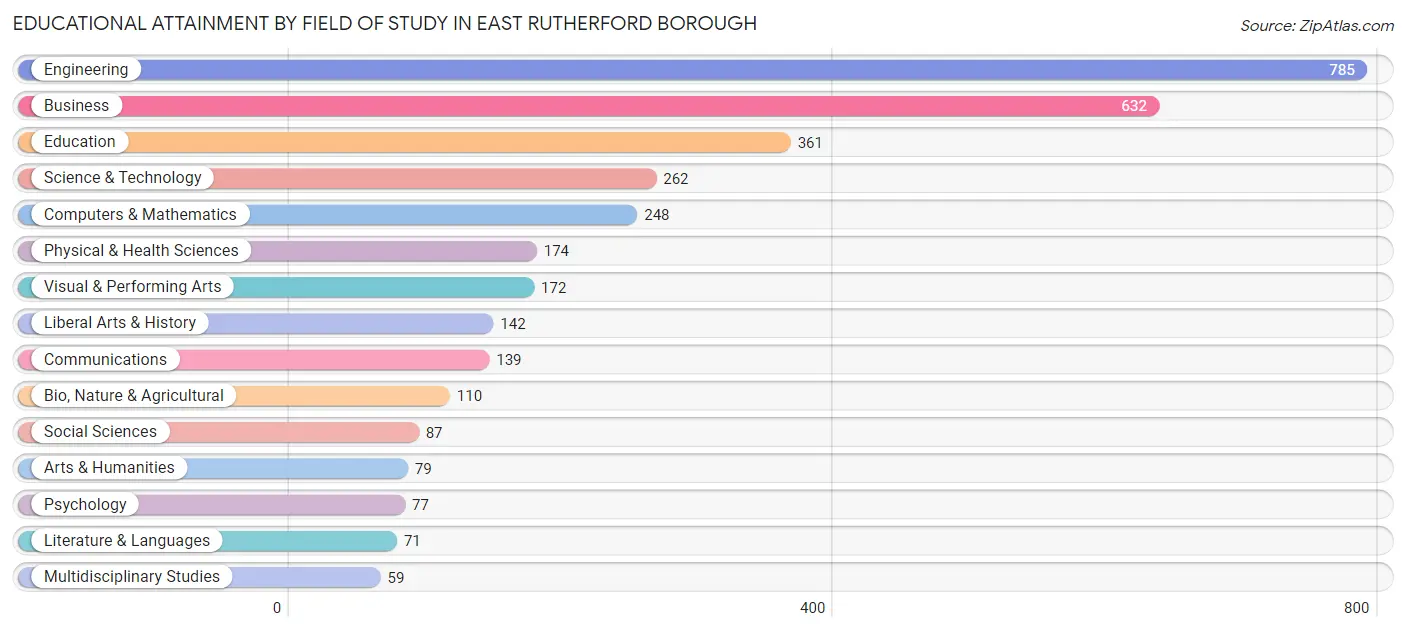
| Field of Study | # Graduates | % Graduates |
| Computers & Mathematics | 248 | 7.3% |
| Bio, Nature & Agricultural | 110 | 3.2% |
| Physical & Health Sciences | 174 | 5.1% |
| Psychology | 77 | 2.3% |
| Social Sciences | 87 | 2.6% |
| Engineering | 785 | 23.1% |
| Multidisciplinary Studies | 59 | 1.7% |
| Science & Technology | 262 | 7.7% |
| Business | 632 | 18.6% |
| Education | 361 | 10.6% |
| Literature & Languages | 71 | 2.1% |
| Liberal Arts & History | 142 | 4.2% |
| Visual & Performing Arts | 172 | 5.1% |
| Communications | 139 | 4.1% |
| Arts & Humanities | 79 | 2.3% |
| Total | 3,398 | 100.0% |
Transportation & Commute in East Rutherford borough
Vehicle Availability by Sex in East Rutherford borough
The most prevalent vehicle ownership categories in East Rutherford borough are males with 1 vehicle (1,063, accounting for 39.2%) and females with 1 vehicle (949, making up 37.9%).
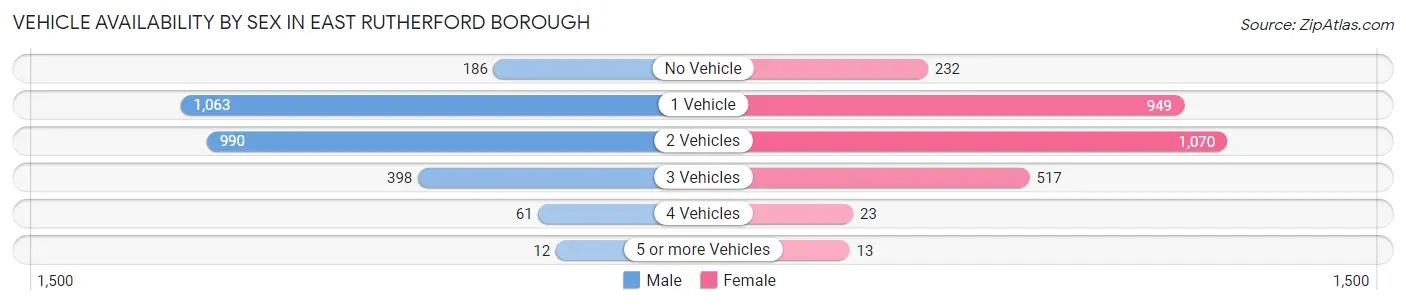
| Vehicles Available | Male | Female |
| No Vehicle | 186 (6.9%) | 232 (8.3%) |
| 1 Vehicle | 1,063 (39.2%) | 949 (33.8%) |
| 2 Vehicles | 990 (36.5%) | 1,070 (38.2%) |
| 3 Vehicles | 398 (14.7%) | 517 (18.4%) |
| 4 Vehicles | 61 (2.2%) | 23 (0.8%) |
| 5 or more Vehicles | 12 (0.4%) | 13 (0.5%) |
| Total | 2,710 (100.0%) | 2,804 (100.0%) |
Commute Time in East Rutherford borough
The most frequently occuring commute durations in East Rutherford borough are 15 to 19 minutes (873 commuters, 18.2%), 30 to 34 minutes (720 commuters, 15.0%), and 60 to 89 minutes (687 commuters, 14.3%).
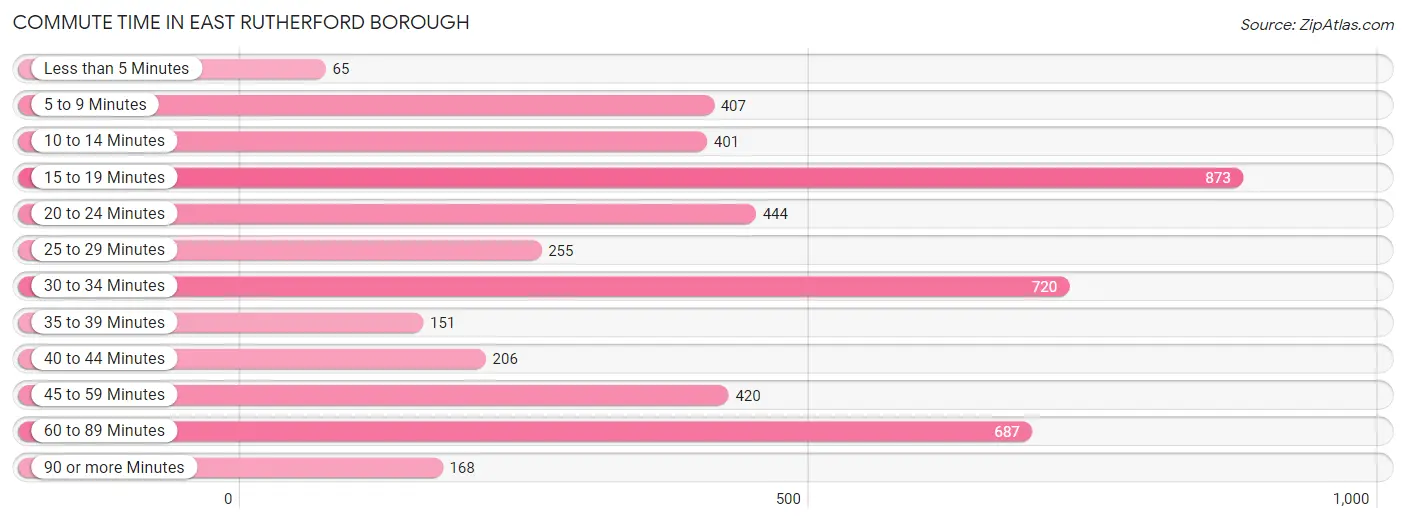
| Commute Time | # Commuters | % Commuters |
| Less than 5 Minutes | 65 | 1.4% |
| 5 to 9 Minutes | 407 | 8.5% |
| 10 to 14 Minutes | 401 | 8.4% |
| 15 to 19 Minutes | 873 | 18.2% |
| 20 to 24 Minutes | 444 | 9.3% |
| 25 to 29 Minutes | 255 | 5.3% |
| 30 to 34 Minutes | 720 | 15.0% |
| 35 to 39 Minutes | 151 | 3.2% |
| 40 to 44 Minutes | 206 | 4.3% |
| 45 to 59 Minutes | 420 | 8.8% |
| 60 to 89 Minutes | 687 | 14.3% |
| 90 or more Minutes | 168 | 3.5% |
Commute Time by Sex in East Rutherford borough
The most common commute times in East Rutherford borough are 60 to 89 minutes (462 commuters, 19.8%) for males and 15 to 19 minutes (446 commuters, 18.1%) for females.
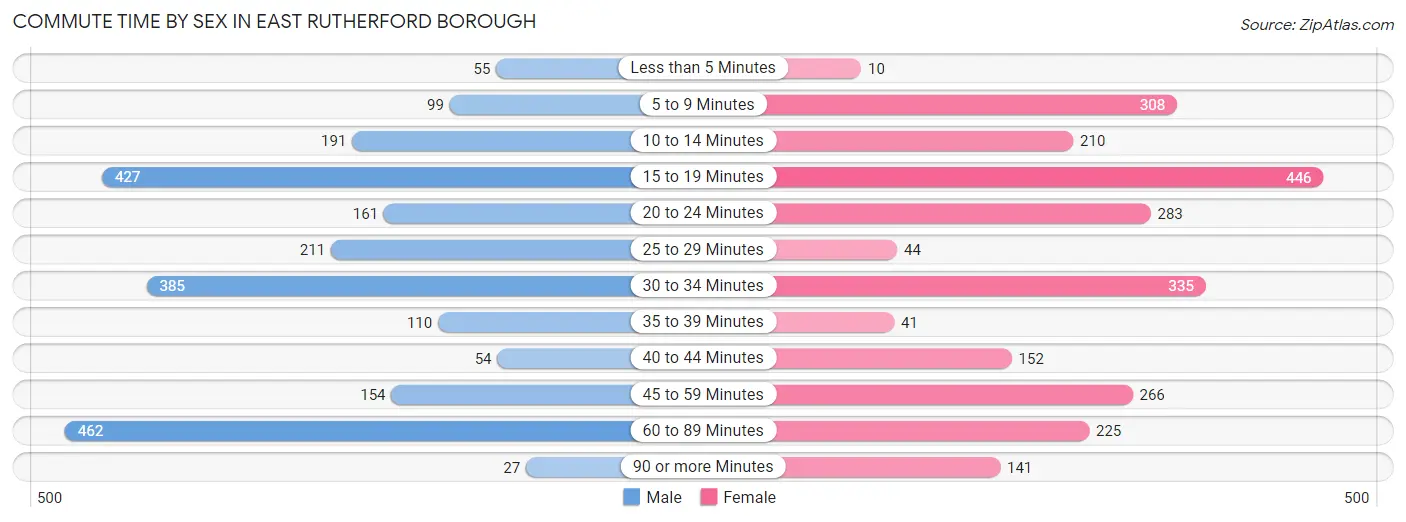
| Commute Time | Male | Female |
| Less than 5 Minutes | 55 (2.4%) | 10 (0.4%) |
| 5 to 9 Minutes | 99 (4.2%) | 308 (12.5%) |
| 10 to 14 Minutes | 191 (8.2%) | 210 (8.5%) |
| 15 to 19 Minutes | 427 (18.3%) | 446 (18.1%) |
| 20 to 24 Minutes | 161 (6.9%) | 283 (11.5%) |
| 25 to 29 Minutes | 211 (9.0%) | 44 (1.8%) |
| 30 to 34 Minutes | 385 (16.5%) | 335 (13.6%) |
| 35 to 39 Minutes | 110 (4.7%) | 41 (1.7%) |
| 40 to 44 Minutes | 54 (2.3%) | 152 (6.2%) |
| 45 to 59 Minutes | 154 (6.6%) | 266 (10.8%) |
| 60 to 89 Minutes | 462 (19.8%) | 225 (9.1%) |
| 90 or more Minutes | 27 (1.2%) | 141 (5.7%) |
Time of Departure to Work by Sex in East Rutherford borough
The most frequent times of departure to work in East Rutherford borough are 8:30 AM to 8:59 AM (398, 17.0%) for males and 8:00 AM to 8:29 AM (475, 19.3%) for females.
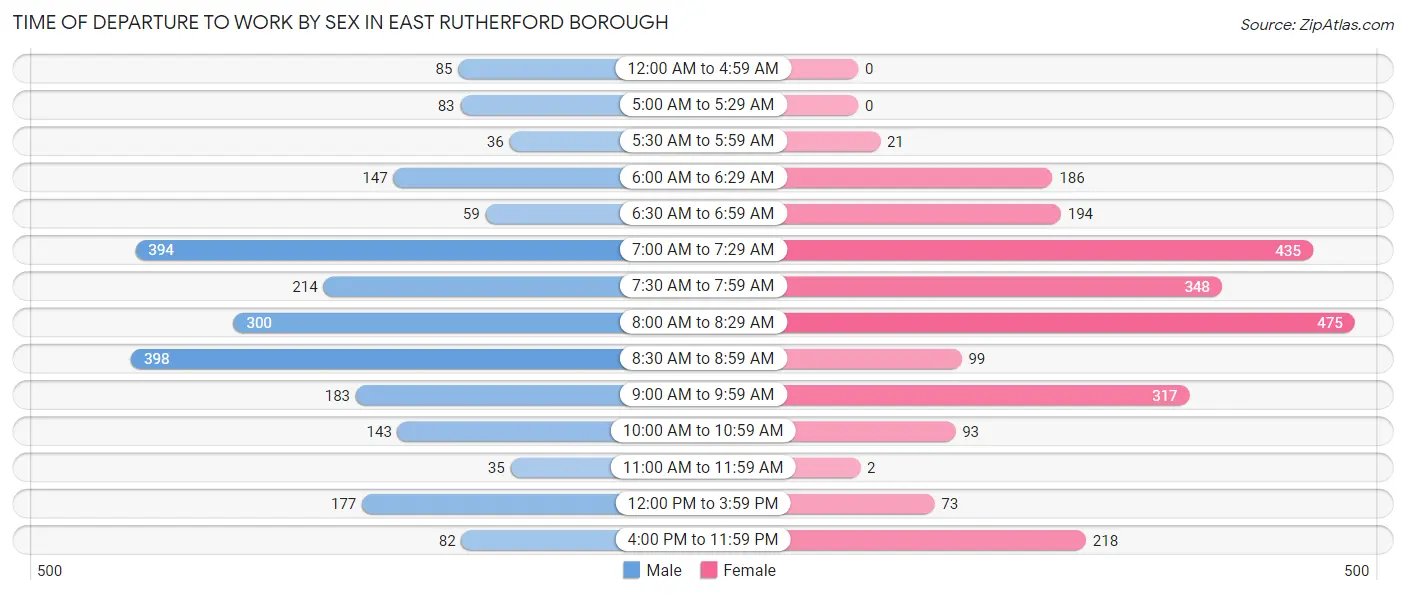
| Time of Departure | Male | Female |
| 12:00 AM to 4:59 AM | 85 (3.6%) | 0 (0.0%) |
| 5:00 AM to 5:29 AM | 83 (3.5%) | 0 (0.0%) |
| 5:30 AM to 5:59 AM | 36 (1.5%) | 21 (0.9%) |
| 6:00 AM to 6:29 AM | 147 (6.3%) | 186 (7.6%) |
| 6:30 AM to 6:59 AM | 59 (2.5%) | 194 (7.9%) |
| 7:00 AM to 7:29 AM | 394 (16.9%) | 435 (17.7%) |
| 7:30 AM to 7:59 AM | 214 (9.2%) | 348 (14.1%) |
| 8:00 AM to 8:29 AM | 300 (12.8%) | 475 (19.3%) |
| 8:30 AM to 8:59 AM | 398 (17.0%) | 99 (4.0%) |
| 9:00 AM to 9:59 AM | 183 (7.8%) | 317 (12.9%) |
| 10:00 AM to 10:59 AM | 143 (6.1%) | 93 (3.8%) |
| 11:00 AM to 11:59 AM | 35 (1.5%) | 2 (0.1%) |
| 12:00 PM to 3:59 PM | 177 (7.6%) | 73 (3.0%) |
| 4:00 PM to 11:59 PM | 82 (3.5%) | 218 (8.9%) |
| Total | 2,336 (100.0%) | 2,461 (100.0%) |
Housing Occupancy in East Rutherford borough
Occupancy by Ownership in East Rutherford borough
Of the total 4,258 dwellings in East Rutherford borough, owner-occupied units account for 1,444 (33.9%), while renter-occupied units make up 2,814 (66.1%).
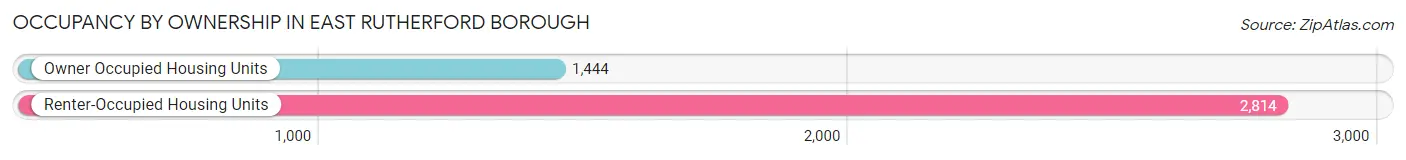
| Occupancy | # Housing Units | % Housing Units |
| Owner Occupied Housing Units | 1,444 | 33.9% |
| Renter-Occupied Housing Units | 2,814 | 66.1% |
| Total Occupied Housing Units | 4,258 | 100.0% |
Occupancy by Household Size in East Rutherford borough
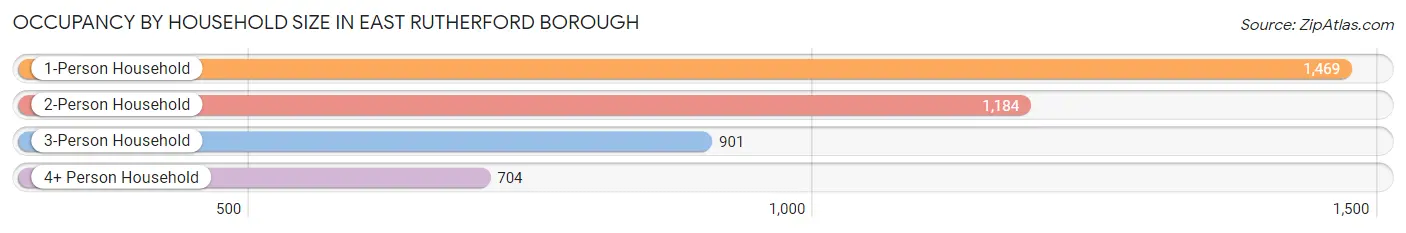
| Household Size | # Housing Units | % Housing Units |
| 1-Person Household | 1,469 | 34.5% |
| 2-Person Household | 1,184 | 27.8% |
| 3-Person Household | 901 | 21.2% |
| 4+ Person Household | 704 | 16.5% |
| Total Housing Units | 4,258 | 100.0% |
Occupancy by Ownership by Household Size in East Rutherford borough
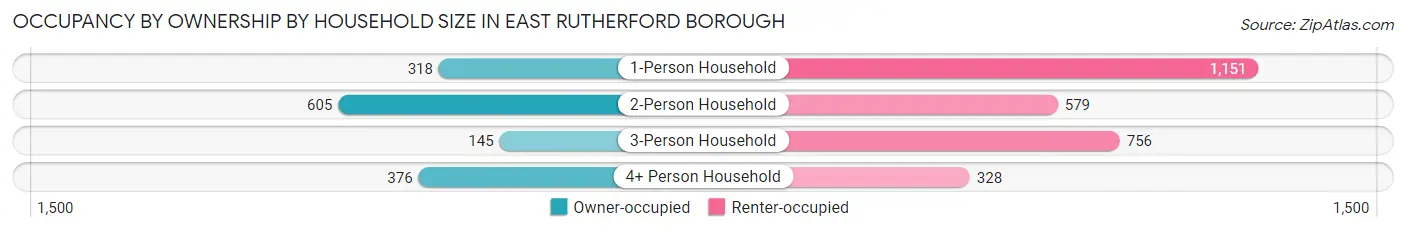
| Household Size | Owner-occupied | Renter-occupied |
| 1-Person Household | 318 (21.6%) | 1,151 (78.3%) |
| 2-Person Household | 605 (51.1%) | 579 (48.9%) |
| 3-Person Household | 145 (16.1%) | 756 (83.9%) |
| 4+ Person Household | 376 (53.4%) | 328 (46.6%) |
| Total Housing Units | 1,444 (33.9%) | 2,814 (66.1%) |
Occupancy by Educational Attainment in East Rutherford borough
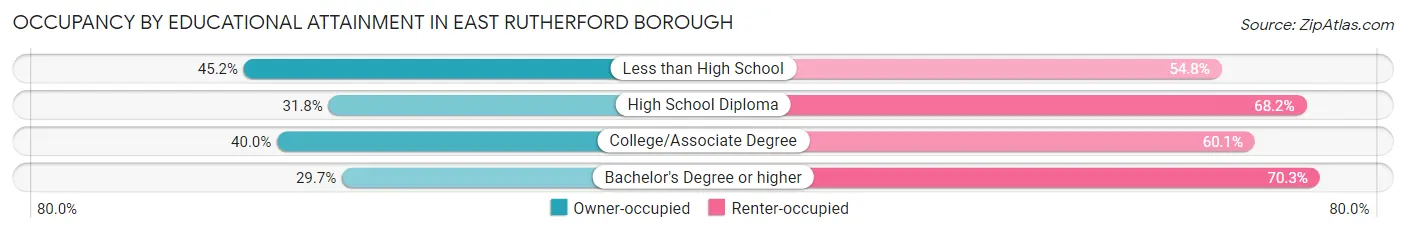
| Household Size | Owner-occupied | Renter-occupied |
| Less than High School | 123 (45.2%) | 149 (54.8%) |
| High School Diploma | 253 (31.8%) | 543 (68.2%) |
| College/Associate Degree | 473 (40.0%) | 711 (60.1%) |
| Bachelor's Degree or higher | 595 (29.7%) | 1,411 (70.3%) |
Occupancy by Age of Householder in East Rutherford borough
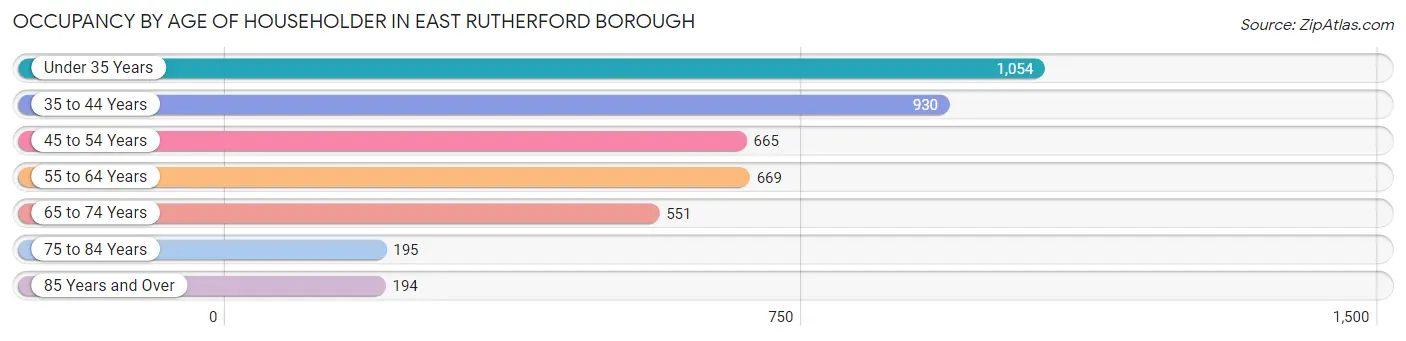
| Age Bracket | # Households | % Households |
| Under 35 Years | 1,054 | 24.7% |
| 35 to 44 Years | 930 | 21.8% |
| 45 to 54 Years | 665 | 15.6% |
| 55 to 64 Years | 669 | 15.7% |
| 65 to 74 Years | 551 | 12.9% |
| 75 to 84 Years | 195 | 4.6% |
| 85 Years and Over | 194 | 4.6% |
| Total | 4,258 | 100.0% |
Housing Finances in East Rutherford borough
Median Income by Occupancy in East Rutherford borough
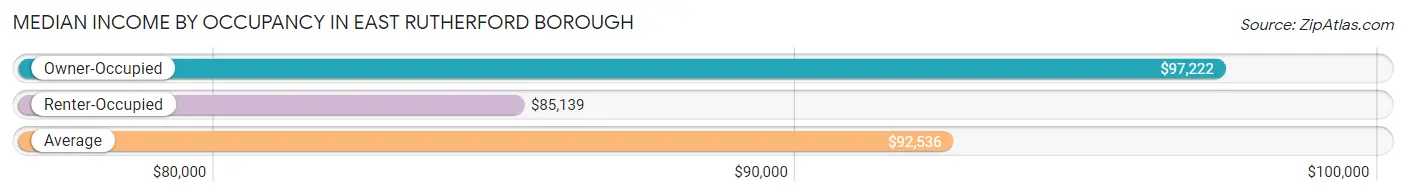
| Occupancy Type | # Households | Median Income |
| Owner-Occupied | 1,444 (33.9%) | $97,222 |
| Renter-Occupied | 2,814 (66.1%) | $85,139 |
| Average | 4,258 (100.0%) | $92,536 |
Occupancy by Householder Income Bracket in East Rutherford borough
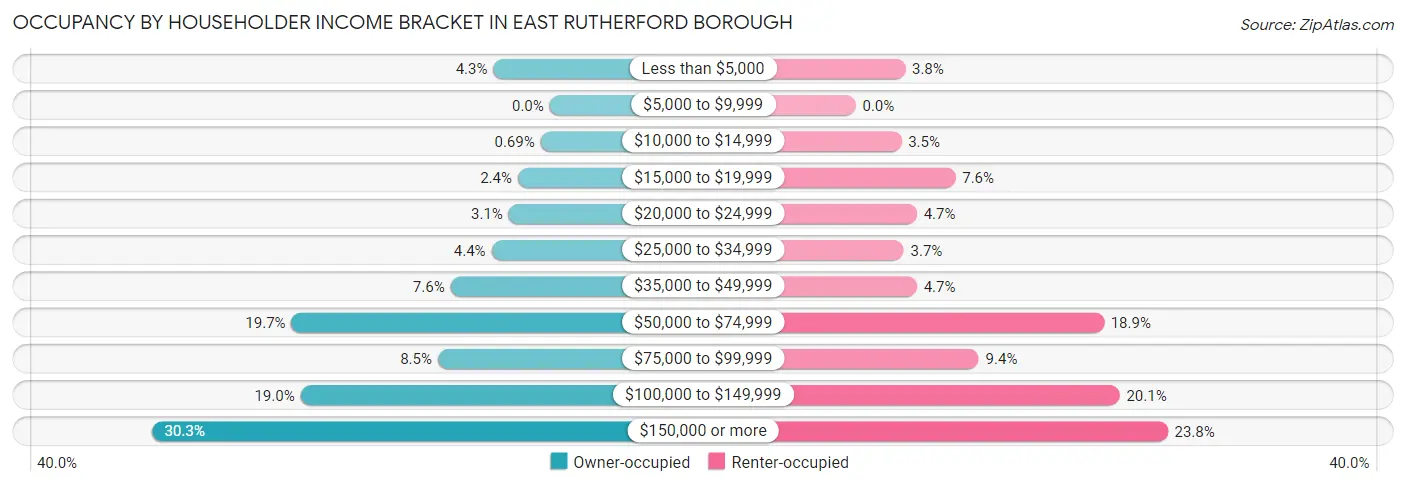
| Income Bracket | Owner-occupied | Renter-occupied |
| Less than $5,000 | 62 (4.3%) | 106 (3.8%) |
| $5,000 to $9,999 | 0 (0.0%) | 0 (0.0%) |
| $10,000 to $14,999 | 10 (0.7%) | 98 (3.5%) |
| $15,000 to $19,999 | 35 (2.4%) | 214 (7.6%) |
| $20,000 to $24,999 | 45 (3.1%) | 131 (4.7%) |
| $25,000 to $34,999 | 64 (4.4%) | 103 (3.7%) |
| $35,000 to $49,999 | 109 (7.5%) | 131 (4.7%) |
| $50,000 to $74,999 | 284 (19.7%) | 532 (18.9%) |
| $75,000 to $99,999 | 123 (8.5%) | 264 (9.4%) |
| $100,000 to $149,999 | 274 (19.0%) | 566 (20.1%) |
| $150,000 or more | 438 (30.3%) | 669 (23.8%) |
| Total | 1,444 (100.0%) | 2,814 (100.0%) |
Monthly Housing Cost Tiers in East Rutherford borough
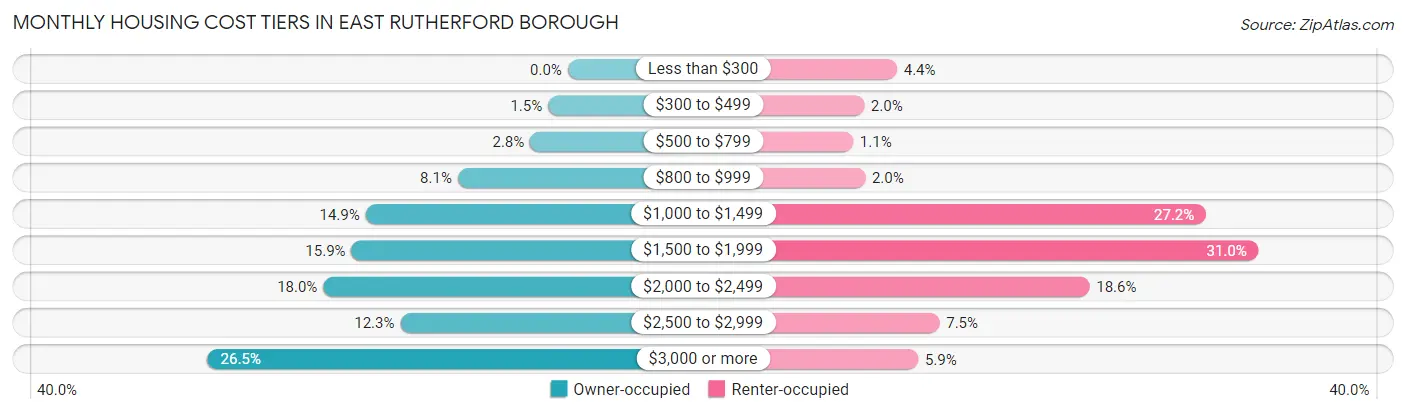
| Monthly Cost | Owner-occupied | Renter-occupied |
| Less than $300 | 0 (0.0%) | 123 (4.4%) |
| $300 to $499 | 21 (1.5%) | 55 (1.9%) |
| $500 to $799 | 40 (2.8%) | 32 (1.1%) |
| $800 to $999 | 117 (8.1%) | 57 (2.0%) |
| $1,000 to $1,499 | 215 (14.9%) | 764 (27.2%) |
| $1,500 to $1,999 | 230 (15.9%) | 873 (31.0%) |
| $2,000 to $2,499 | 260 (18.0%) | 522 (18.5%) |
| $2,500 to $2,999 | 178 (12.3%) | 211 (7.5%) |
| $3,000 or more | 383 (26.5%) | 167 (5.9%) |
| Total | 1,444 (100.0%) | 2,814 (100.0%) |
Physical Housing Characteristics in East Rutherford borough
Housing Structures in East Rutherford borough
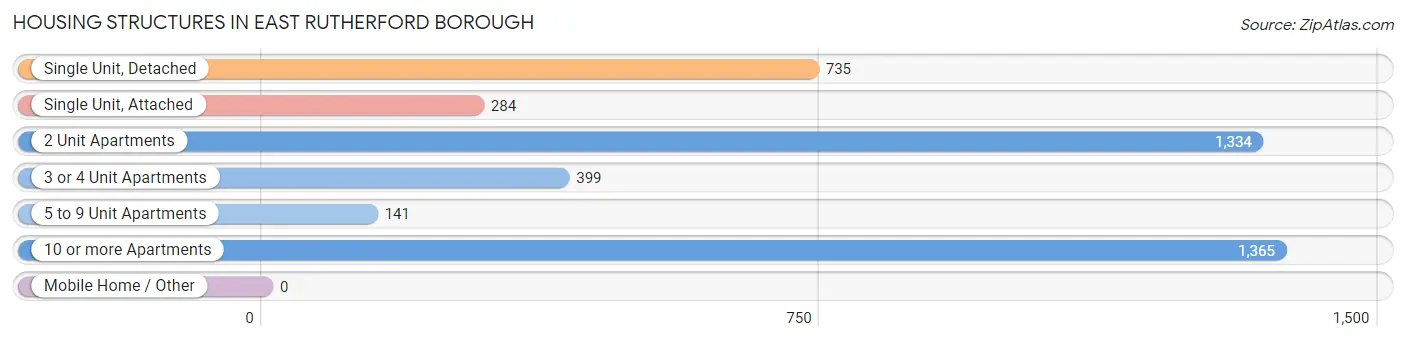
| Structure Type | # Housing Units | % Housing Units |
| Single Unit, Detached | 735 | 17.3% |
| Single Unit, Attached | 284 | 6.7% |
| 2 Unit Apartments | 1,334 | 31.3% |
| 3 or 4 Unit Apartments | 399 | 9.4% |
| 5 to 9 Unit Apartments | 141 | 3.3% |
| 10 or more Apartments | 1,365 | 32.1% |
| Mobile Home / Other | 0 | 0.0% |
| Total | 4,258 | 100.0% |
Housing Structures by Occupancy in East Rutherford borough
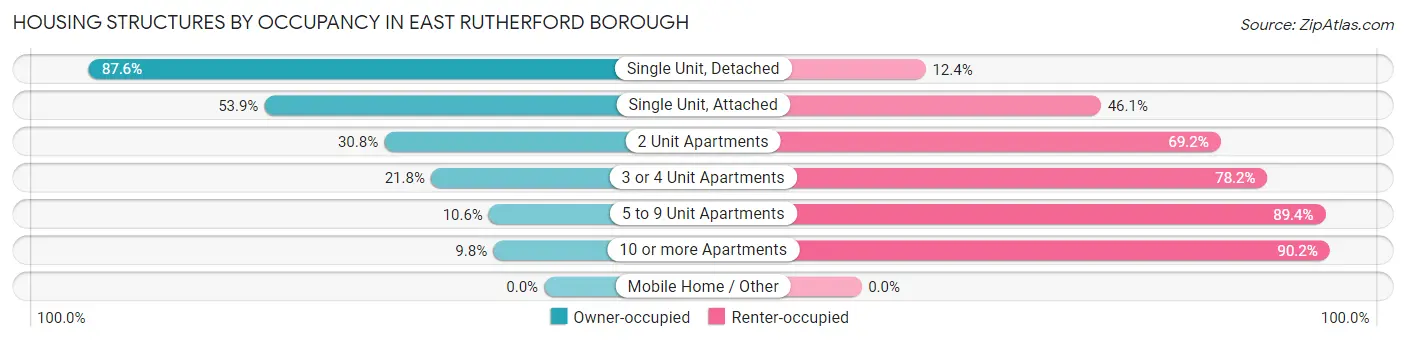
| Structure Type | Owner-occupied | Renter-occupied |
| Single Unit, Detached | 644 (87.6%) | 91 (12.4%) |
| Single Unit, Attached | 153 (53.9%) | 131 (46.1%) |
| 2 Unit Apartments | 411 (30.8%) | 923 (69.2%) |
| 3 or 4 Unit Apartments | 87 (21.8%) | 312 (78.2%) |
| 5 to 9 Unit Apartments | 15 (10.6%) | 126 (89.4%) |
| 10 or more Apartments | 134 (9.8%) | 1,231 (90.2%) |
| Mobile Home / Other | 0 (0.0%) | 0 (0.0%) |
| Total | 1,444 (33.9%) | 2,814 (66.1%) |
Housing Structures by Number of Rooms in East Rutherford borough
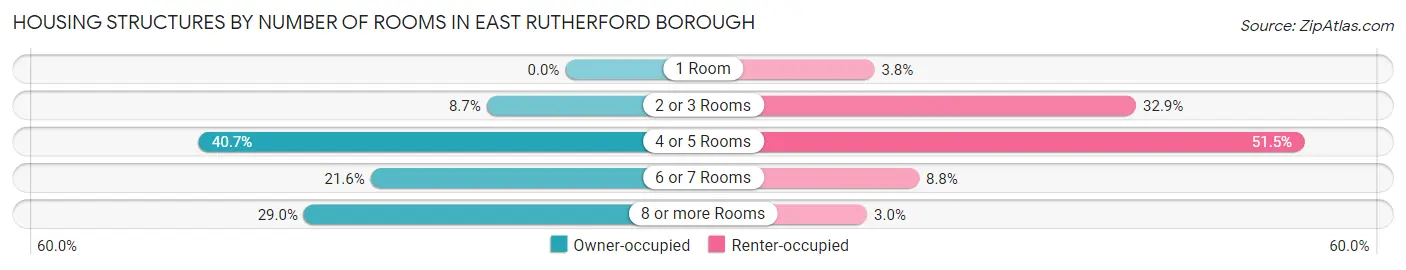
| Number of Rooms | Owner-occupied | Renter-occupied |
| 1 Room | 0 (0.0%) | 108 (3.8%) |
| 2 or 3 Rooms | 126 (8.7%) | 925 (32.9%) |
| 4 or 5 Rooms | 587 (40.6%) | 1,449 (51.5%) |
| 6 or 7 Rooms | 312 (21.6%) | 247 (8.8%) |
| 8 or more Rooms | 419 (29.0%) | 85 (3.0%) |
| Total | 1,444 (100.0%) | 2,814 (100.0%) |
Housing Structure by Heating Type in East Rutherford borough
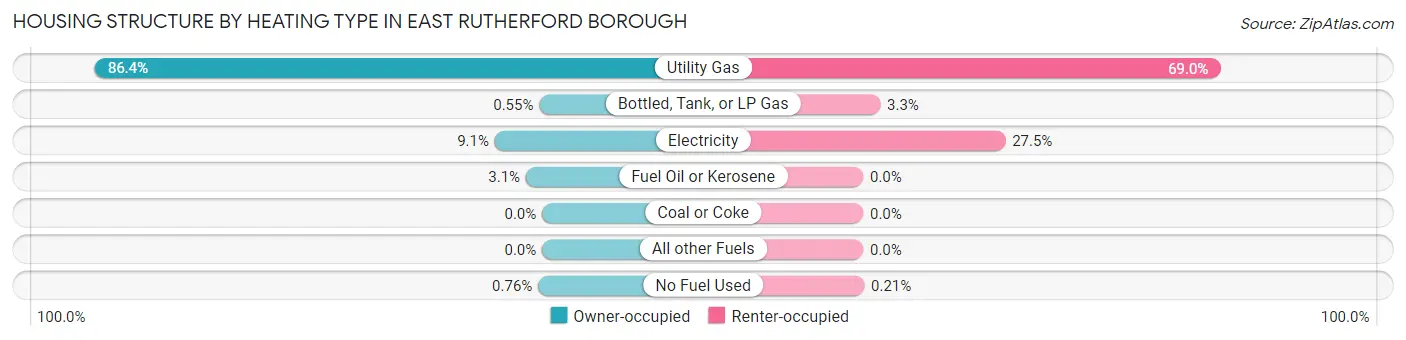
| Heating Type | Owner-occupied | Renter-occupied |
| Utility Gas | 1,248 (86.4%) | 1,942 (69.0%) |
| Bottled, Tank, or LP Gas | 8 (0.5%) | 93 (3.3%) |
| Electricity | 132 (9.1%) | 773 (27.5%) |
| Fuel Oil or Kerosene | 45 (3.1%) | 0 (0.0%) |
| Coal or Coke | 0 (0.0%) | 0 (0.0%) |
| All other Fuels | 0 (0.0%) | 0 (0.0%) |
| No Fuel Used | 11 (0.8%) | 6 (0.2%) |
| Total | 1,444 (100.0%) | 2,814 (100.0%) |
Household Vehicle Usage in East Rutherford borough
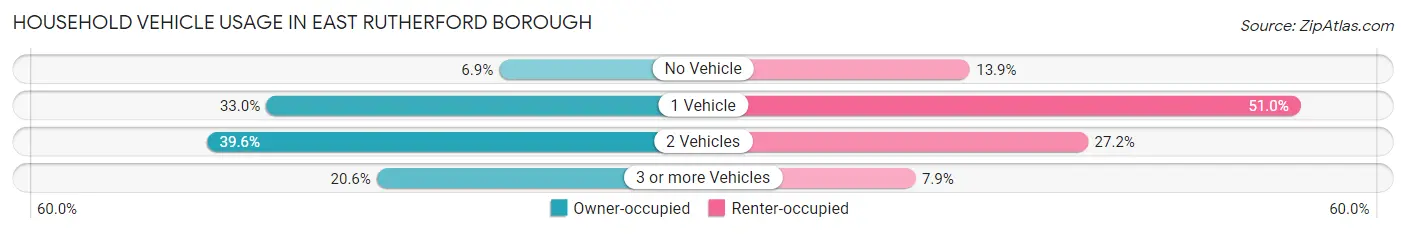
| Vehicles per Household | Owner-occupied | Renter-occupied |
| No Vehicle | 99 (6.9%) | 392 (13.9%) |
| 1 Vehicle | 476 (33.0%) | 1,436 (51.0%) |
| 2 Vehicles | 572 (39.6%) | 765 (27.2%) |
| 3 or more Vehicles | 297 (20.6%) | 221 (7.9%) |
| Total | 1,444 (100.0%) | 2,814 (100.0%) |
Real Estate & Mortgages in East Rutherford borough
Real Estate and Mortgage Overview in East Rutherford borough
| Characteristic | Without Mortgage | With Mortgage |
| Housing Units | 425 | 1,019 |
| Median Property Value | $434,200 | $453,700 |
| Median Household Income | $65,858 | $386 |
| Monthly Housing Costs | $1,031 | $383 |
| Real Estate Taxes | $8,438 | $0 |
Property Value by Mortgage Status in East Rutherford borough
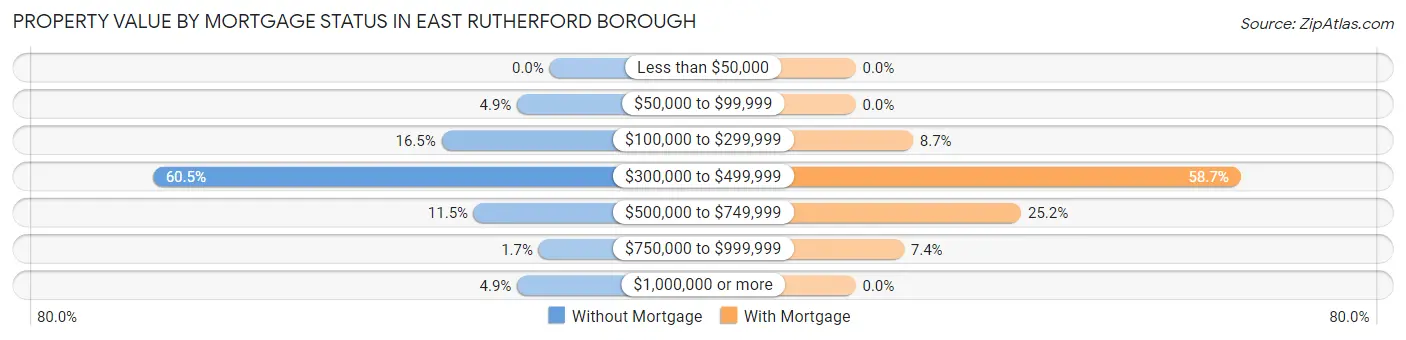
| Property Value | Without Mortgage | With Mortgage |
| Less than $50,000 | 0 (0.0%) | 0 (0.0%) |
| $50,000 to $99,999 | 21 (4.9%) | 0 (0.0%) |
| $100,000 to $299,999 | 70 (16.5%) | 89 (8.7%) |
| $300,000 to $499,999 | 257 (60.5%) | 598 (58.7%) |
| $500,000 to $749,999 | 49 (11.5%) | 257 (25.2%) |
| $750,000 to $999,999 | 7 (1.7%) | 75 (7.4%) |
| $1,000,000 or more | 21 (4.9%) | 0 (0.0%) |
| Total | 425 (100.0%) | 1,019 (100.0%) |
Household Income by Mortgage Status in East Rutherford borough
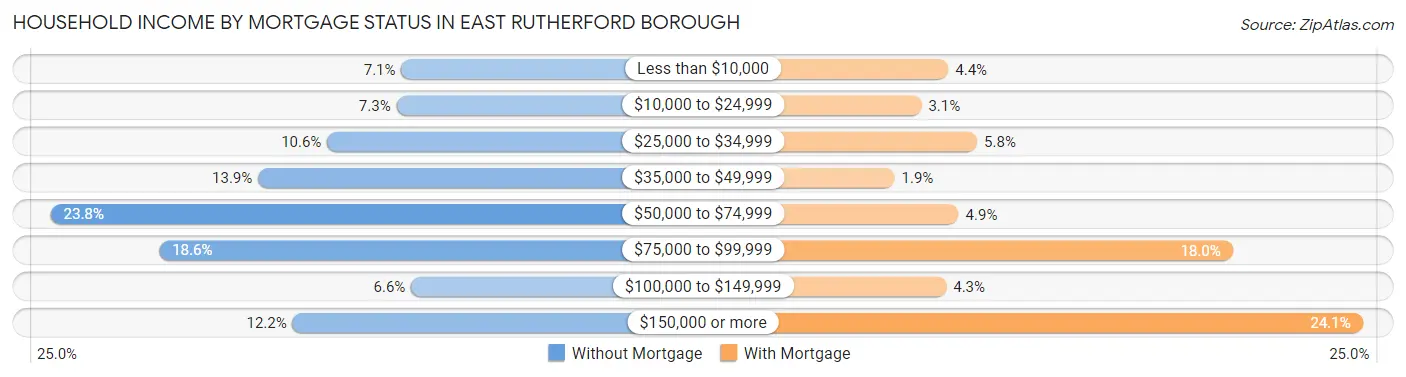
| Household Income | Without Mortgage | With Mortgage |
| Less than $10,000 | 30 (7.1%) | 45 (4.4%) |
| $10,000 to $24,999 | 31 (7.3%) | 32 (3.1%) |
| $25,000 to $34,999 | 45 (10.6%) | 59 (5.8%) |
| $35,000 to $49,999 | 59 (13.9%) | 19 (1.9%) |
| $50,000 to $74,999 | 101 (23.8%) | 50 (4.9%) |
| $75,000 to $99,999 | 79 (18.6%) | 183 (18.0%) |
| $100,000 to $149,999 | 28 (6.6%) | 44 (4.3%) |
| $150,000 or more | 52 (12.2%) | 246 (24.1%) |
| Total | 425 (100.0%) | 1,019 (100.0%) |
Property Value to Household Income Ratio in East Rutherford borough
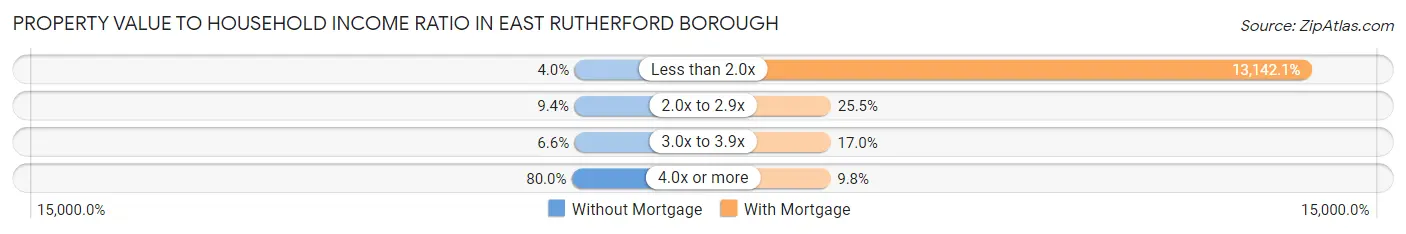
| Value-to-Income Ratio | Without Mortgage | With Mortgage |
| Less than 2.0x | 17 (4.0%) | 133,918 (13,142.1%) |
| 2.0x to 2.9x | 40 (9.4%) | 260 (25.5%) |
| 3.0x to 3.9x | 28 (6.6%) | 173 (17.0%) |
| 4.0x or more | 340 (80.0%) | 100 (9.8%) |
| Total | 425 (100.0%) | 1,019 (100.0%) |
Real Estate Taxes by Mortgage Status in East Rutherford borough
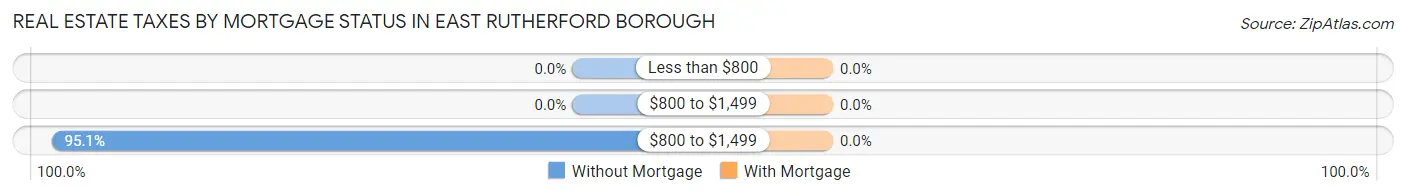
| Property Taxes | Without Mortgage | With Mortgage |
| Less than $800 | 0 (0.0%) | 0 (0.0%) |
| $800 to $1,499 | 0 (0.0%) | 0 (0.0%) |
| $800 to $1,499 | 404 (95.1%) | 0 (0.0%) |
| Total | 425 (100.0%) | 1,019 (100.0%) |
Health & Disability in East Rutherford borough
Health Insurance Coverage by Age in East Rutherford borough
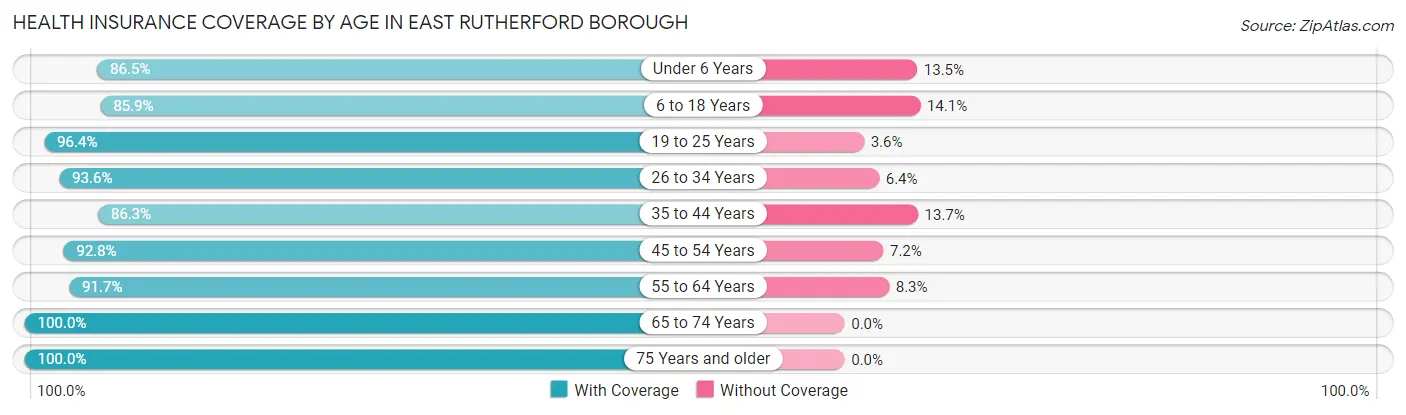
| Age Bracket | With Coverage | Without Coverage |
| Under 6 Years | 863 (86.5%) | 135 (13.5%) |
| 6 to 18 Years | 615 (85.9%) | 101 (14.1%) |
| 19 to 25 Years | 959 (96.4%) | 36 (3.6%) |
| 26 to 34 Years | 1,689 (93.6%) | 116 (6.4%) |
| 35 to 44 Years | 1,572 (86.3%) | 249 (13.7%) |
| 45 to 54 Years | 1,003 (92.8%) | 78 (7.2%) |
| 55 to 64 Years | 1,117 (91.7%) | 101 (8.3%) |
| 65 to 74 Years | 888 (100.0%) | 0 (0.0%) |
| 75 Years and older | 498 (100.0%) | 0 (0.0%) |
| Total | 9,204 (91.9%) | 816 (8.1%) |
Health Insurance Coverage by Citizenship Status in East Rutherford borough
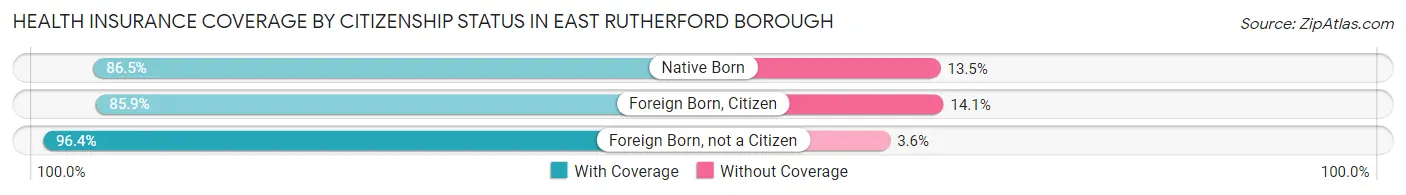
| Citizenship Status | With Coverage | Without Coverage |
| Native Born | 863 (86.5%) | 135 (13.5%) |
| Foreign Born, Citizen | 615 (85.9%) | 101 (14.1%) |
| Foreign Born, not a Citizen | 959 (96.4%) | 36 (3.6%) |
Health Insurance Coverage by Household Income in East Rutherford borough
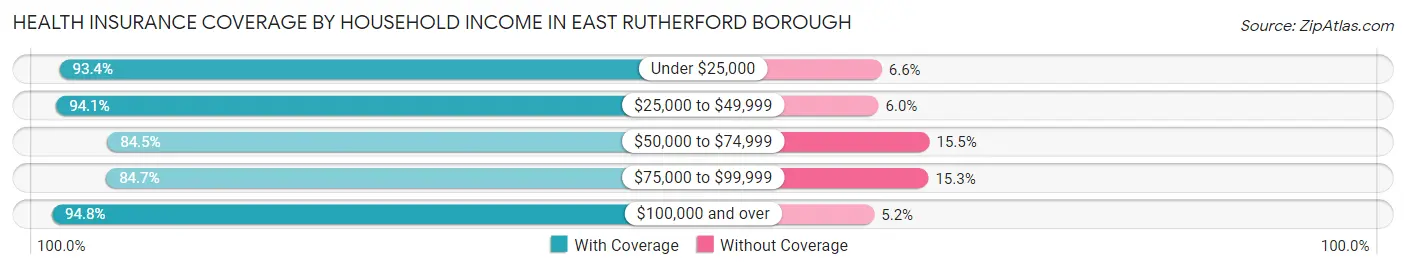
| Household Income | With Coverage | Without Coverage |
| Under $25,000 | 868 (93.4%) | 61 (6.6%) |
| $25,000 to $49,999 | 727 (94.1%) | 46 (5.9%) |
| $50,000 to $74,999 | 1,521 (84.5%) | 279 (15.5%) |
| $75,000 to $99,999 | 786 (84.7%) | 142 (15.3%) |
| $100,000 and over | 5,285 (94.8%) | 288 (5.2%) |
Public vs Private Health Insurance Coverage by Age in East Rutherford borough
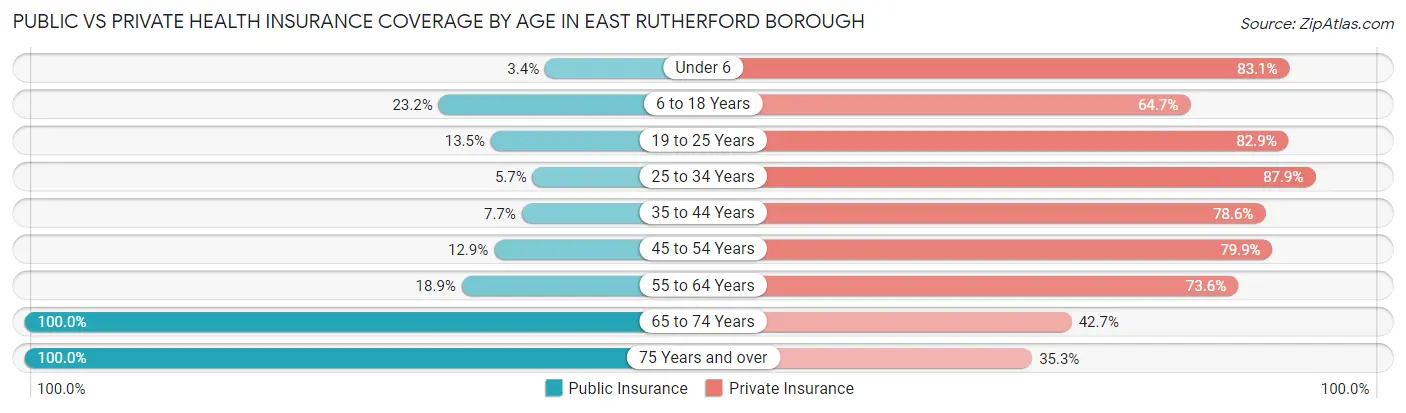
| Age Bracket | Public Insurance | Private Insurance |
| Under 6 | 34 (3.4%) | 829 (83.1%) |
| 6 to 18 Years | 166 (23.2%) | 463 (64.7%) |
| 19 to 25 Years | 134 (13.5%) | 825 (82.9%) |
| 25 to 34 Years | 103 (5.7%) | 1,586 (87.9%) |
| 35 to 44 Years | 141 (7.7%) | 1,431 (78.6%) |
| 45 to 54 Years | 139 (12.9%) | 864 (79.9%) |
| 55 to 64 Years | 230 (18.9%) | 896 (73.6%) |
| 65 to 74 Years | 888 (100.0%) | 379 (42.7%) |
| 75 Years and over | 498 (100.0%) | 176 (35.3%) |
| Total | 2,333 (23.3%) | 7,449 (74.3%) |
Disability Status by Sex by Age in East Rutherford borough
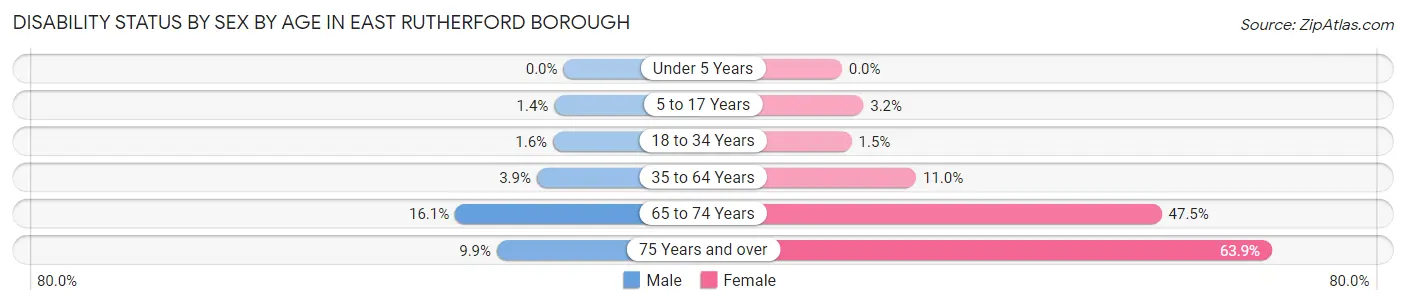
| Age Bracket | Male | Female |
| Under 5 Years | 0 (0.0%) | 0 (0.0%) |
| 5 to 17 Years | 6 (1.4%) | 10 (3.2%) |
| 18 to 34 Years | 20 (1.5%) | 23 (1.5%) |
| 35 to 64 Years | 78 (3.9%) | 236 (11.0%) |
| 65 to 74 Years | 69 (16.1%) | 218 (47.5%) |
| 75 Years and over | 15 (9.9%) | 221 (63.9%) |
Disability Class by Sex by Age in East Rutherford borough
Disability Class: Hearing Difficulty
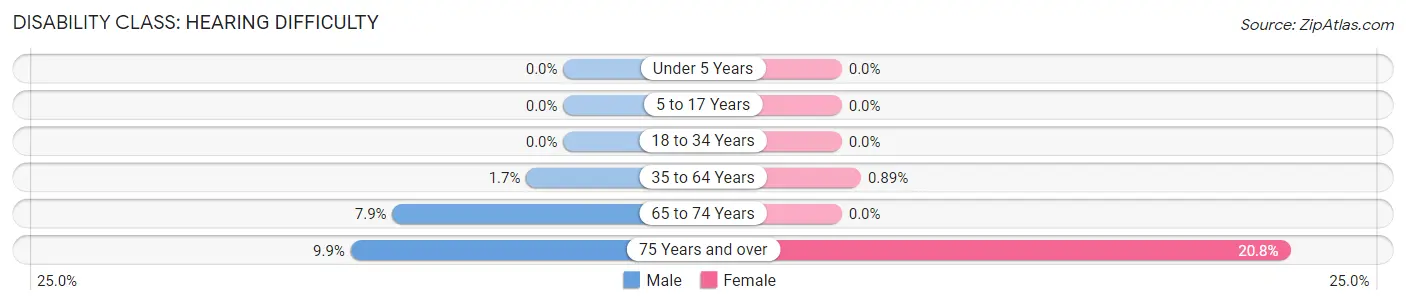
| Age Bracket | Male | Female |
| Under 5 Years | 0 (0.0%) | 0 (0.0%) |
| 5 to 17 Years | 0 (0.0%) | 0 (0.0%) |
| 18 to 34 Years | 0 (0.0%) | 0 (0.0%) |
| 35 to 64 Years | 34 (1.7%) | 19 (0.9%) |
| 65 to 74 Years | 34 (7.9%) | 0 (0.0%) |
| 75 Years and over | 15 (9.9%) | 72 (20.8%) |
Disability Class: Vision Difficulty
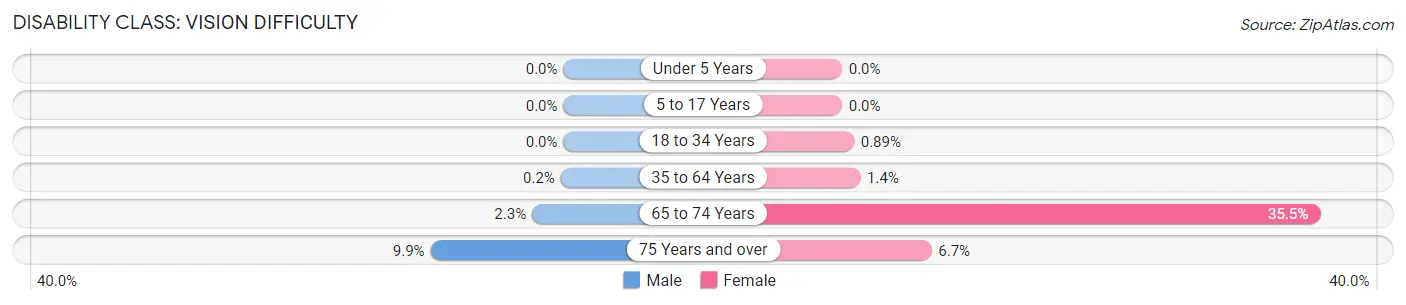
| Age Bracket | Male | Female |
| Under 5 Years | 0 (0.0%) | 0 (0.0%) |
| 5 to 17 Years | 0 (0.0%) | 0 (0.0%) |
| 18 to 34 Years | 0 (0.0%) | 14 (0.9%) |
| 35 to 64 Years | 4 (0.2%) | 29 (1.4%) |
| 65 to 74 Years | 10 (2.3%) | 163 (35.5%) |
| 75 Years and over | 15 (9.9%) | 23 (6.7%) |
Disability Class: Cognitive Difficulty
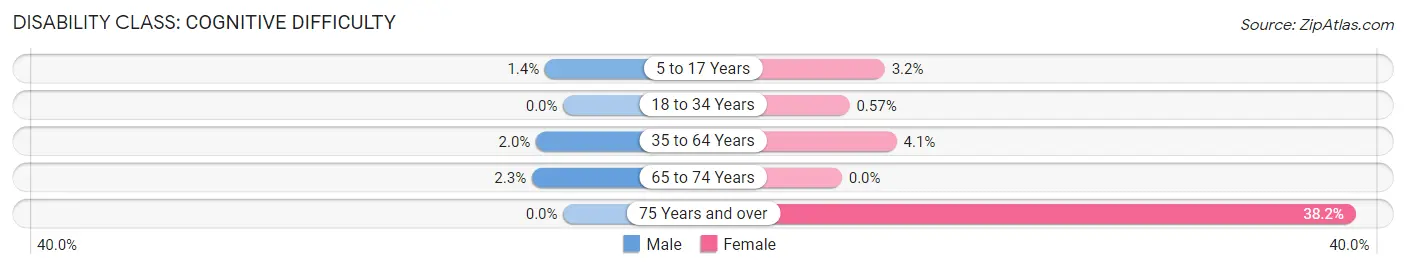
| Age Bracket | Male | Female |
| 5 to 17 Years | 6 (1.4%) | 10 (3.2%) |
| 18 to 34 Years | 0 (0.0%) | 9 (0.6%) |
| 35 to 64 Years | 40 (2.0%) | 87 (4.1%) |
| 65 to 74 Years | 10 (2.3%) | 0 (0.0%) |
| 75 Years and over | 0 (0.0%) | 132 (38.2%) |
Disability Class: Ambulatory Difficulty
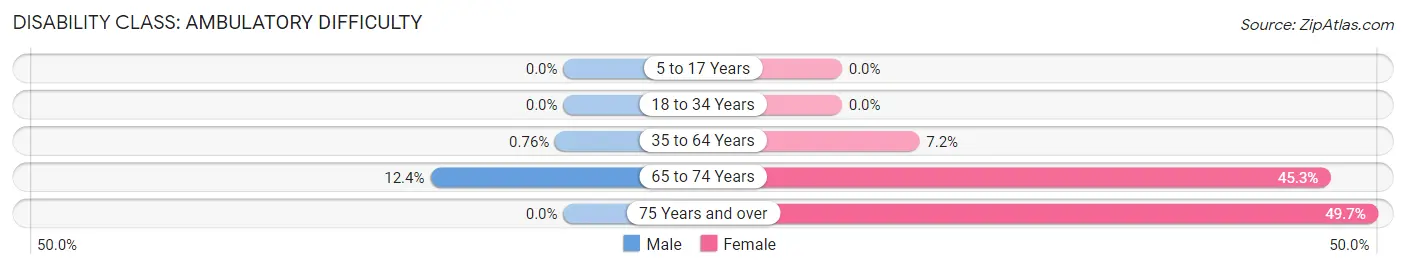
| Age Bracket | Male | Female |
| 5 to 17 Years | 0 (0.0%) | 0 (0.0%) |
| 18 to 34 Years | 0 (0.0%) | 0 (0.0%) |
| 35 to 64 Years | 15 (0.8%) | 154 (7.2%) |
| 65 to 74 Years | 53 (12.3%) | 208 (45.3%) |
| 75 Years and over | 0 (0.0%) | 172 (49.7%) |
Disability Class: Self-Care Difficulty
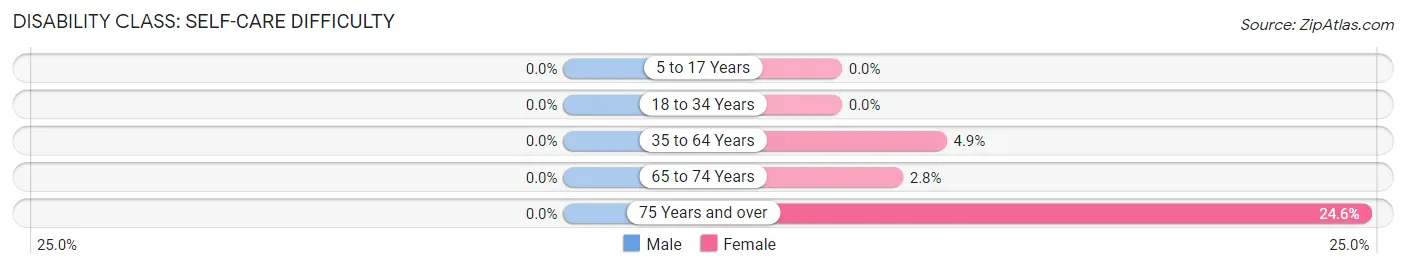
| Age Bracket | Male | Female |
| 5 to 17 Years | 0 (0.0%) | 0 (0.0%) |
| 18 to 34 Years | 0 (0.0%) | 0 (0.0%) |
| 35 to 64 Years | 0 (0.0%) | 104 (4.9%) |
| 65 to 74 Years | 0 (0.0%) | 13 (2.8%) |
| 75 Years and over | 0 (0.0%) | 85 (24.6%) |
Technology Access in East Rutherford borough
Computing Device Access in East Rutherford borough
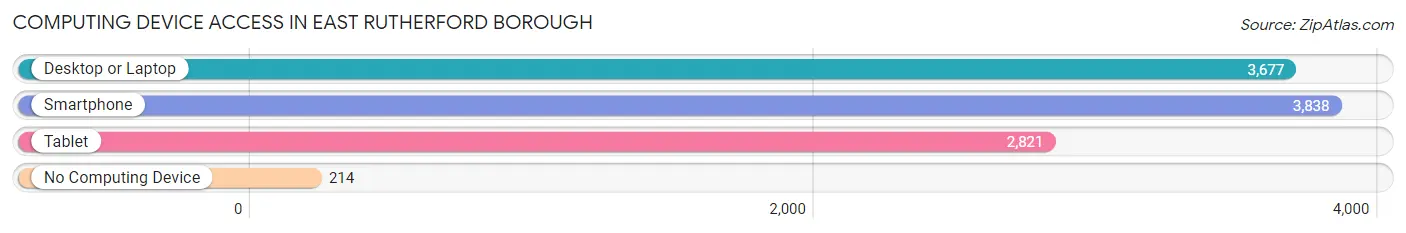
| Device Type | # Households | % Households |
| Desktop or Laptop | 3,677 | 86.4% |
| Smartphone | 3,838 | 90.1% |
| Tablet | 2,821 | 66.2% |
| No Computing Device | 214 | 5.0% |
| Total | 4,258 | 100.0% |
Internet Access in East Rutherford borough
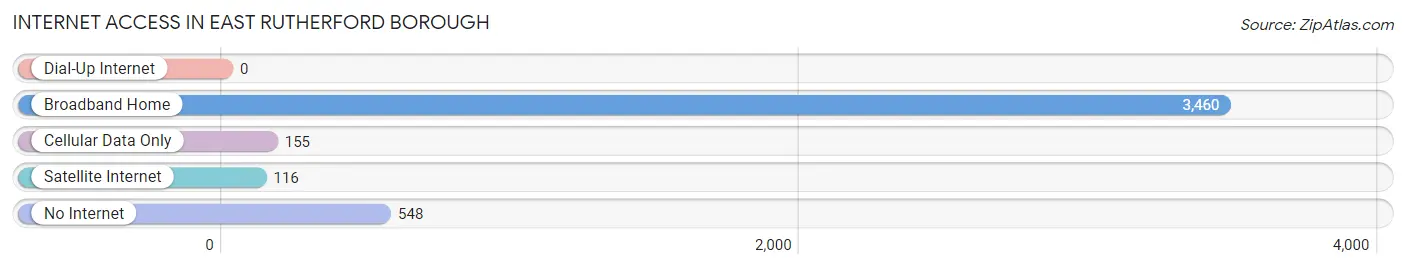
| Internet Type | # Households | % Households |
| Dial-Up Internet | 0 | 0.0% |
| Broadband Home | 3,460 | 81.3% |
| Cellular Data Only | 155 | 3.6% |
| Satellite Internet | 116 | 2.7% |
| No Internet | 548 | 12.9% |
| Total | 4,258 | 100.0% |
East Rutherford borough Summary
Introduction
East Rutherford Borough is a small borough located in Bergen County, New Jersey. It is situated in the heart of the Meadowlands region, just a few miles from New York City. The borough is home to the Meadowlands Sports Complex, which includes MetLife Stadium, the home of the New York Giants and New York Jets. East Rutherford is also home to the American Dream Meadowlands, a large shopping and entertainment complex. The borough has a population of 8,913 as of the 2010 census, making it the smallest municipality in Bergen County.
History
East Rutherford was originally part of the Borough of Rutherford, which was incorporated in 1881. In 1894, the Borough of East Rutherford was created from the eastern portion of Rutherford. The borough was named after John Rutherfurd, a prominent landowner in the area.
The borough was primarily a rural farming community until the 1950s, when the area began to experience rapid growth due to its proximity to New York City. The borough was home to a number of factories and warehouses, as well as the Meadowlands Sports Complex, which opened in 1976.
Geography
East Rutherford is located in the Meadowlands region of New Jersey, just a few miles from New York City. The borough is bordered by the Borough of Carlstadt to the north, the Borough of Rutherford to the west, the Borough of Wallington to the south, and the Borough of Lyndhurst to the east. The borough is situated on the Hackensack River, which forms its eastern border.
The borough has a total area of 2.3 square miles, all of which is land. The borough is mostly flat, with some low hills in the western part of the borough.
Economy
East Rutherford is home to a number of businesses and industries. The borough is home to the Meadowlands Sports Complex, which includes MetLife Stadium, the home of the New York Giants and New York Jets. The complex also includes the Meadowlands Racetrack, which hosts horse racing and other events. The borough is also home to the American Dream Meadowlands, a large shopping and entertainment complex.
The borough is also home to a number of warehouses and factories, as well as several corporate offices. The borough is home to the headquarters of the National Football League, as well as the headquarters of the New York Giants and New York Jets.
Demographics
As of the 2010 census, there were 8,913 people, 3,541 households, and 2,323 families residing in the borough. The population density was 3,890.3 people per square mile. The racial makeup of the borough was 79.2% White, 8.3% African American, 0.2% Native American, 5.7% Asian, 0.1% Pacific Islander, 4.2% from other races, and 2.3% from two or more races. Hispanic or Latino of any race were 11.7% of the population.
The median income for a household in the borough was $63,917, and the median income for a family was $76,917. The per capita income for the borough was $30,917. About 5.2% of families and 7.2% of the population were below the poverty line, including 8.3% of those under age 18 and 6.2% of those age 65 or over.
Conclusion
East Rutherford Borough is a small borough located in Bergen County, New Jersey. It is situated in the heart of the Meadowlands region, just a few miles from New York City. The borough is home to the Meadowlands Sports Complex, which includes MetLife Stadium, the home of the New York Giants and New York Jets. East Rutherford is also home to the American Dream Meadowlands, a large shopping and entertainment complex. The borough has a population of 8,913 as of the 2010 census, making it the smallest municipality in Bergen County. The borough is home to a number of businesses and industries, as well as a diverse population.
Common Questions
What is Per Capita Income in East Rutherford borough?
Per Capita income in East Rutherford borough is $48,616.
What is the Median Family Income in East Rutherford borough?
Median Family Income in East Rutherford borough is $110,271.
What is the Median Household income in East Rutherford borough?
Median Household Income in East Rutherford borough is $92,536.
What is Income or Wage Gap in East Rutherford borough?
Income or Wage Gap in East Rutherford borough is 27.7%.
Women in East Rutherford borough earn 72.3 cents for every dollar earned by a man.
What is Inequality or Gini Index in East Rutherford borough?
Inequality or Gini Index in East Rutherford borough is 0.43.
What is the Total Population of East Rutherford borough?
Total Population of East Rutherford borough is 10,020.
What is the Total Male Population of East Rutherford borough?
Total Male Population of East Rutherford borough is 4,683.
What is the Total Female Population of East Rutherford borough?
Total Female Population of East Rutherford borough is 5,337.
What is the Ratio of Males per 100 Females in East Rutherford borough?
There are 87.75 Males per 100 Females in East Rutherford borough.
What is the Ratio of Females per 100 Males in East Rutherford borough?
There are 113.97 Females per 100 Males in East Rutherford borough.
What is the Median Population Age in East Rutherford borough?
Median Population Age in East Rutherford borough is 38.3 Years.
What is the Average Family Size in East Rutherford borough
Average Family Size in East Rutherford borough is 3.0 People.
What is the Average Household Size in East Rutherford borough
Average Household Size in East Rutherford borough is 2.4 People.
How Large is the Labor Force in East Rutherford borough?
There are 5,896 People in the Labor Forcein in East Rutherford borough.
What is the Percentage of People in the Labor Force in East Rutherford borough?
69.5% of People are in the Labor Force in East Rutherford borough.
What is the Unemployment Rate in East Rutherford borough?
Unemployment Rate in East Rutherford borough is 4.2%.