Cities with the Highest Percentage of Renter-Occupied Units in New Jersey
RELATED REPORTS & OPTIONS
Highest Renter-Occupied
New Jersey
Compare Cities
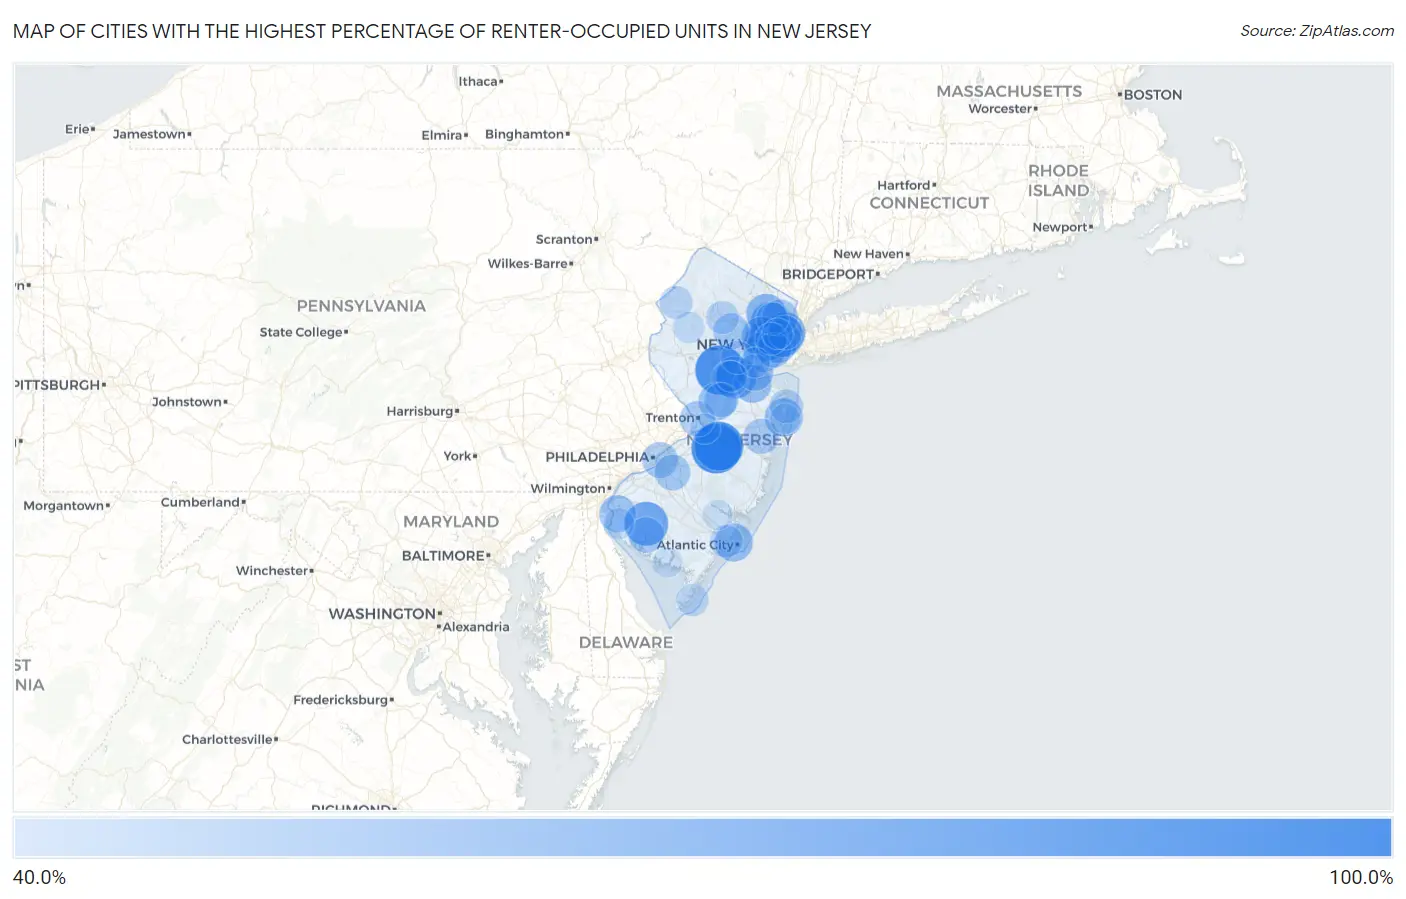
Map of Cities with the Highest Percentage of Renter-Occupied Units in New Jersey
0.0%
100.0%
Cities with the Highest Percentage of Renter-Occupied Units in New Jersey
| City | % Renter-Occupied | vs State | vs National | |
| 1. | Rutgers University-Busch Campus | 100.0% | 36.1%(+63.9)#1 | 35.2%(+64.8)#7 |
| 2. | The College Of New Jersey | 100.0% | 36.1%(+63.9)#2 | 35.2%(+64.8)#16 |
| 3. | Teterboro Borough | 100.0% | 36.1%(+63.9)#3 | 35.2%(+64.8)#122 |
| 4. | Zarephath | 100.0% | 36.1%(+63.9)#4 | 35.2%(+64.8)#138 |
| 5. | Fort Dix | 99.8% | 36.1%(+63.6)#5 | 35.2%(+64.6)#235 |
| 6. | Mcguire Afb | 98.1% | 36.1%(+62.0)#6 | 35.2%(+62.9)#269 |
| 7. | Audubon Park Borough | 89.9% | 36.1%(+53.7)#7 | 35.2%(+54.7)#332 |
| 8. | Seabrook Farms | 84.9% | 36.1%(+48.7)#8 | 35.2%(+49.7)#373 |
| 9. | Keasbey | 83.5% | 36.1%(+47.4)#9 | 35.2%(+48.3)#388 |
| 10. | Union City | 80.3% | 36.1%(+44.2)#10 | 35.2%(+45.1)#438 |
| 11. | New Brunswick | 79.8% | 36.1%(+43.7)#11 | 35.2%(+44.6)#451 |
| 12. | Harrison | 78.1% | 36.1%(+42.0)#12 | 35.2%(+42.9)#481 |
| 13. | Passaic | 78.0% | 36.1%(+41.8)#13 | 35.2%(+42.8)#486 |
| 14. | West New York | 76.5% | 36.1%(+40.3)#14 | 35.2%(+41.3)#518 |
| 15. | Newark | 76.1% | 36.1%(+40.0)#15 | 35.2%(+40.9)#521 |
| 16. | Elizabeth | 74.9% | 36.1%(+38.7)#16 | 35.2%(+39.7)#553 |
| 17. | Paterson | 73.7% | 36.1%(+37.6)#17 | 35.2%(+38.5)#578 |
| 18. | East Orange | 72.0% | 36.1%(+35.8)#18 | 35.2%(+36.8)#638 |
| 19. | Heislerville | 71.4% | 36.1%(+35.3)#19 | 35.2%(+36.2)#651 |
| 20. | Jersey City | 70.8% | 36.1%(+34.6)#20 | 35.2%(+35.6)#679 |
| 21. | Penns Grove Borough | 69.8% | 36.1%(+33.6)#21 | 35.2%(+34.6)#723 |
| 22. | Asbury Park | 69.2% | 36.1%(+33.1)#22 | 35.2%(+34.0)#753 |
| 23. | Atlantic City | 69.2% | 36.1%(+33.1)#23 | 35.2%(+34.0)#755 |
| 24. | Madison Park | 68.9% | 36.1%(+32.8)#24 | 35.2%(+33.8)#767 |
| 25. | Watsessing | 68.6% | 36.1%(+32.5)#25 | 35.2%(+33.4)#782 |
| 26. | Plainsboro Center | 68.0% | 36.1%(+31.9)#26 | 35.2%(+32.8)#801 |
| 27. | Fairview Borough | 67.5% | 36.1%(+31.3)#27 | 35.2%(+32.3)#820 |
| 28. | East Newark Borough | 67.3% | 36.1%(+31.1)#28 | 35.2%(+32.1)#835 |
| 29. | Hi Nella Borough | 66.3% | 36.1%(+30.1)#29 | 35.2%(+31.1)#890 |
| 30. | Salem | 66.2% | 36.1%(+30.1)#30 | 35.2%(+31.0)#892 |
| 31. | East Rutherford Borough | 66.1% | 36.1%(+30.0)#31 | 35.2%(+30.9)#897 |
| 32. | Cranford | 66.0% | 36.1%(+29.9)#32 | 35.2%(+30.8)#901 |
| 33. | Hoboken | 65.6% | 36.1%(+29.5)#33 | 35.2%(+30.4)#917 |
| 34. | Wallington Borough | 65.6% | 36.1%(+29.4)#34 | 35.2%(+30.4)#919 |
| 35. | Victory Gardens Borough | 65.2% | 36.1%(+29.1)#35 | 35.2%(+30.0)#933 |
| 36. | Perth Amboy | 64.7% | 36.1%(+28.5)#36 | 35.2%(+29.5)#976 |
| 37. | Voorhees | 64.2% | 36.1%(+28.0)#37 | 35.2%(+29.0)#1,015 |
| 38. | Lindenwold Borough | 64.1% | 36.1%(+27.9)#38 | 35.2%(+28.9)#1,023 |
| 39. | Flemington Borough | 63.7% | 36.1%(+27.6)#39 | 35.2%(+28.5)#1,043 |
| 40. | Hackensack | 63.5% | 36.1%(+27.4)#40 | 35.2%(+28.3)#1,061 |
| 41. | Morristown | 63.0% | 36.1%(+26.9)#41 | 35.2%(+27.8)#1,101 |
| 42. | Camden | 62.8% | 36.1%(+26.6)#42 | 35.2%(+27.6)#1,122 |
| 43. | Echelon | 62.7% | 36.1%(+26.6)#43 | 35.2%(+27.5)#1,126 |
| 44. | Prospect Park Borough | 62.7% | 36.1%(+26.6)#44 | 35.2%(+27.5)#1,129 |
| 45. | Palisades Park Borough | 62.5% | 36.1%(+26.4)#45 | 35.2%(+27.3)#1,146 |
| 46. | Bridgeton | 62.3% | 36.1%(+26.2)#46 | 35.2%(+27.2)#1,164 |
| 47. | Seaside Heights Borough | 61.8% | 36.1%(+25.6)#47 | 35.2%(+26.6)#1,207 |
| 48. | Trenton | 61.7% | 36.1%(+25.6)#48 | 35.2%(+26.5)#1,210 |
| 49. | Highland Park Borough | 61.6% | 36.1%(+25.5)#49 | 35.2%(+26.4)#1,221 |
| 50. | Lakewood | 61.4% | 36.1%(+25.2)#50 | 35.2%(+26.2)#1,247 |
| 51. | Bayonne | 60.8% | 36.1%(+24.7)#51 | 35.2%(+25.6)#1,292 |
| 52. | Little Ferry Borough | 59.8% | 36.1%(+23.7)#52 | 35.2%(+24.6)#1,395 |
| 53. | Princeton Meadows | 59.3% | 36.1%(+23.2)#53 | 35.2%(+24.1)#1,454 |
| 54. | Guttenberg | 58.9% | 36.1%(+22.7)#54 | 35.2%(+23.7)#1,496 |
| 55. | Edgewater Borough | 57.7% | 36.1%(+21.6)#55 | 35.2%(+22.5)#1,629 |
| 56. | Long Branch | 57.4% | 36.1%(+21.3)#56 | 35.2%(+22.2)#1,675 |
| 57. | Plainfield | 55.9% | 36.1%(+19.8)#57 | 35.2%(+20.7)#1,874 |
| 58. | Lodi Borough | 55.7% | 36.1%(+19.6)#58 | 35.2%(+20.5)#1,908 |
| 59. | Dover | 55.6% | 36.1%(+19.5)#59 | 35.2%(+20.4)#1,919 |
| 60. | Bound Brook Borough | 55.4% | 36.1%(+19.2)#60 | 35.2%(+20.2)#1,972 |
| 61. | Blairstown | 55.1% | 36.1%(+19.0)#61 | 35.2%(+20.0)#2,004 |
| 62. | Wrightstown Borough | 55.1% | 36.1%(+18.9)#62 | 35.2%(+19.9)#2,027 |
| 63. | Sussex Borough | 55.0% | 36.1%(+18.8)#63 | 35.2%(+19.8)#2,040 |
| 64. | Pleasantville | 55.0% | 36.1%(+18.8)#64 | 35.2%(+19.8)#2,041 |
| 65. | Three Bridges | 54.6% | 36.1%(+18.5)#65 | 35.2%(+19.4)#2,094 |
| 66. | Windsor | 54.3% | 36.1%(+18.2)#66 | 35.2%(+19.2)#2,131 |
| 67. | Bradley Beach Borough | 54.3% | 36.1%(+18.2)#67 | 35.2%(+19.2)#2,132 |
| 68. | Somerville Borough | 53.9% | 36.1%(+17.8)#68 | 35.2%(+18.8)#2,189 |
| 69. | Ridgefield Borough | 53.8% | 36.1%(+17.7)#69 | 35.2%(+18.7)#2,205 |
| 70. | Wildwood | 53.5% | 36.1%(+17.3)#70 | 35.2%(+18.3)#2,277 |
| 71. | Garfield | 53.4% | 36.1%(+17.3)#71 | 35.2%(+18.3)#2,280 |
| 72. | North Arlington Borough | 53.0% | 36.1%(+16.9)#72 | 35.2%(+17.8)#2,377 |
| 73. | Kearny | 52.8% | 36.1%(+16.7)#73 | 35.2%(+17.7)#2,415 |
| 74. | Deerfield Street | 52.3% | 36.1%(+16.1)#74 | 35.2%(+17.1)#2,534 |
| 75. | Cliffside Park Borough | 51.7% | 36.1%(+15.6)#75 | 35.2%(+16.5)#2,654 |
| 76. | Washington Borough | 51.7% | 36.1%(+15.5)#76 | 35.2%(+16.5)#2,665 |
| 77. | Parsippany | 51.5% | 36.1%(+15.4)#77 | 35.2%(+16.3)#2,701 |
| 78. | Caldwell Borough | 51.4% | 36.1%(+15.2)#78 | 35.2%(+16.2)#2,736 |
| 79. | Beattystown | 51.3% | 36.1%(+15.1)#79 | 35.2%(+16.1)#2,768 |
| 80. | Silver Lake Cdp Essex County | 51.1% | 36.1%(+14.9)#80 | 35.2%(+15.9)#2,824 |
| 81. | Haledon Borough | 50.4% | 36.1%(+14.3)#81 | 35.2%(+15.3)#2,980 |
| 82. | Hancocks Bridge | 50.4% | 36.1%(+14.2)#82 | 35.2%(+15.2)#2,999 |
| 83. | Clementon Borough | 50.0% | 36.1%(+13.9)#83 | 35.2%(+14.8)#3,079 |
| 84. | Sunset Lake | 50.0% | 36.1%(+13.9)#84 | 35.2%(+14.8)#3,087 |
| 85. | East Franklin | 49.8% | 36.1%(+13.6)#85 | 35.2%(+14.6)#3,184 |
| 86. | Secaucus | 49.2% | 36.1%(+13.1)#86 | 35.2%(+14.1)#3,315 |
| 87. | Belmar Borough | 49.1% | 36.1%(+13.0)#87 | 35.2%(+13.9)#3,337 |
| 88. | Freehold Borough | 49.0% | 36.1%(+12.8)#88 | 35.2%(+13.8)#3,382 |
| 89. | Garwood Borough | 48.9% | 36.1%(+12.7)#89 | 35.2%(+13.7)#3,409 |
| 90. | Green | 48.9% | 36.1%(+12.7)#90 | 35.2%(+13.7)#3,414 |
| 91. | Keansburg Borough | 48.8% | 36.1%(+12.7)#91 | 35.2%(+13.6)#3,441 |
| 92. | Ocean Grove | 48.7% | 36.1%(+12.6)#92 | 35.2%(+13.6)#3,458 |
| 93. | Woodlynne Borough | 48.4% | 36.1%(+12.3)#93 | 35.2%(+13.3)#3,543 |
| 94. | Red Bank Borough | 48.2% | 36.1%(+12.1)#94 | 35.2%(+13.0)#3,605 |
| 95. | Bordentown | 48.1% | 36.1%(+12.0)#95 | 35.2%(+13.0)#3,641 |
| 96. | Avenel | 48.1% | 36.1%(+11.9)#96 | 35.2%(+12.9)#3,661 |
| 97. | Egg Harbor City | 48.0% | 36.1%(+11.8)#97 | 35.2%(+12.8)#3,682 |
| 98. | Port Norris | 48.0% | 36.1%(+11.8)#98 | 35.2%(+12.8)#3,686 |
| 99. | Ampere North | 48.0% | 36.1%(+11.8)#99 | 35.2%(+12.8)#3,687 |
| 100. | Netcong Borough | 47.7% | 36.1%(+11.6)#100 | 35.2%(+12.5)#3,783 |
Common Questions
What are the Top 10 Cities with the Highest Percentage of Renter-Occupied Units in New Jersey?
Top 10 Cities with the Highest Percentage of Renter-Occupied Units in New Jersey are:
#1
100.0%
#2
99.8%
#3
98.1%
#4
84.9%
#5
80.3%
#6
79.8%
#7
78.1%
#8
78.0%
#9
76.5%
#10
76.1%
What city has the Highest Percentage of Renter-Occupied Units in New Jersey?
Zarephath has the Highest Percentage of Renter-Occupied Units in New Jersey with 100.0%.
What is the Percentage of Renter-Occupied Units in the State of New Jersey?
Percentage of Renter-Occupied Units in New Jersey is 36.1%.
What is the Percentage of Renter-Occupied Units in the United States?
Percentage of Renter-Occupied Units in the United States is 35.2%.