Cities with the Highest Percentage of Immigrants from Liberia in New Jersey
RELATED REPORTS & OPTIONS
Liberia
New Jersey
Compare Cities
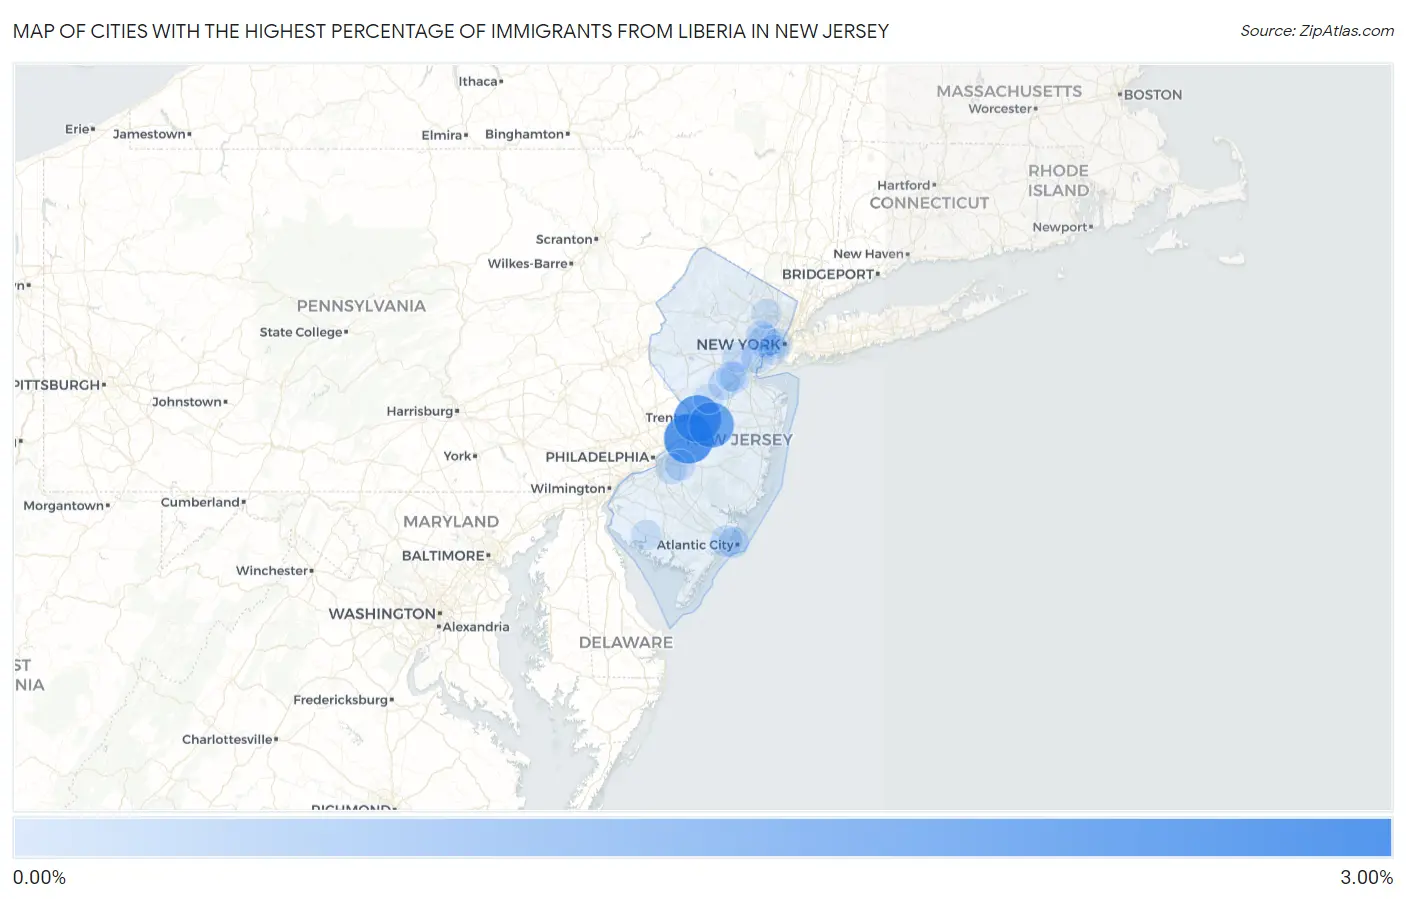
Map of Cities with the Highest Percentage of Immigrants from Liberia in New Jersey
0.00%
3.00%
Cities with the Highest Percentage of Immigrants from Liberia in New Jersey
| City | Liberia | vs State | vs National | |
| 1. | Bargaintown | 2.83% | 0.092%(+2.74)#-1 | 0.030%(+2.80)#0 |
| 2. | Burlington | 2.73% | 0.092%(+2.63)#0 | 0.030%(+2.70)#1 |
| 3. | Trenton | 2.40% | 0.092%(+2.31)#70 | 0.030%(+2.37)#1,932 |
| 4. | Groveville | 2.13% | 0.092%(+2.04)#71 | 0.030%(+2.10)#1,933 |
| 5. | Westville Borough | 0.58% | 0.092%(+0.492)#72 | 0.030%(+0.555)#1,934 |
| 6. | Lindenwold Borough | 0.53% | 0.092%(+0.437)#73 | 0.030%(+0.500)#1,935 |
| 7. | Wrightstown Borough | 0.43% | 0.092%(+0.336)#74 | 0.030%(+0.399)#1,936 |
| 8. | Newark | 0.37% | 0.092%(+0.277)#75 | 0.030%(+0.340)#2,047 |
| 9. | Linden | 0.30% | 0.092%(+0.209)#76 | 0.030%(+0.272)#2,048 |
| 10. | Pleasantville | 0.25% | 0.092%(+0.156)#77 | 0.030%(+0.218)#2,049 |
| 11. | Franklin Park | 0.21% | 0.092%(+0.116)#78 | 0.030%(+0.179)#2,050 |
| 12. | Sayreville Borough | 0.20% | 0.092%(+0.109)#79 | 0.030%(+0.172)#2,051 |
| 13. | Ashland | 0.16% | 0.092%(+0.068)#80 | 0.030%(+0.130)#2,052 |
| 14. | Atlantic City | 0.12% | 0.092%(+0.032)#81 | 0.030%(+0.095)#2,053 |
| 15. | East Orange | 0.12% | 0.092%(+0.028)#82 | 0.030%(+0.091)#2,054 |
| 16. | Marlton | 0.11% | 0.092%(+0.013)#83 | 0.030%(+0.076)#2,055 |
| 17. | New Brunswick | 0.093% | 0.092%(+0.001)#84 | 0.030%(+0.064)#2,056 |
| 18. | Merchantville Borough | 0.079% | 0.092%(-0.013)#85 | 0.030%(+0.049)#2,057 |
| 19. | Bayonne | 0.074% | 0.092%(-0.018)#86 | 0.030%(+0.044)#2,058 |
| 20. | Freehold Borough | 0.056% | 0.092%(-0.036)#87 | 0.030%(+0.026)#2,059 |
| 21. | East Franklin | 0.054% | 0.092%(-0.039)#88 | 0.030%(+0.024)#2,060 |
| 22. | Jersey City | 0.048% | 0.092%(-0.044)#89 | 0.030%(+0.018)#2,061 |
| 23. | Roselle Borough | 0.040% | 0.092%(-0.052)#90 | 0.030%(+0.010)#2,062 |
| 24. | Princeton | 0.036% | 0.092%(-0.056)#91 | 0.030%(+0.006)#2,063 |
| 25. | Bridgeton | 0.030% | 0.092%(-0.063)#92 | 0.030%(+0.000)#2,064 |
| 26. | Plainfield | 0.026% | 0.092%(-0.067)#93 | 0.030%(-0.004)#2,065 |
| 27. | South Plainfield Borough | 0.025% | 0.092%(-0.068)#94 | 0.030%(-0.005)#2,066 |
| 28. | Paterson | 0.016% | 0.092%(-0.076)#95 | 0.030%(-0.013)#2,067 |
Common Questions
What are the Top 10 Cities with the Highest Percentage of Immigrants from Liberia in New Jersey?
Top 10 Cities with the Highest Percentage of Immigrants from Liberia in New Jersey are:
#1
2.73%
#2
2.40%
#3
2.13%
#4
0.37%
#5
0.30%
#6
0.25%
#7
0.21%
#8
0.16%
#9
0.12%
#10
0.12%
What city has the Highest Percentage of Immigrants from Liberia in New Jersey?
Burlington has the Highest Percentage of Immigrants from Liberia in New Jersey with 2.73%.
What is the Percentage of Immigrants from Liberia in the State of New Jersey?
Percentage of Immigrants from Liberia in New Jersey is 0.092%.
What is the Percentage of Immigrants from Liberia in the United States?
Percentage of Immigrants from Liberia in the United States is 0.030%.