Cities with the Highest Percentage of Immigrants from Cuba in New Jersey
RELATED REPORTS & OPTIONS
Cuba
New Jersey
Compare Cities
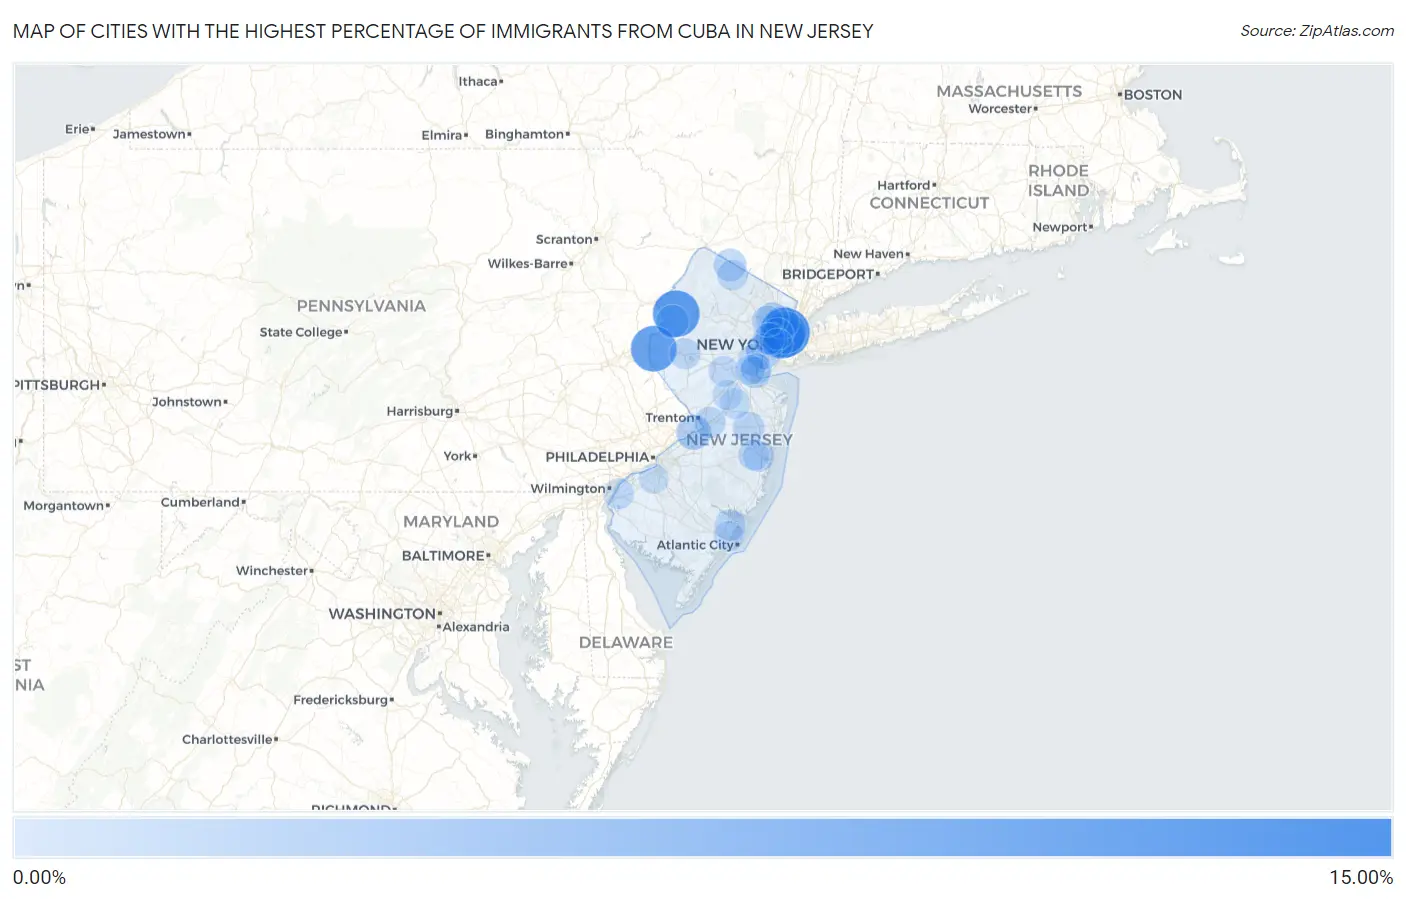
Map of Cities with the Highest Percentage of Immigrants from Cuba in New Jersey
0.00%
15.00%
Cities with the Highest Percentage of Immigrants from Cuba in New Jersey
| City | Cuba | vs State | vs National | |
| 1. | West New York | 10.09% | 0.49%(+9.60)#-1 | 0.40%(+9.69)#0 |
| 2. | Hope | 8.68% | 0.49%(+8.18)#0 | 0.40%(+8.28)#1 |
| 3. | Upper Pohatcong | 8.18% | 0.49%(+7.69)#1 | 0.40%(+7.78)#2 |
| 4. | Union City | 7.50% | 0.49%(+7.01)#2 | 0.40%(+7.10)#3 |
| 5. | Llewellyn Park | 6.90% | 0.49%(+6.41)#3 | 0.40%(+6.50)#4 |
| 6. | Guttenberg | 6.64% | 0.49%(+6.15)#4 | 0.40%(+6.24)#5 |
| 7. | Fairview Borough | 3.17% | 0.49%(+2.68)#5 | 0.40%(+2.77)#6 |
| 8. | East Newark Borough | 3.09% | 0.49%(+2.60)#6 | 0.40%(+2.69)#7 |
| 9. | Elizabeth | 3.04% | 0.49%(+2.55)#7 | 0.40%(+2.64)#8 |
| 10. | Florence | 2.66% | 0.49%(+2.17)#8 | 0.40%(+2.26)#9 |
| 11. | Haledon Borough | 2.24% | 0.49%(+1.74)#9 | 0.40%(+1.84)#10 |
| 12. | Teterboro Borough | 2.20% | 0.49%(+1.71)#10 | 0.40%(+1.80)#11 |
| 13. | Moonachie Borough | 1.94% | 0.49%(+1.45)#11 | 0.40%(+1.54)#12 |
| 14. | Roselle Borough | 1.88% | 0.49%(+1.38)#12 | 0.40%(+1.48)#13 |
| 15. | Cliffside Park Borough | 1.85% | 0.49%(+1.36)#13 | 0.40%(+1.45)#14 |
| 16. | Mountain Lake | 1.84% | 0.49%(+1.35)#14 | 0.40%(+1.44)#15 |
| 17. | Ridgefield Park | 1.84% | 0.49%(+1.35)#15 | 0.40%(+1.44)#16 |
| 18. | Union | 1.78% | 0.49%(+1.29)#16 | 0.40%(+1.38)#17 |
| 19. | Garfield | 1.69% | 0.49%(+1.20)#17 | 0.40%(+1.29)#18 |
| 20. | Vernon Valley | 1.66% | 0.49%(+1.17)#18 | 0.40%(+1.26)#19 |
| 21. | Clearbrook | 1.57% | 0.49%(+1.08)#19 | 0.40%(+1.17)#20 |
| 22. | Kenilworth Borough | 1.56% | 0.49%(+1.07)#20 | 0.40%(+1.16)#21 |
| 23. | Pompton Lakes Borough | 1.53% | 0.49%(+1.04)#21 | 0.40%(+1.13)#22 |
| 24. | Kearny | 1.53% | 0.49%(+1.04)#22 | 0.40%(+1.13)#23 |
| 25. | Pine Beach Borough | 1.46% | 0.49%(+0.966)#23 | 0.40%(+1.06)#24 |
| 26. | Haworth Borough | 1.44% | 0.49%(+0.945)#24 | 0.40%(+1.04)#25 |
| 27. | Chester Borough | 1.42% | 0.49%(+0.928)#25 | 0.40%(+1.02)#26 |
| 28. | Leonia Borough | 1.41% | 0.49%(+0.921)#26 | 0.40%(+1.01)#27 |
| 29. | North Arlington Borough | 1.40% | 0.49%(+0.909)#27 | 0.40%(+1.00)#28 |
| 30. | Dumont Borough | 1.23% | 0.49%(+0.741)#28 | 0.40%(+0.832)#29 |
| 31. | Secaucus | 1.23% | 0.49%(+0.738)#29 | 0.40%(+0.829)#30 |
| 32. | Rahway | 1.23% | 0.49%(+0.736)#30 | 0.40%(+0.827)#31 |
| 33. | Bloomingdale Borough | 1.20% | 0.49%(+0.712)#31 | 0.40%(+0.803)#32 |
| 34. | Vista Center | 1.18% | 0.49%(+0.689)#32 | 0.40%(+0.780)#33 |
| 35. | Watchung Borough | 1.15% | 0.49%(+0.662)#33 | 0.40%(+0.753)#34 |
| 36. | Garwood Borough | 1.14% | 0.49%(+0.654)#34 | 0.40%(+0.745)#35 |
| 37. | Yardville | 1.14% | 0.49%(+0.648)#35 | 0.40%(+0.739)#36 |
| 38. | Upper Saddle River Borough | 1.12% | 0.49%(+0.627)#36 | 0.40%(+0.718)#37 |
| 39. | Harrison | 1.10% | 0.49%(+0.607)#37 | 0.40%(+0.698)#38 |
| 40. | Perth Amboy | 1.09% | 0.49%(+0.599)#38 | 0.40%(+0.690)#150 |
| 41. | Cresskill Borough | 1.08% | 0.49%(+0.585)#39 | 0.40%(+0.676)#151 |
| 42. | Ridgefield Borough | 1.06% | 0.49%(+0.573)#40 | 0.40%(+0.664)#152 |
| 43. | Hasbrouck Heights Borough | 1.06% | 0.49%(+0.568)#41 | 0.40%(+0.659)#153 |
| 44. | Troy Hills | 1.04% | 0.49%(+0.546)#42 | 0.40%(+0.637)#154 |
| 45. | Silver Ridge | 1.03% | 0.49%(+0.544)#43 | 0.40%(+0.635)#155 |
| 46. | Menlo Park Terrace | 1.03% | 0.49%(+0.535)#44 | 0.40%(+0.626)#156 |
| 47. | Annandale | 1.03% | 0.49%(+0.534)#45 | 0.40%(+0.625)#157 |
| 48. | Smithville | 1.01% | 0.49%(+0.516)#46 | 0.40%(+0.607)#158 |
| 49. | Woodcliff Lake Borough | 1.00% | 0.49%(+0.509)#47 | 0.40%(+0.600)#159 |
| 50. | Ho Ho Kus Borough | 0.99% | 0.49%(+0.501)#48 | 0.40%(+0.592)#160 |
| 51. | Rutherford Borough | 0.98% | 0.49%(+0.485)#49 | 0.40%(+0.576)#161 |
| 52. | Holiday City Berkeley | 0.97% | 0.49%(+0.482)#50 | 0.40%(+0.573)#162 |
| 53. | Bergenfield Borough | 0.97% | 0.49%(+0.480)#51 | 0.40%(+0.571)#163 |
| 54. | Little Ferry Borough | 0.97% | 0.49%(+0.476)#52 | 0.40%(+0.567)#164 |
| 55. | Mantoloking Borough | 0.96% | 0.49%(+0.468)#53 | 0.40%(+0.559)#165 |
| 56. | Monmouth Beach Borough | 0.94% | 0.49%(+0.447)#54 | 0.40%(+0.538)#166 |
| 57. | Clifton | 0.93% | 0.49%(+0.436)#55 | 0.40%(+0.526)#167 |
| 58. | Tuckerton Borough | 0.89% | 0.49%(+0.402)#56 | 0.40%(+0.493)#168 |
| 59. | Wanaque Borough | 0.88% | 0.49%(+0.391)#57 | 0.40%(+0.482)#169 |
| 60. | Highland Lakes | 0.88% | 0.49%(+0.389)#58 | 0.40%(+0.480)#170 |
| 61. | Wood Ridge Borough | 0.80% | 0.49%(+0.311)#59 | 0.40%(+0.401)#171 |
| 62. | Pine Brook | 0.80% | 0.49%(+0.306)#60 | 0.40%(+0.397)#172 |
| 63. | Carneys Point | 0.79% | 0.49%(+0.295)#61 | 0.40%(+0.386)#173 |
| 64. | Franklin Center | 0.77% | 0.49%(+0.279)#62 | 0.40%(+0.370)#174 |
| 65. | Rocky Hill Borough | 0.76% | 0.49%(+0.264)#63 | 0.40%(+0.355)#175 |
| 66. | Whippany | 0.75% | 0.49%(+0.263)#64 | 0.40%(+0.354)#176 |
| 67. | Edgewater Borough | 0.75% | 0.49%(+0.259)#65 | 0.40%(+0.350)#177 |
| 68. | Concordia | 0.74% | 0.49%(+0.247)#66 | 0.40%(+0.338)#178 |
| 69. | Hopatcong Borough | 0.73% | 0.49%(+0.237)#67 | 0.40%(+0.328)#179 |
| 70. | River Edge Borough | 0.72% | 0.49%(+0.232)#68 | 0.40%(+0.323)#180 |
| 71. | Absecon | 0.72% | 0.49%(+0.224)#69 | 0.40%(+0.315)#181 |
| 72. | Newfield Borough | 0.71% | 0.49%(+0.219)#70 | 0.40%(+0.310)#182 |
| 73. | Parsippany | 0.70% | 0.49%(+0.210)#71 | 0.40%(+0.301)#183 |
| 74. | Carteret Borough | 0.70% | 0.49%(+0.208)#72 | 0.40%(+0.299)#184 |
| 75. | Macopin | 0.68% | 0.49%(+0.186)#73 | 0.40%(+0.277)#185 |
| 76. | Andover Borough | 0.67% | 0.49%(+0.178)#74 | 0.40%(+0.269)#186 |
| 77. | Sewaren | 0.67% | 0.49%(+0.177)#75 | 0.40%(+0.268)#187 |
| 78. | Ledgewood | 0.67% | 0.49%(+0.174)#76 | 0.40%(+0.265)#188 |
| 79. | Ramsey Borough | 0.66% | 0.49%(+0.174)#77 | 0.40%(+0.265)#189 |
| 80. | Fanwood Borough | 0.66% | 0.49%(+0.169)#78 | 0.40%(+0.260)#190 |
| 81. | Closter Borough | 0.64% | 0.49%(+0.152)#79 | 0.40%(+0.243)#191 |
| 82. | Morris Plains Borough | 0.64% | 0.49%(+0.148)#80 | 0.40%(+0.239)#192 |
| 83. | Elmwood Park Borough | 0.58% | 0.49%(+0.092)#81 | 0.40%(+0.183)#193 |
| 84. | Tenafly Borough | 0.58% | 0.49%(+0.090)#82 | 0.40%(+0.181)#194 |
| 85. | Jersey City | 0.58% | 0.49%(+0.089)#83 | 0.40%(+0.180)#195 |
| 86. | Mount Arlington Borough | 0.58% | 0.49%(+0.089)#84 | 0.40%(+0.180)#196 |
| 87. | Lincoln Park Borough | 0.58% | 0.49%(+0.088)#85 | 0.40%(+0.179)#197 |
| 88. | Cranford | 0.58% | 0.49%(+0.087)#86 | 0.40%(+0.178)#198 |
| 89. | Fort Lee Borough | 0.57% | 0.49%(+0.079)#87 | 0.40%(+0.170)#199 |
| 90. | Dayton | 0.56% | 0.49%(+0.071)#88 | 0.40%(+0.162)#200 |
| 91. | Jamesburg Borough | 0.55% | 0.49%(+0.062)#89 | 0.40%(+0.153)#201 |
| 92. | Oakland Borough | 0.55% | 0.49%(+0.058)#90 | 0.40%(+0.149)#202 |
| 93. | Keasbey | 0.55% | 0.49%(+0.055)#91 | 0.40%(+0.146)#203 |
| 94. | Fords | 0.54% | 0.49%(+0.046)#92 | 0.40%(+0.137)#204 |
| 95. | Oak Valley | 0.53% | 0.49%(+0.038)#93 | 0.40%(+0.129)#205 |
| 96. | Belmar Borough | 0.53% | 0.49%(+0.036)#94 | 0.40%(+0.127)#206 |
| 97. | Midland Park Borough | 0.53% | 0.49%(+0.036)#95 | 0.40%(+0.127)#207 |
| 98. | Tinton Falls Borough | 0.52% | 0.49%(+0.030)#96 | 0.40%(+0.121)#208 |
| 99. | Franklin Lakes Borough | 0.52% | 0.49%(+0.027)#97 | 0.40%(+0.118)#209 |
| 100. | Keyport Borough | 0.51% | 0.49%(+0.024)#98 | 0.40%(+0.114)#210 |
Common Questions
What are the Top 10 Cities with the Highest Percentage of Immigrants from Cuba in New Jersey?
Top 10 Cities with the Highest Percentage of Immigrants from Cuba in New Jersey are:
#1
10.09%
#2
8.68%
#3
8.18%
#4
7.50%
#5
6.64%
#6
3.04%
#7
2.66%
#8
1.84%
#9
1.84%
#10
1.69%
What city has the Highest Percentage of Immigrants from Cuba in New Jersey?
West New York has the Highest Percentage of Immigrants from Cuba in New Jersey with 10.09%.
What is the Percentage of Immigrants from Cuba in the State of New Jersey?
Percentage of Immigrants from Cuba in New Jersey is 0.49%.
What is the Percentage of Immigrants from Cuba in the United States?
Percentage of Immigrants from Cuba in the United States is 0.40%.