Cities with the Highest Percentage of British Population in New Jersey
RELATED REPORTS & OPTIONS
British
New Jersey
Compare Cities
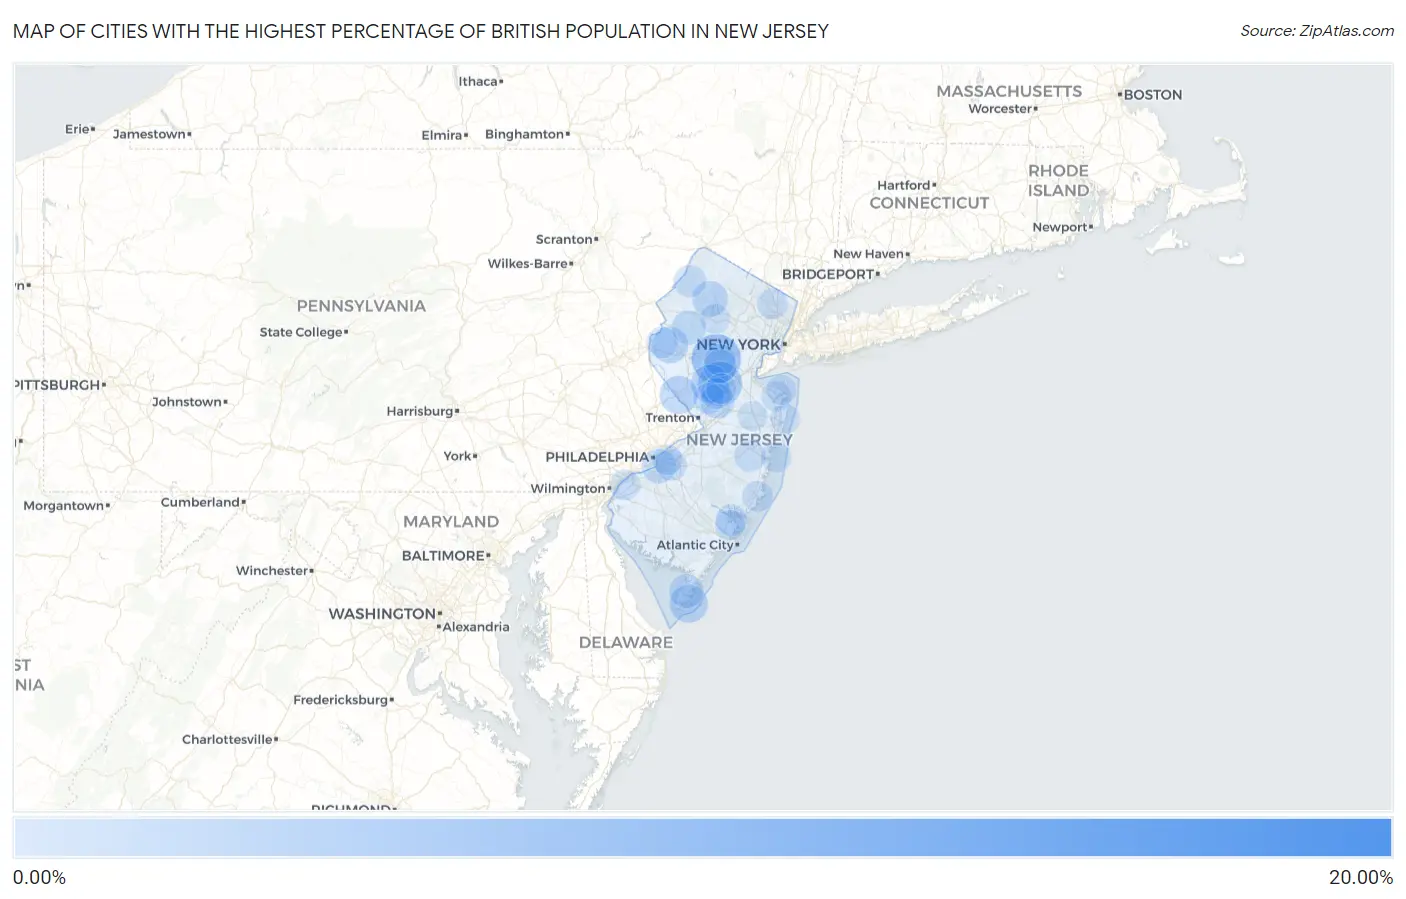
Map of Cities with the Highest Percentage of British Population in New Jersey
0.00%
20.00%
Cities with the Highest Percentage of British Population in New Jersey
| City | British | vs State | vs National | |
| 1. | Green | 19.08% | 0.31%(+18.8)#1 | 0.53%(+18.6)#43 |
| 2. | Macopin | 10.07% | 0.31%(+9.77)#2 | 0.53%(+9.54)#124 |
| 3. | Shiloh Borough | 7.54% | 0.31%(+7.23)#3 | 0.53%(+7.01)#190 |
| 4. | Green Knoll | 7.23% | 0.31%(+6.93)#4 | 0.53%(+6.70)#203 |
| 5. | Pleasant Plains | 5.52% | 0.31%(+5.22)#5 | 0.53%(+4.99)#304 |
| 6. | Lower Berkshire Valley | 5.52% | 0.31%(+5.21)#6 | 0.53%(+4.99)#305 |
| 7. | Tuckerton Borough | 5.14% | 0.31%(+4.83)#7 | 0.53%(+4.61)#333 |
| 8. | Mendham Borough | 4.65% | 0.31%(+4.34)#8 | 0.53%(+4.12)#386 |
| 9. | Harvey Cedars Borough | 4.38% | 0.31%(+4.08)#9 | 0.53%(+3.85)#424 |
| 10. | Delmont | 3.59% | 0.31%(+3.28)#10 | 0.53%(+3.06)#576 |
| 11. | Diamond Beach | 3.54% | 0.31%(+3.23)#11 | 0.53%(+3.01)#589 |
| 12. | Harlingen | 3.50% | 0.31%(+3.19)#12 | 0.53%(+2.97)#601 |
| 13. | Lambertville | 3.49% | 0.31%(+3.18)#13 | 0.53%(+2.96)#603 |
| 14. | Little Silver Borough | 3.26% | 0.31%(+2.95)#14 | 0.53%(+2.73)#669 |
| 15. | Brookside | 3.15% | 0.31%(+2.84)#15 | 0.53%(+2.62)#704 |
| 16. | Asbury | 2.96% | 0.31%(+2.65)#16 | 0.53%(+2.43)#773 |
| 17. | Lake Mohawk | 2.74% | 0.31%(+2.44)#17 | 0.53%(+2.21)#866 |
| 18. | Plainsboro Center | 2.28% | 0.31%(+1.97)#18 | 0.53%(+1.75)#1,161 |
| 19. | Gloucester City | 2.24% | 0.31%(+1.93)#19 | 0.53%(+1.71)#1,192 |
| 20. | Beattystown | 2.16% | 0.31%(+1.86)#20 | 0.53%(+1.63)#1,250 |
| 21. | Whitesboro | 2.16% | 0.31%(+1.86)#21 | 0.53%(+1.63)#1,251 |
| 22. | Westville Borough | 2.10% | 0.31%(+1.80)#22 | 0.53%(+1.57)#1,302 |
| 23. | Oceanville | 2.06% | 0.31%(+1.75)#23 | 0.53%(+1.53)#1,358 |
| 24. | Roseland Borough | 2.04% | 0.31%(+1.74)#24 | 0.53%(+1.51)#1,383 |
| 25. | Three Bridges | 1.93% | 0.31%(+1.63)#25 | 0.53%(+1.40)#1,505 |
| 26. | Finderne | 1.89% | 0.31%(+1.58)#26 | 0.53%(+1.36)#1,548 |
| 27. | Bedminster | 1.80% | 0.31%(+1.50)#27 | 0.53%(+1.27)#1,670 |
| 28. | Pleasantdale | 1.79% | 0.31%(+1.48)#28 | 0.53%(+1.26)#1,691 |
| 29. | Lake Hopatcong | 1.75% | 0.31%(+1.44)#29 | 0.53%(+1.22)#1,742 |
| 30. | Peapack And Gladstone Borough | 1.72% | 0.31%(+1.41)#30 | 0.53%(+1.19)#1,796 |
| 31. | Chester Borough | 1.62% | 0.31%(+1.32)#31 | 0.53%(+1.09)#1,969 |
| 32. | Millington | 1.60% | 0.31%(+1.29)#32 | 0.53%(+1.07)#2,004 |
| 33. | Hopewell Borough | 1.59% | 0.31%(+1.28)#33 | 0.53%(+1.06)#2,019 |
| 34. | Crandon Lakes | 1.58% | 0.31%(+1.27)#34 | 0.53%(+1.05)#2,038 |
| 35. | Cranford | 1.56% | 0.31%(+1.26)#35 | 0.53%(+1.03)#2,074 |
| 36. | Riverton Borough | 1.56% | 0.31%(+1.25)#36 | 0.53%(+1.03)#2,092 |
| 37. | Highlands Borough | 1.53% | 0.31%(+1.22)#37 | 0.53%(+0.998)#2,166 |
| 38. | South Seaville | 1.49% | 0.31%(+1.19)#38 | 0.53%(+0.965)#2,239 |
| 39. | Jamesburg Borough | 1.47% | 0.31%(+1.16)#39 | 0.53%(+0.940)#2,289 |
| 40. | Woodbury Heights Borough | 1.46% | 0.31%(+1.15)#40 | 0.53%(+0.926)#2,324 |
| 41. | Alpine Borough | 1.45% | 0.31%(+1.14)#41 | 0.53%(+0.919)#2,338 |
| 42. | Riverdale Borough | 1.45% | 0.31%(+1.14)#42 | 0.53%(+0.916)#2,350 |
| 43. | Clearbrook | 1.38% | 0.31%(+1.08)#43 | 0.53%(+0.853)#2,528 |
| 44. | Medford Lakes Borough | 1.36% | 0.31%(+1.05)#44 | 0.53%(+0.831)#2,587 |
| 45. | Dunellen Borough | 1.36% | 0.31%(+1.05)#45 | 0.53%(+0.826)#2,602 |
| 46. | Port Republic | 1.33% | 0.31%(+1.02)#46 | 0.53%(+0.797)#2,674 |
| 47. | Martinsville | 1.30% | 0.31%(+0.995)#47 | 0.53%(+0.772)#2,742 |
| 48. | Cedar Knolls | 1.29% | 0.31%(+0.985)#48 | 0.53%(+0.762)#2,772 |
| 49. | Upper Saddle River Borough | 1.28% | 0.31%(+0.969)#49 | 0.53%(+0.745)#2,821 |
| 50. | Crosswicks | 1.27% | 0.31%(+0.965)#50 | 0.53%(+0.741)#2,827 |
| 51. | New Village | 1.27% | 0.31%(+0.960)#51 | 0.53%(+0.736)#2,844 |
| 52. | Atlantic Highlands Borough | 1.25% | 0.31%(+0.941)#52 | 0.53%(+0.718)#2,898 |
| 53. | Hightstown Borough | 1.24% | 0.31%(+0.939)#53 | 0.53%(+0.715)#2,909 |
| 54. | Westwood Borough | 1.24% | 0.31%(+0.930)#54 | 0.53%(+0.707)#2,936 |
| 55. | Princeton | 1.23% | 0.31%(+0.929)#55 | 0.53%(+0.705)#2,942 |
| 56. | Pine Ridge At Crestwood | 1.23% | 0.31%(+0.928)#56 | 0.53%(+0.704)#2,946 |
| 57. | The College Of New Jersey | 1.23% | 0.31%(+0.927)#57 | 0.53%(+0.703)#2,952 |
| 58. | Barclay | 1.20% | 0.31%(+0.893)#58 | 0.53%(+0.669)#3,065 |
| 59. | Ridgewood | 1.19% | 0.31%(+0.884)#59 | 0.53%(+0.661)#3,100 |
| 60. | Glen Gardner Borough | 1.18% | 0.31%(+0.874)#60 | 0.53%(+0.650)#3,126 |
| 61. | Kingston | 1.16% | 0.31%(+0.858)#61 | 0.53%(+0.634)#3,182 |
| 62. | Manahawkin | 1.14% | 0.31%(+0.832)#62 | 0.53%(+0.608)#3,286 |
| 63. | Rocky Hill Borough | 1.13% | 0.31%(+0.827)#63 | 0.53%(+0.604)#3,300 |
| 64. | Pompton Plains | 1.12% | 0.31%(+0.809)#64 | 0.53%(+0.585)#3,376 |
| 65. | Montvale Borough | 1.11% | 0.31%(+0.799)#65 | 0.53%(+0.576)#3,415 |
| 66. | Mountainside Borough | 1.10% | 0.31%(+0.795)#66 | 0.53%(+0.572)#3,436 |
| 67. | Dennisville | 1.09% | 0.31%(+0.786)#67 | 0.53%(+0.562)#3,474 |
| 68. | Pedricktown | 1.09% | 0.31%(+0.784)#68 | 0.53%(+0.560)#3,484 |
| 69. | Liberty Corner | 1.08% | 0.31%(+0.774)#69 | 0.53%(+0.550)#3,514 |
| 70. | Roosevelt Borough | 1.06% | 0.31%(+0.755)#70 | 0.53%(+0.531)#3,620 |
| 71. | Rumson Borough | 1.06% | 0.31%(+0.751)#71 | 0.53%(+0.527)#3,639 |
| 72. | Stockton Borough | 1.05% | 0.31%(+0.747)#72 | 0.53%(+0.523)#3,656 |
| 73. | Milford Borough | 1.05% | 0.31%(+0.739)#73 | 0.53%(+0.515)#3,697 |
| 74. | Port Morris | 1.04% | 0.31%(+0.739)#74 | 0.53%(+0.515)#3,698 |
| 75. | Mountain Lakes Borough | 1.04% | 0.31%(+0.739)#75 | 0.53%(+0.515)#3,699 |
| 76. | Ringwood Borough | 1.03% | 0.31%(+0.729)#76 | 0.53%(+0.505)#3,744 |
| 77. | Tinton Falls Borough | 1.02% | 0.31%(+0.716)#77 | 0.53%(+0.492)#3,822 |
| 78. | Kendall Park | 0.98% | 0.31%(+0.673)#78 | 0.53%(+0.449)#4,018 |
| 79. | Marmora | 0.98% | 0.31%(+0.669)#79 | 0.53%(+0.446)#4,037 |
| 80. | Far Hills Borough | 0.96% | 0.31%(+0.649)#80 | 0.53%(+0.425)#4,136 |
| 81. | Cologne | 0.94% | 0.31%(+0.631)#81 | 0.53%(+0.408)#4,224 |
| 82. | Wildwood Crest Borough | 0.93% | 0.31%(+0.628)#82 | 0.53%(+0.404)#4,242 |
| 83. | Point Pleasant Beach Borough | 0.92% | 0.31%(+0.613)#83 | 0.53%(+0.390)#4,323 |
| 84. | Hillsdale Borough | 0.92% | 0.31%(+0.612)#84 | 0.53%(+0.389)#4,330 |
| 85. | Fairview | 0.90% | 0.31%(+0.591)#85 | 0.53%(+0.368)#4,445 |
| 86. | Ocean Grove | 0.89% | 0.31%(+0.589)#86 | 0.53%(+0.365)#4,461 |
| 87. | Golden Triangle | 0.89% | 0.31%(+0.581)#87 | 0.53%(+0.357)#4,509 |
| 88. | Red Bank Borough | 0.89% | 0.31%(+0.580)#88 | 0.53%(+0.356)#4,512 |
| 89. | Hamburg Borough | 0.89% | 0.31%(+0.580)#89 | 0.53%(+0.356)#4,515 |
| 90. | Dover Beaches South | 0.88% | 0.31%(+0.576)#90 | 0.53%(+0.352)#4,542 |
| 91. | Smithville | 0.88% | 0.31%(+0.570)#91 | 0.53%(+0.346)#4,596 |
| 92. | Pitman Borough | 0.87% | 0.31%(+0.568)#92 | 0.53%(+0.345)#4,602 |
| 93. | Franklin Borough | 0.87% | 0.31%(+0.566)#93 | 0.53%(+0.342)#4,625 |
| 94. | Navesink | 0.87% | 0.31%(+0.562)#94 | 0.53%(+0.339)#4,644 |
| 95. | West Freehold | 0.87% | 0.31%(+0.559)#95 | 0.53%(+0.335)#4,658 |
| 96. | Lebanon Borough | 0.86% | 0.31%(+0.552)#96 | 0.53%(+0.329)#4,705 |
| 97. | Kenvil | 0.86% | 0.31%(+0.550)#97 | 0.53%(+0.326)#4,725 |
| 98. | Haddon Heights Borough | 0.86% | 0.31%(+0.549)#98 | 0.53%(+0.325)#4,729 |
| 99. | Beach Haven Borough | 0.85% | 0.31%(+0.542)#99 | 0.53%(+0.318)#4,771 |
| 100. | Hampton Borough | 0.85% | 0.31%(+0.540)#100 | 0.53%(+0.316)#4,785 |
Common Questions
What are the Top 10 Cities with the Highest Percentage of British Population in New Jersey?
Top 10 Cities with the Highest Percentage of British Population in New Jersey are:
#1
7.23%
#2
5.52%
#3
3.54%
#4
3.50%
#5
3.49%
#6
2.96%
#7
2.74%
#8
2.28%
#9
2.24%
#10
2.16%
What city has the Highest Percentage of British Population in New Jersey?
Green Knoll has the Highest Percentage of British Population in New Jersey with 7.23%.
What is the Percentage of British Population in the State of New Jersey?
Percentage of British Population in New Jersey is 0.31%.
What is the Percentage of British Population in the United States?
Percentage of British Population in the United States is 0.53%.