Cities with the Largest Hungarian Community in New Jersey
RELATED REPORTS & OPTIONS
Hungarian
New Jersey
Compare Cities
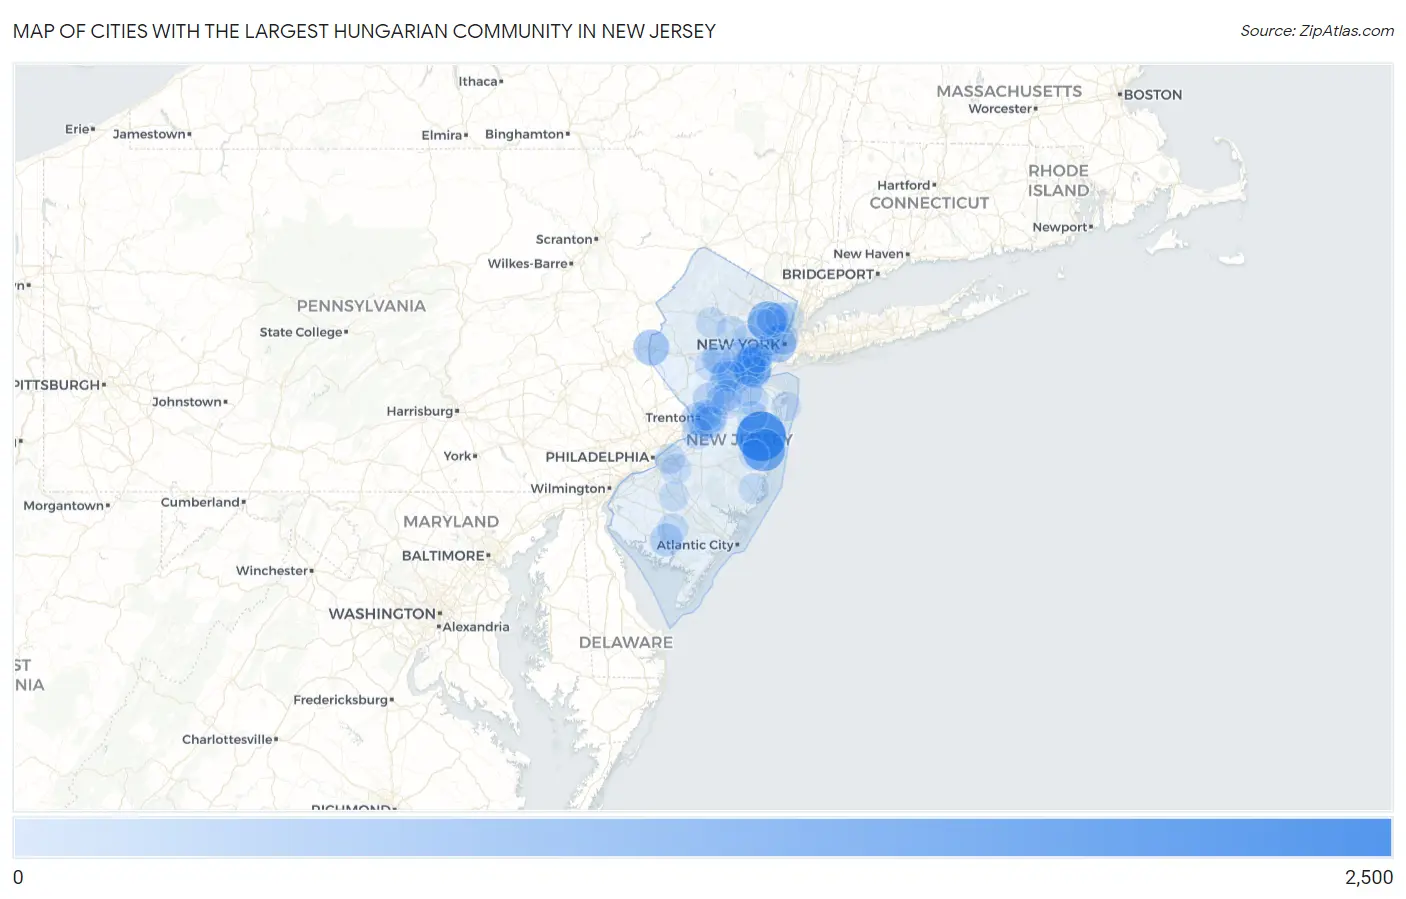
Map of Cities with the Largest Hungarian Community in New Jersey
0
2,500
Cities with the Largest Hungarian Community in New Jersey
| City | Hungarian | vs State | vs National | |
| 1. | Lakewood | 2,037 | 87,257(2.33%)#1 | 1,294,135(0.16%)#32 |
| 2. | Toms River | 1,345 | 87,257(1.54%)#2 | 1,294,135(0.10%)#61 |
| 3. | Clifton | 1,066 | 87,257(1.22%)#3 | 1,294,135(0.08%)#89 |
| 4. | Woodbridge | 939 | 87,257(1.08%)#4 | 1,294,135(0.07%)#110 |
| 5. | Jersey City | 846 | 87,257(0.97%)#5 | 1,294,135(0.07%)#127 |
| 6. | Milltown Borough | 838 | 87,257(0.96%)#6 | 1,294,135(0.06%)#129 |
| 7. | Phillipsburg | 682 | 87,257(0.78%)#7 | 1,294,135(0.05%)#166 |
| 8. | South River Borough | 579 | 87,257(0.66%)#8 | 1,294,135(0.04%)#220 |
| 9. | Sayreville Borough | 499 | 87,257(0.57%)#9 | 1,294,135(0.04%)#276 |
| 10. | Iselin | 466 | 87,257(0.53%)#10 | 1,294,135(0.04%)#295 |
| 11. | Millville | 411 | 87,257(0.47%)#11 | 1,294,135(0.03%)#356 |
| 12. | White Horse | 404 | 87,257(0.46%)#12 | 1,294,135(0.03%)#366 |
| 13. | Trenton | 400 | 87,257(0.46%)#13 | 1,294,135(0.03%)#372 |
| 14. | Rahway | 376 | 87,257(0.43%)#14 | 1,294,135(0.03%)#408 |
| 15. | Carteret Borough | 373 | 87,257(0.43%)#15 | 1,294,135(0.03%)#413 |
| 16. | Highland Park Borough | 373 | 87,257(0.43%)#16 | 1,294,135(0.03%)#414 |
| 17. | New Brunswick | 356 | 87,257(0.41%)#17 | 1,294,135(0.03%)#449 |
| 18. | Hoboken | 339 | 87,257(0.39%)#18 | 1,294,135(0.03%)#473 |
| 19. | Garfield | 339 | 87,257(0.39%)#19 | 1,294,135(0.03%)#474 |
| 20. | Fords | 339 | 87,257(0.39%)#20 | 1,294,135(0.03%)#476 |
| 21. | Colonia | 337 | 87,257(0.39%)#21 | 1,294,135(0.03%)#479 |
| 22. | Hamilton Square | 335 | 87,257(0.38%)#22 | 1,294,135(0.03%)#485 |
| 23. | Princeton | 328 | 87,257(0.38%)#23 | 1,294,135(0.03%)#496 |
| 24. | Yardville | 322 | 87,257(0.37%)#24 | 1,294,135(0.02%)#517 |
| 25. | Somerset | 318 | 87,257(0.36%)#25 | 1,294,135(0.02%)#527 |
| 26. | Ramsey Borough | 317 | 87,257(0.36%)#26 | 1,294,135(0.02%)#531 |
| 27. | Perth Amboy | 307 | 87,257(0.35%)#27 | 1,294,135(0.02%)#554 |
| 28. | Preakness | 293 | 87,257(0.34%)#28 | 1,294,135(0.02%)#589 |
| 29. | Westwood Borough | 293 | 87,257(0.34%)#29 | 1,294,135(0.02%)#590 |
| 30. | Robertsville | 288 | 87,257(0.33%)#30 | 1,294,135(0.02%)#602 |
| 31. | Lincoln Park Borough | 287 | 87,257(0.33%)#31 | 1,294,135(0.02%)#604 |
| 32. | Martinsville | 277 | 87,257(0.32%)#32 | 1,294,135(0.02%)#632 |
| 33. | Point Pleasant Borough | 274 | 87,257(0.31%)#33 | 1,294,135(0.02%)#645 |
| 34. | Mercerville | 267 | 87,257(0.31%)#34 | 1,294,135(0.02%)#667 |
| 35. | Metuchen Borough | 264 | 87,257(0.30%)#35 | 1,294,135(0.02%)#678 |
| 36. | Wanaque Borough | 264 | 87,257(0.30%)#36 | 1,294,135(0.02%)#679 |
| 37. | Paramus Borough | 262 | 87,257(0.30%)#37 | 1,294,135(0.02%)#689 |
| 38. | Alpha Borough | 257 | 87,257(0.29%)#38 | 1,294,135(0.02%)#707 |
| 39. | Englewood | 255 | 87,257(0.29%)#39 | 1,294,135(0.02%)#712 |
| 40. | Matawan Borough | 253 | 87,257(0.29%)#40 | 1,294,135(0.02%)#720 |
| 41. | Vineland | 252 | 87,257(0.29%)#41 | 1,294,135(0.02%)#722 |
| 42. | Spotswood Borough | 250 | 87,257(0.29%)#42 | 1,294,135(0.02%)#733 |
| 43. | Roebling | 249 | 87,257(0.29%)#43 | 1,294,135(0.02%)#740 |
| 44. | Hillsborough | 245 | 87,257(0.28%)#44 | 1,294,135(0.02%)#755 |
| 45. | South Plainfield Borough | 239 | 87,257(0.27%)#45 | 1,294,135(0.02%)#772 |
| 46. | Fair Lawn Borough | 237 | 87,257(0.27%)#46 | 1,294,135(0.02%)#780 |
| 47. | Montvale Borough | 234 | 87,257(0.27%)#47 | 1,294,135(0.02%)#791 |
| 48. | Westfield | 230 | 87,257(0.26%)#48 | 1,294,135(0.02%)#807 |
| 49. | West Freehold | 227 | 87,257(0.26%)#49 | 1,294,135(0.02%)#825 |
| 50. | Bradley Gardens | 222 | 87,257(0.25%)#50 | 1,294,135(0.02%)#851 |
| 51. | Manville Borough | 218 | 87,257(0.25%)#51 | 1,294,135(0.02%)#870 |
| 52. | Rumson Borough | 216 | 87,257(0.25%)#52 | 1,294,135(0.02%)#876 |
| 53. | Elmwood Park Borough | 215 | 87,257(0.25%)#53 | 1,294,135(0.02%)#881 |
| 54. | Totowa Borough | 213 | 87,257(0.24%)#54 | 1,294,135(0.02%)#896 |
| 55. | Kendall Park | 213 | 87,257(0.24%)#55 | 1,294,135(0.02%)#897 |
| 56. | Middlebush | 208 | 87,257(0.24%)#56 | 1,294,135(0.02%)#918 |
| 57. | Hightstown Borough | 204 | 87,257(0.23%)#57 | 1,294,135(0.02%)#935 |
| 58. | Ocean Acres | 203 | 87,257(0.23%)#58 | 1,294,135(0.02%)#938 |
| 59. | East Franklin | 203 | 87,257(0.23%)#59 | 1,294,135(0.02%)#940 |
| 60. | Dayton | 203 | 87,257(0.23%)#60 | 1,294,135(0.02%)#941 |
| 61. | Mountain Lakes Borough | 202 | 87,257(0.23%)#61 | 1,294,135(0.02%)#953 |
| 62. | Germania | 201 | 87,257(0.23%)#62 | 1,294,135(0.02%)#956 |
| 63. | Freehold Borough | 200 | 87,257(0.23%)#63 | 1,294,135(0.02%)#959 |
| 64. | Succasunna | 199 | 87,257(0.23%)#64 | 1,294,135(0.02%)#967 |
| 65. | Old Bridge | 197 | 87,257(0.23%)#65 | 1,294,135(0.02%)#975 |
| 66. | Cherry Hill Mall | 197 | 87,257(0.23%)#66 | 1,294,135(0.02%)#976 |
| 67. | Short Hills | 195 | 87,257(0.22%)#67 | 1,294,135(0.02%)#987 |
| 68. | Pompton Lakes Borough | 195 | 87,257(0.22%)#68 | 1,294,135(0.02%)#989 |
| 69. | Morristown | 193 | 87,257(0.22%)#69 | 1,294,135(0.01%)#1,000 |
| 70. | Springdale | 193 | 87,257(0.22%)#70 | 1,294,135(0.01%)#1,001 |
| 71. | Princeton Meadows | 192 | 87,257(0.22%)#71 | 1,294,135(0.01%)#1,008 |
| 72. | Eatontown Borough | 186 | 87,257(0.21%)#72 | 1,294,135(0.01%)#1,042 |
| 73. | Holiday City Berkeley | 185 | 87,257(0.21%)#73 | 1,294,135(0.01%)#1,051 |
| 74. | Fair Haven Borough | 185 | 87,257(0.21%)#74 | 1,294,135(0.01%)#1,054 |
| 75. | Passaic | 180 | 87,257(0.21%)#75 | 1,294,135(0.01%)#1,079 |
| 76. | Hopatcong Borough | 178 | 87,257(0.20%)#76 | 1,294,135(0.01%)#1,091 |
| 77. | Beachwood Borough | 173 | 87,257(0.20%)#77 | 1,294,135(0.01%)#1,129 |
| 78. | Mount Royal | 173 | 87,257(0.20%)#78 | 1,294,135(0.01%)#1,130 |
| 79. | Washington Borough | 172 | 87,257(0.20%)#79 | 1,294,135(0.01%)#1,142 |
| 80. | Hillsdale Borough | 169 | 87,257(0.19%)#80 | 1,294,135(0.01%)#1,167 |
| 81. | Caldwell Borough | 169 | 87,257(0.19%)#81 | 1,294,135(0.01%)#1,168 |
| 82. | Williamstown | 168 | 87,257(0.19%)#82 | 1,294,135(0.01%)#1,176 |
| 83. | Hackensack | 167 | 87,257(0.19%)#83 | 1,294,135(0.01%)#1,181 |
| 84. | Bridgewater Center | 167 | 87,257(0.19%)#84 | 1,294,135(0.01%)#1,187 |
| 85. | Plainfield | 166 | 87,257(0.19%)#85 | 1,294,135(0.01%)#1,188 |
| 86. | Fort Lee Borough | 165 | 87,257(0.19%)#86 | 1,294,135(0.01%)#1,197 |
| 87. | Shrewsbury Borough | 165 | 87,257(0.19%)#87 | 1,294,135(0.01%)#1,201 |
| 88. | Cranbury | 162 | 87,257(0.19%)#88 | 1,294,135(0.01%)#1,228 |
| 89. | Elizabeth | 161 | 87,257(0.18%)#89 | 1,294,135(0.01%)#1,229 |
| 90. | Linden | 160 | 87,257(0.18%)#90 | 1,294,135(0.01%)#1,241 |
| 91. | Middlesex Borough | 158 | 87,257(0.18%)#91 | 1,294,135(0.01%)#1,256 |
| 92. | Long Branch | 153 | 87,257(0.18%)#92 | 1,294,135(0.01%)#1,305 |
| 93. | Haddon Heights Borough | 153 | 87,257(0.18%)#93 | 1,294,135(0.01%)#1,308 |
| 94. | Haddonfield Borough | 151 | 87,257(0.17%)#94 | 1,294,135(0.01%)#1,319 |
| 95. | Bloomingdale Borough | 151 | 87,257(0.17%)#95 | 1,294,135(0.01%)#1,321 |
| 96. | High Bridge Borough | 151 | 87,257(0.17%)#96 | 1,294,135(0.01%)#1,322 |
| 97. | Green Knoll | 150 | 87,257(0.17%)#97 | 1,294,135(0.01%)#1,331 |
| 98. | Franklin Borough | 150 | 87,257(0.17%)#98 | 1,294,135(0.01%)#1,332 |
| 99. | Chatham Borough | 149 | 87,257(0.17%)#99 | 1,294,135(0.01%)#1,335 |
| 100. | Upper Montclair | 147 | 87,257(0.17%)#100 | 1,294,135(0.01%)#1,359 |
Common Questions
What are the Top 10 Cities with the Largest Hungarian Community in New Jersey?
Top 10 Cities with the Largest Hungarian Community in New Jersey are:
#1
2,037
#2
1,345
#3
1,066
#4
939
#5
846
#6
682
#7
466
#8
411
#9
404
#10
400
What city has the Largest Hungarian Community in New Jersey?
Lakewood has the Largest Hungarian Community in New Jersey with 2,037.
What is the Total Hungarian Population in the State of New Jersey?
Total Hungarian Population in New Jersey is 87,257.
What is the Total Hungarian Population in the United States?
Total Hungarian Population in the United States is 1,294,135.