Cities with the Most Immigrants from South Central Asia in New Jersey
RELATED REPORTS & OPTIONS
South Central Asia
New Jersey
Compare Cities
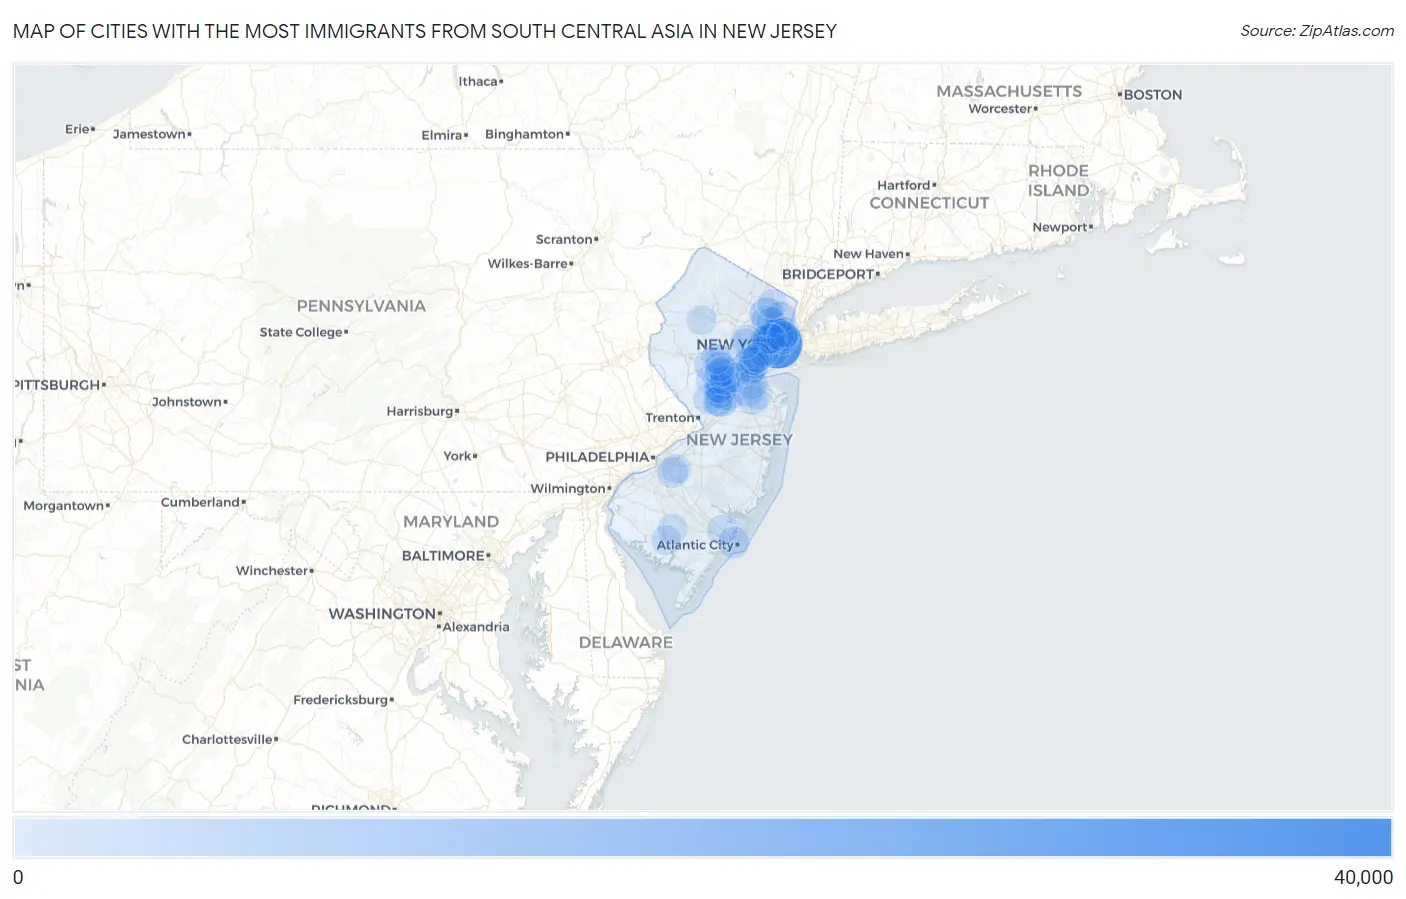
Map of Cities with the Most Immigrants from South Central Asia in New Jersey
0
40,000
Cities with the Most Immigrants from South Central Asia in New Jersey
| City | South Central Asia | vs State | vs National | |
| 1. | Jersey City | 31,347 | 334,880(9.36%)#1 | 4,330,976(0.72%)#8 |
| 2. | Iselin | 7,178 | 334,880(2.14%)#2 | 4,330,976(0.17%)#59 |
| 3. | Parsippany | 5,661 | 334,880(1.69%)#3 | 4,330,976(0.13%)#84 |
| 4. | Princeton Meadows | 5,589 | 334,880(1.67%)#4 | 4,330,976(0.13%)#86 |
| 5. | Paterson | 5,089 | 334,880(1.52%)#5 | 4,330,976(0.12%)#100 |
| 6. | Sayreville Borough | 4,485 | 334,880(1.34%)#6 | 4,330,976(0.10%)#122 |
| 7. | Carteret Borough | 4,025 | 334,880(1.20%)#7 | 4,330,976(0.09%)#142 |
| 8. | Secaucus | 3,818 | 334,880(1.14%)#8 | 4,330,976(0.09%)#155 |
| 9. | Monmouth Junction | 3,239 | 334,880(0.97%)#9 | 4,330,976(0.07%)#192 |
| 10. | Clifton | 3,000 | 334,880(0.90%)#10 | 4,330,976(0.07%)#209 |
| 11. | Franklin Park | 2,943 | 334,880(0.88%)#11 | 4,330,976(0.07%)#216 |
| 12. | Bradley Gardens | 2,668 | 334,880(0.80%)#12 | 4,330,976(0.06%)#238 |
| 13. | Dayton | 2,663 | 334,880(0.80%)#13 | 4,330,976(0.06%)#239 |
| 14. | Newark | 2,604 | 334,880(0.78%)#14 | 4,330,976(0.06%)#242 |
| 15. | Hackensack | 2,466 | 334,880(0.74%)#15 | 4,330,976(0.06%)#255 |
| 16. | Woodbridge | 2,403 | 334,880(0.72%)#16 | 4,330,976(0.06%)#262 |
| 17. | Bayonne | 2,339 | 334,880(0.70%)#17 | 4,330,976(0.05%)#269 |
| 18. | Avenel | 2,282 | 334,880(0.68%)#18 | 4,330,976(0.05%)#281 |
| 19. | Atlantic City | 2,268 | 334,880(0.68%)#19 | 4,330,976(0.05%)#283 |
| 20. | Heathcote | 2,267 | 334,880(0.68%)#20 | 4,330,976(0.05%)#284 |
| 21. | Paramus Borough | 2,238 | 334,880(0.67%)#21 | 4,330,976(0.05%)#286 |
| 22. | Lake Hiawatha | 2,148 | 334,880(0.64%)#22 | 4,330,976(0.05%)#298 |
| 23. | Hoboken | 2,136 | 334,880(0.64%)#23 | 4,330,976(0.05%)#301 |
| 24. | South Plainfield Borough | 2,107 | 334,880(0.63%)#24 | 4,330,976(0.05%)#306 |
| 25. | Somerset | 2,061 | 334,880(0.62%)#25 | 4,330,976(0.05%)#314 |
| 26. | Harrison | 1,987 | 334,880(0.59%)#26 | 4,330,976(0.05%)#326 |
| 27. | Hillsborough | 1,890 | 334,880(0.56%)#27 | 4,330,976(0.04%)#349 |
| 28. | Belle Mead | 1,740 | 334,880(0.52%)#28 | 4,330,976(0.04%)#380 |
| 29. | Old Bridge | 1,693 | 334,880(0.51%)#29 | 4,330,976(0.04%)#389 |
| 30. | Echelon | 1,648 | 334,880(0.49%)#30 | 4,330,976(0.04%)#400 |
| 31. | Colonia | 1,644 | 334,880(0.49%)#31 | 4,330,976(0.04%)#401 |
| 32. | Fair Lawn Borough | 1,635 | 334,880(0.49%)#32 | 4,330,976(0.04%)#405 |
| 33. | Passaic | 1,502 | 334,880(0.45%)#33 | 4,330,976(0.03%)#438 |
| 34. | Short Hills | 1,470 | 334,880(0.44%)#34 | 4,330,976(0.03%)#444 |
| 35. | Kendall Park | 1,428 | 334,880(0.43%)#35 | 4,330,976(0.03%)#454 |
| 36. | Fort Lee Borough | 1,355 | 334,880(0.40%)#36 | 4,330,976(0.03%)#481 |
| 37. | Troy Hills | 1,339 | 334,880(0.40%)#37 | 4,330,976(0.03%)#485 |
| 38. | Princeton | 1,287 | 334,880(0.38%)#38 | 4,330,976(0.03%)#505 |
| 39. | The Hills | 1,167 | 334,880(0.35%)#39 | 4,330,976(0.03%)#554 |
| 40. | Pomona | 1,126 | 334,880(0.34%)#40 | 4,330,976(0.03%)#588 |
| 41. | Blackwells Mills | 1,119 | 334,880(0.33%)#41 | 4,330,976(0.03%)#591 |
| 42. | Rutherford Borough | 1,092 | 334,880(0.33%)#42 | 4,330,976(0.03%)#607 |
| 43. | Elizabeth | 1,085 | 334,880(0.32%)#43 | 4,330,976(0.03%)#610 |
| 44. | Fords | 1,074 | 334,880(0.32%)#44 | 4,330,976(0.02%)#619 |
| 45. | Madison Park | 1,062 | 334,880(0.32%)#45 | 4,330,976(0.02%)#625 |
| 46. | Monroe Manor | 1,060 | 334,880(0.32%)#46 | 4,330,976(0.02%)#626 |
| 47. | Middlesex Borough | 1,030 | 334,880(0.31%)#47 | 4,330,976(0.02%)#653 |
| 48. | Highland Park Borough | 985 | 334,880(0.29%)#48 | 4,330,976(0.02%)#681 |
| 49. | Elmwood Park Borough | 953 | 334,880(0.28%)#49 | 4,330,976(0.02%)#702 |
| 50. | New Milford Borough | 928 | 334,880(0.28%)#50 | 4,330,976(0.02%)#719 |
| 51. | Metuchen Borough | 906 | 334,880(0.27%)#51 | 4,330,976(0.02%)#738 |
| 52. | Bergenfield Borough | 899 | 334,880(0.27%)#52 | 4,330,976(0.02%)#741 |
| 53. | Forsgate | 839 | 334,880(0.25%)#53 | 4,330,976(0.02%)#784 |
| 54. | Ten Mile Run | 836 | 334,880(0.25%)#54 | 4,330,976(0.02%)#786 |
| 55. | East Rutherford Borough | 831 | 334,880(0.25%)#55 | 4,330,976(0.02%)#792 |
| 56. | Edgewater Borough | 828 | 334,880(0.25%)#56 | 4,330,976(0.02%)#795 |
| 57. | Roselle Park Borough | 826 | 334,880(0.25%)#57 | 4,330,976(0.02%)#799 |
| 58. | West New York | 778 | 334,880(0.23%)#58 | 4,330,976(0.02%)#834 |
| 59. | New Providence Borough | 731 | 334,880(0.22%)#59 | 4,330,976(0.02%)#879 |
| 60. | Martinsville | 731 | 334,880(0.22%)#60 | 4,330,976(0.02%)#880 |
| 61. | Somerville Borough | 713 | 334,880(0.21%)#61 | 4,330,976(0.02%)#895 |
| 62. | Franklin Center | 704 | 334,880(0.21%)#62 | 4,330,976(0.02%)#901 |
| 63. | Lodi Borough | 702 | 334,880(0.21%)#63 | 4,330,976(0.02%)#904 |
| 64. | Rahway | 678 | 334,880(0.20%)#64 | 4,330,976(0.02%)#919 |
| 65. | Plainsboro Center | 677 | 334,880(0.20%)#65 | 4,330,976(0.02%)#921 |
| 66. | Preakness | 665 | 334,880(0.20%)#66 | 4,330,976(0.02%)#935 |
| 67. | Bellmawr Borough | 646 | 334,880(0.19%)#67 | 4,330,976(0.01%)#961 |
| 68. | Pine Brook | 645 | 334,880(0.19%)#68 | 4,330,976(0.01%)#963 |
| 69. | Union City | 637 | 334,880(0.19%)#69 | 4,330,976(0.01%)#971 |
| 70. | Summit | 628 | 334,880(0.19%)#70 | 4,330,976(0.01%)#981 |
| 71. | Robertsville | 613 | 334,880(0.18%)#71 | 4,330,976(0.01%)#1,003 |
| 72. | Ridgewood | 606 | 334,880(0.18%)#72 | 4,330,976(0.01%)#1,008 |
| 73. | New Brunswick | 585 | 334,880(0.17%)#73 | 4,330,976(0.01%)#1,038 |
| 74. | Six Mile Run | 561 | 334,880(0.17%)#74 | 4,330,976(0.01%)#1,065 |
| 75. | Wallington Borough | 524 | 334,880(0.16%)#75 | 4,330,976(0.01%)#1,108 |
| 76. | Menlo Park Terrace | 518 | 334,880(0.15%)#76 | 4,330,976(0.01%)#1,115 |
| 77. | Dumont Borough | 503 | 334,880(0.15%)#77 | 4,330,976(0.01%)#1,140 |
| 78. | Glassboro Borough | 495 | 334,880(0.15%)#78 | 4,330,976(0.01%)#1,149 |
| 79. | Green Knoll | 484 | 334,880(0.14%)#79 | 4,330,976(0.01%)#1,171 |
| 80. | Palisades Park Borough | 476 | 334,880(0.14%)#80 | 4,330,976(0.01%)#1,179 |
| 81. | Vineland | 465 | 334,880(0.14%)#81 | 4,330,976(0.01%)#1,194 |
| 82. | Robbinsville Center | 448 | 334,880(0.13%)#82 | 4,330,976(0.01%)#1,215 |
| 83. | Springdale | 445 | 334,880(0.13%)#83 | 4,330,976(0.01%)#1,219 |
| 84. | Morganville | 439 | 334,880(0.13%)#84 | 4,330,976(0.01%)#1,226 |
| 85. | Weston | 432 | 334,880(0.13%)#85 | 4,330,976(0.01%)#1,241 |
| 86. | Cliffside Park Borough | 431 | 334,880(0.13%)#86 | 4,330,976(0.01%)#1,242 |
| 87. | Maywood Borough | 431 | 334,880(0.13%)#87 | 4,330,976(0.01%)#1,244 |
| 88. | Raritan Borough | 418 | 334,880(0.12%)#88 | 4,330,976(0.01%)#1,264 |
| 89. | Deans | 413 | 334,880(0.12%)#89 | 4,330,976(0.01%)#1,272 |
| 90. | Caldwell Borough | 412 | 334,880(0.12%)#90 | 4,330,976(0.01%)#1,273 |
| 91. | Linden | 403 | 334,880(0.12%)#91 | 4,330,976(0.01%)#1,284 |
| 92. | Millville | 400 | 334,880(0.12%)#92 | 4,330,976(0.01%)#1,296 |
| 93. | Finderne | 394 | 334,880(0.12%)#93 | 4,330,976(0.01%)#1,310 |
| 94. | Whippany | 393 | 334,880(0.12%)#94 | 4,330,976(0.01%)#1,314 |
| 95. | River Edge Borough | 391 | 334,880(0.12%)#95 | 4,330,976(0.01%)#1,318 |
| 96. | Waldwick Borough | 388 | 334,880(0.12%)#96 | 4,330,976(0.01%)#1,325 |
| 97. | Budd Lake | 386 | 334,880(0.12%)#97 | 4,330,976(0.01%)#1,332 |
| 98. | Wood Ridge Borough | 359 | 334,880(0.11%)#98 | 4,330,976(0.01%)#1,401 |
| 99. | Kearny | 358 | 334,880(0.11%)#99 | 4,330,976(0.01%)#1,402 |
| 100. | Florham Park Borough | 358 | 334,880(0.11%)#100 | 4,330,976(0.01%)#1,404 |
Common Questions
What are the Top 10 Cities with the Most Immigrants from South Central Asia in New Jersey?
Top 10 Cities with the Most Immigrants from South Central Asia in New Jersey are:
#1
31,347
#2
7,178
#3
5,589
#4
5,089
#5
3,818
#6
3,239
#7
3,000
#8
2,943
#9
2,668
#10
2,663
What city has the Most Immigrants from South Central Asia in New Jersey?
Jersey City has the Most Immigrants from South Central Asia in New Jersey with 31,347.
What is the Total Immigrants from South Central Asia in the State of New Jersey?
Total Immigrants from South Central Asia in New Jersey is 334,880.
What is the Total Immigrants from South Central Asia in the United States?
Total Immigrants from South Central Asia in the United States is 4,330,976.