Cities with the Most Immigrants from Western Europe in New Jersey
RELATED REPORTS & OPTIONS
Western Europe
New Jersey
Compare Cities
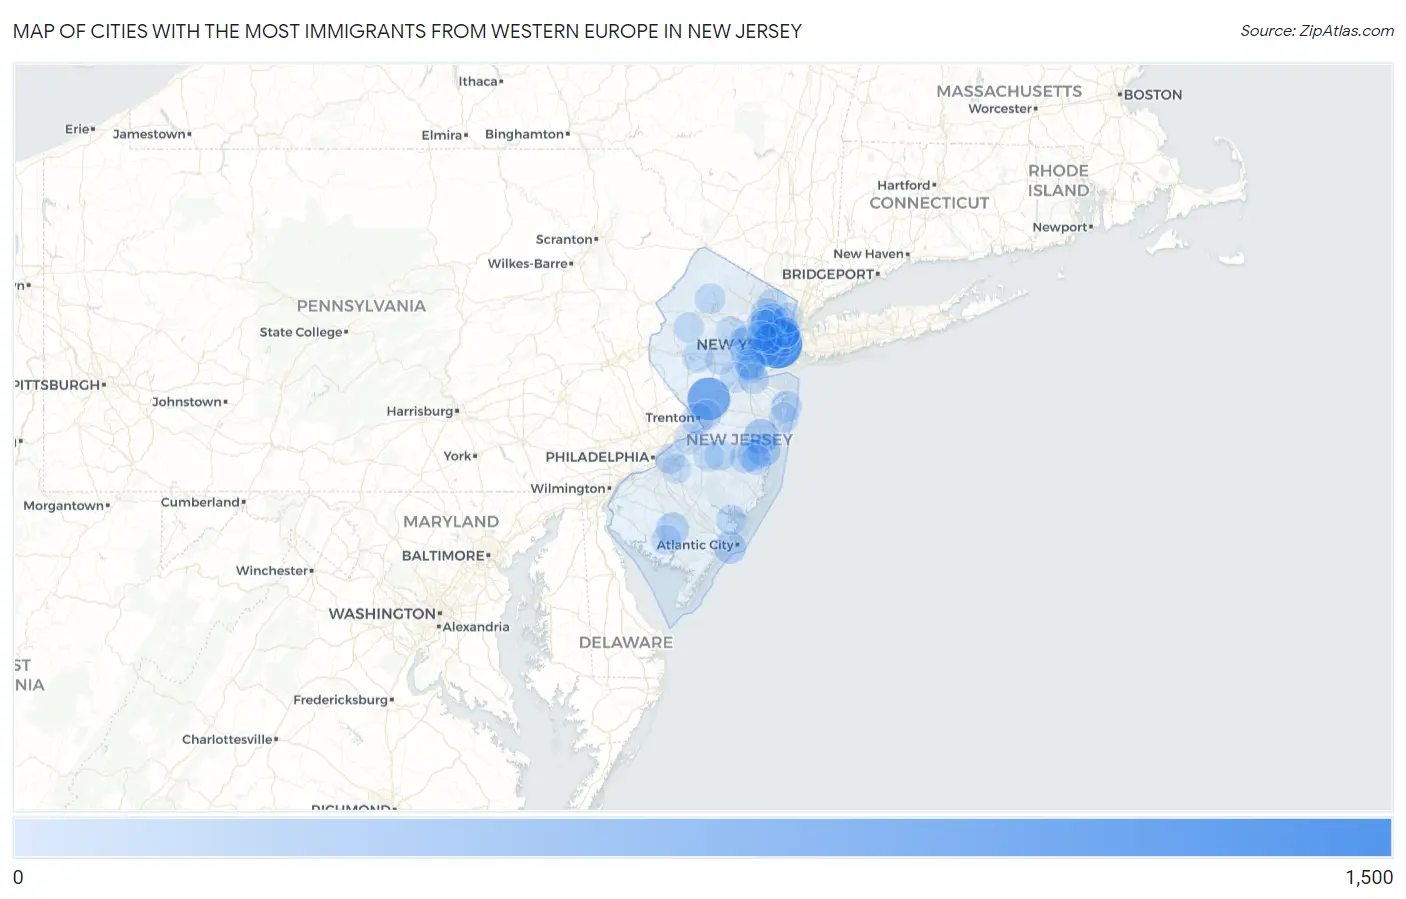
Map of Cities with the Most Immigrants from Western Europe in New Jersey
0
1,500
Cities with the Most Immigrants from Western Europe in New Jersey
| City | Western Europe | vs State | vs National | |
| 1. | Jersey City | 1,441 | 31,183(4.62%)#1 | 924,665(0.16%)#42 |
| 2. | Princeton | 935 | 31,183(3.00%)#2 | 924,665(0.10%)#82 |
| 3. | Hoboken | 437 | 31,183(1.40%)#3 | 924,665(0.05%)#233 |
| 4. | Lakewood | 381 | 31,183(1.22%)#4 | 924,665(0.04%)#282 |
| 5. | Paramus Borough | 356 | 31,183(1.14%)#5 | 924,665(0.04%)#307 |
| 6. | Madison Borough | 287 | 31,183(0.92%)#6 | 924,665(0.03%)#425 |
| 7. | Summit | 261 | 31,183(0.84%)#7 | 924,665(0.03%)#471 |
| 8. | Toms River | 259 | 31,183(0.83%)#8 | 924,665(0.03%)#475 |
| 9. | Clifton | 259 | 31,183(0.83%)#9 | 924,665(0.03%)#476 |
| 10. | Fort Lee Borough | 251 | 31,183(0.80%)#10 | 924,665(0.03%)#504 |
| 11. | Vineland | 249 | 31,183(0.80%)#11 | 924,665(0.03%)#509 |
| 12. | Newark | 219 | 31,183(0.70%)#12 | 924,665(0.02%)#593 |
| 13. | Union City | 217 | 31,183(0.70%)#13 | 924,665(0.02%)#603 |
| 14. | Ventnor City | 215 | 31,183(0.69%)#14 | 924,665(0.02%)#613 |
| 15. | Highlands Borough | 206 | 31,183(0.66%)#15 | 924,665(0.02%)#640 |
| 16. | Cliffside Park Borough | 197 | 31,183(0.63%)#16 | 924,665(0.02%)#668 |
| 17. | Holiday City Berkeley | 193 | 31,183(0.62%)#17 | 924,665(0.02%)#691 |
| 18. | Trenton | 167 | 31,183(0.54%)#18 | 924,665(0.02%)#809 |
| 19. | Bayonne | 160 | 31,183(0.51%)#19 | 924,665(0.02%)#850 |
| 20. | Hasbrouck Heights Borough | 155 | 31,183(0.50%)#20 | 924,665(0.02%)#883 |
| 21. | Fair Lawn Borough | 153 | 31,183(0.49%)#21 | 924,665(0.02%)#892 |
| 22. | Pompton Plains | 149 | 31,183(0.48%)#22 | 924,665(0.02%)#924 |
| 23. | Colonia | 147 | 31,183(0.47%)#23 | 924,665(0.02%)#936 |
| 24. | Paterson | 143 | 31,183(0.46%)#24 | 924,665(0.02%)#962 |
| 25. | Ramsey Borough | 141 | 31,183(0.45%)#25 | 924,665(0.02%)#983 |
| 26. | Secaucus | 132 | 31,183(0.42%)#26 | 924,665(0.01%)#1,050 |
| 27. | Westfield | 128 | 31,183(0.41%)#27 | 924,665(0.01%)#1,083 |
| 28. | Ridgewood | 122 | 31,183(0.39%)#28 | 924,665(0.01%)#1,131 |
| 29. | Long Branch | 119 | 31,183(0.38%)#29 | 924,665(0.01%)#1,163 |
| 30. | Garfield | 118 | 31,183(0.38%)#30 | 924,665(0.01%)#1,181 |
| 31. | Hawthorne Borough | 118 | 31,183(0.38%)#31 | 924,665(0.01%)#1,184 |
| 32. | Browns Mills | 118 | 31,183(0.38%)#32 | 924,665(0.01%)#1,187 |
| 33. | Crestwood Village | 110 | 31,183(0.35%)#33 | 924,665(0.01%)#1,275 |
| 34. | Elizabeth | 108 | 31,183(0.35%)#34 | 924,665(0.01%)#1,289 |
| 35. | Bernardsville Borough | 107 | 31,183(0.34%)#35 | 924,665(0.01%)#1,314 |
| 36. | New Providence Borough | 106 | 31,183(0.34%)#36 | 924,665(0.01%)#1,326 |
| 37. | New Milford Borough | 103 | 31,183(0.33%)#37 | 924,665(0.01%)#1,358 |
| 38. | Parsippany | 102 | 31,183(0.33%)#38 | 924,665(0.01%)#1,373 |
| 39. | Glassboro Borough | 98 | 31,183(0.31%)#39 | 924,665(0.01%)#1,425 |
| 40. | Kenilworth Borough | 97 | 31,183(0.31%)#40 | 924,665(0.01%)#1,439 |
| 41. | Collingswood Borough | 95 | 31,183(0.30%)#41 | 924,665(0.01%)#1,457 |
| 42. | Port Republic | 95 | 31,183(0.30%)#42 | 924,665(0.01%)#1,464 |
| 43. | Woodbridge | 94 | 31,183(0.30%)#43 | 924,665(0.01%)#1,474 |
| 44. | Iselin | 91 | 31,183(0.29%)#44 | 924,665(0.01%)#1,512 |
| 45. | White House Station | 91 | 31,183(0.29%)#45 | 924,665(0.01%)#1,516 |
| 46. | New Brunswick | 89 | 31,183(0.29%)#46 | 924,665(0.01%)#1,534 |
| 47. | West New York | 89 | 31,183(0.29%)#47 | 924,665(0.01%)#1,536 |
| 48. | Short Hills | 88 | 31,183(0.28%)#48 | 924,665(0.01%)#1,557 |
| 49. | Lake Mohawk | 88 | 31,183(0.28%)#49 | 924,665(0.01%)#1,561 |
| 50. | Tinton Falls Borough | 87 | 31,183(0.28%)#50 | 924,665(0.01%)#1,570 |
| 51. | Dorothy | 87 | 31,183(0.28%)#51 | 924,665(0.01%)#1,579 |
| 52. | Upper Montclair | 85 | 31,183(0.27%)#52 | 924,665(0.01%)#1,611 |
| 53. | Hillsborough | 83 | 31,183(0.27%)#53 | 924,665(0.01%)#1,642 |
| 54. | Pemberton Heights | 83 | 31,183(0.27%)#54 | 924,665(0.01%)#1,651 |
| 55. | Millville | 81 | 31,183(0.26%)#55 | 924,665(0.01%)#1,681 |
| 56. | Lyons | 81 | 31,183(0.26%)#56 | 924,665(0.01%)#1,690 |
| 57. | Sicklerville | 80 | 31,183(0.26%)#57 | 924,665(0.01%)#1,695 |
| 58. | Morristown | 79 | 31,183(0.25%)#58 | 924,665(0.01%)#1,718 |
| 59. | Midland Park Borough | 79 | 31,183(0.25%)#59 | 924,665(0.01%)#1,726 |
| 60. | Dumont Borough | 78 | 31,183(0.25%)#60 | 924,665(0.01%)#1,744 |
| 61. | Manville Borough | 78 | 31,183(0.25%)#61 | 924,665(0.01%)#1,748 |
| 62. | Ridgefield Park | 77 | 31,183(0.25%)#62 | 924,665(0.01%)#1,767 |
| 63. | Guttenberg | 77 | 31,183(0.25%)#63 | 924,665(0.01%)#1,769 |
| 64. | Rocky Hill Borough | 77 | 31,183(0.25%)#64 | 924,665(0.01%)#1,773 |
| 65. | The Hills | 76 | 31,183(0.24%)#65 | 924,665(0.01%)#1,786 |
| 66. | Mercerville | 71 | 31,183(0.23%)#66 | 924,665(0.01%)#1,883 |
| 67. | Eatontown Borough | 68 | 31,183(0.22%)#67 | 924,665(0.01%)#1,957 |
| 68. | Totowa Borough | 68 | 31,183(0.22%)#68 | 924,665(0.01%)#1,961 |
| 69. | South Plainfield Borough | 67 | 31,183(0.21%)#69 | 924,665(0.01%)#1,971 |
| 70. | South Amboy | 67 | 31,183(0.21%)#70 | 924,665(0.01%)#1,979 |
| 71. | Rutherford Borough | 66 | 31,183(0.21%)#71 | 924,665(0.01%)#1,997 |
| 72. | Hopatcong Borough | 65 | 31,183(0.21%)#72 | 924,665(0.01%)#2,023 |
| 73. | Metuchen Borough | 64 | 31,183(0.21%)#73 | 924,665(0.01%)#2,047 |
| 74. | Glen Ridge Borough | 64 | 31,183(0.21%)#74 | 924,665(0.01%)#2,054 |
| 75. | Kearny | 63 | 31,183(0.20%)#75 | 924,665(0.01%)#2,063 |
| 76. | Holiday Heights | 63 | 31,183(0.20%)#76 | 924,665(0.01%)#2,091 |
| 77. | Passaic | 62 | 31,183(0.20%)#77 | 924,665(0.01%)#2,095 |
| 78. | Beattystown | 62 | 31,183(0.20%)#78 | 924,665(0.01%)#2,124 |
| 79. | Asbury Park | 61 | 31,183(0.20%)#79 | 924,665(0.01%)#2,148 |
| 80. | Brookdale | 61 | 31,183(0.20%)#80 | 924,665(0.01%)#2,150 |
| 81. | Allendale Borough | 61 | 31,183(0.20%)#81 | 924,665(0.01%)#2,155 |
| 82. | Ledgewood | 61 | 31,183(0.20%)#82 | 924,665(0.01%)#2,158 |
| 83. | Basking Ridge | 60 | 31,183(0.19%)#83 | 924,665(0.01%)#2,183 |
| 84. | Lodi Borough | 59 | 31,183(0.19%)#84 | 924,665(0.01%)#2,199 |
| 85. | Kinnelon Borough | 59 | 31,183(0.19%)#85 | 924,665(0.01%)#2,210 |
| 86. | Woodland Park Borough | 58 | 31,183(0.19%)#86 | 924,665(0.01%)#2,237 |
| 87. | Cherry Hill Mall | 58 | 31,183(0.19%)#87 | 924,665(0.01%)#2,238 |
| 88. | Haddonfield Borough | 58 | 31,183(0.19%)#88 | 924,665(0.01%)#2,240 |
| 89. | Park Ridge Borough | 58 | 31,183(0.19%)#89 | 924,665(0.01%)#2,244 |
| 90. | Englewood | 57 | 31,183(0.18%)#90 | 924,665(0.01%)#2,253 |
| 91. | Burlington | 57 | 31,183(0.18%)#91 | 924,665(0.01%)#2,267 |
| 92. | Cresskill Borough | 57 | 31,183(0.18%)#92 | 924,665(0.01%)#2,269 |
| 93. | Pines Lake | 57 | 31,183(0.18%)#93 | 924,665(0.01%)#2,277 |
| 94. | Sayreville Borough | 56 | 31,183(0.18%)#94 | 924,665(0.01%)#2,284 |
| 95. | Harrison | 56 | 31,183(0.18%)#95 | 924,665(0.01%)#2,293 |
| 96. | Martinsville | 56 | 31,183(0.18%)#96 | 924,665(0.01%)#2,299 |
| 97. | Chatham Borough | 56 | 31,183(0.18%)#97 | 924,665(0.01%)#2,305 |
| 98. | East Orange | 55 | 31,183(0.18%)#98 | 924,665(0.01%)#2,320 |
| 99. | Springdale | 54 | 31,183(0.17%)#99 | 924,665(0.01%)#2,366 |
| 100. | Westmont | 53 | 31,183(0.17%)#100 | 924,665(0.01%)#2,398 |
Common Questions
What are the Top 10 Cities with the Most Immigrants from Western Europe in New Jersey?
Top 10 Cities with the Most Immigrants from Western Europe in New Jersey are:
#1
1,441
#2
935
#3
437
#4
381
#5
261
#6
259
#7
259
#8
249
#9
219
#10
217
What city has the Most Immigrants from Western Europe in New Jersey?
Jersey City has the Most Immigrants from Western Europe in New Jersey with 1,441.
What is the Total Immigrants from Western Europe in the State of New Jersey?
Total Immigrants from Western Europe in New Jersey is 31,183.
What is the Total Immigrants from Western Europe in the United States?
Total Immigrants from Western Europe in the United States is 924,665.