Cities with the Highest Percentage of Egyptian Population in New Jersey
RELATED REPORTS & OPTIONS
Egyptian
New Jersey
Compare Cities
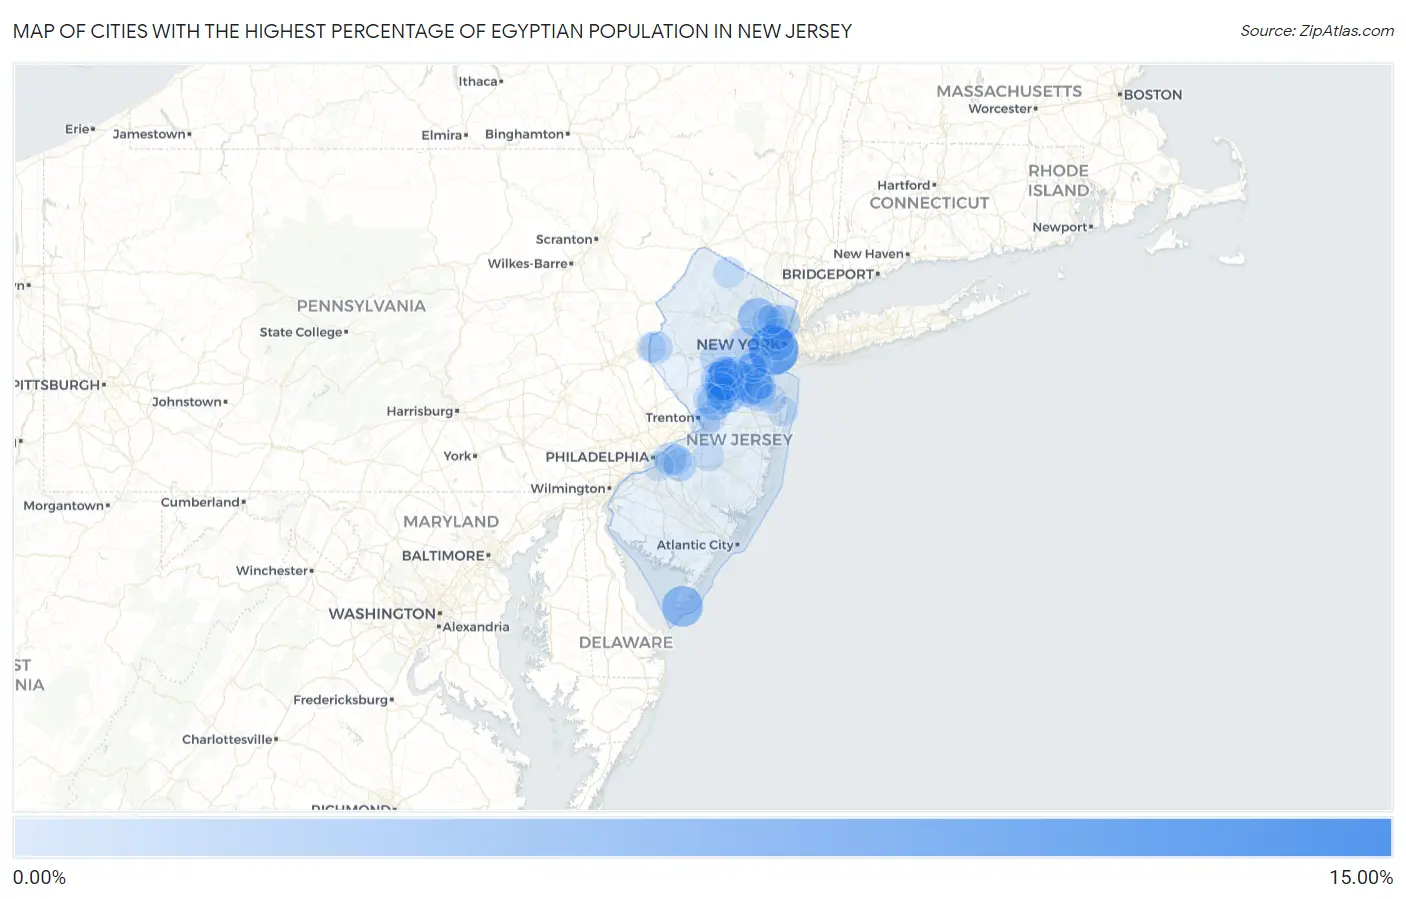
Map of Cities with the Highest Percentage of Egyptian Population in New Jersey
0.00%
15.00%
Cities with the Highest Percentage of Egyptian Population in New Jersey
| City | Egyptian | vs State | vs National | |
| 1. | Union Beach Borough | 10.02% | 0.50%(+9.52)#1 | 0.093%(+9.92)#6 |
| 2. | Andover Borough | 8.97% | 0.50%(+8.47)#2 | 0.093%(+8.88)#7 |
| 3. | Bayonne | 8.20% | 0.50%(+7.70)#3 | 0.093%(+8.11)#10 |
| 4. | Milltown Borough | 7.17% | 0.50%(+6.67)#4 | 0.093%(+7.07)#11 |
| 5. | Voorhees | 6.12% | 0.50%(+5.62)#5 | 0.093%(+6.02)#13 |
| 6. | Dunellen Borough | 4.67% | 0.50%(+4.17)#6 | 0.093%(+4.58)#18 |
| 7. | Cape May | 4.65% | 0.50%(+4.15)#7 | 0.093%(+4.56)#19 |
| 8. | Tinton Falls Borough | 4.45% | 0.50%(+3.95)#8 | 0.093%(+4.36)#22 |
| 9. | Helmetta Borough | 4.39% | 0.50%(+3.89)#9 | 0.093%(+4.29)#24 |
| 10. | Madison Park | 4.25% | 0.50%(+3.75)#10 | 0.093%(+4.15)#26 |
| 11. | Six Mile Run | 4.19% | 0.50%(+3.69)#11 | 0.093%(+4.09)#27 |
| 12. | Singac | 4.02% | 0.50%(+3.52)#12 | 0.093%(+3.93)#30 |
| 13. | Mount Arlington Borough | 3.53% | 0.50%(+3.03)#13 | 0.093%(+3.44)#35 |
| 14. | Middlesex Borough | 3.08% | 0.50%(+2.58)#14 | 0.093%(+2.98)#41 |
| 15. | Deal Borough | 2.95% | 0.50%(+2.45)#15 | 0.093%(+2.85)#45 |
| 16. | Fairview Borough | 2.81% | 0.50%(+2.31)#16 | 0.093%(+2.71)#49 |
| 17. | Dayton | 2.80% | 0.50%(+2.30)#17 | 0.093%(+2.71)#51 |
| 18. | Ho Ho Kus Borough | 2.74% | 0.50%(+2.24)#18 | 0.093%(+2.65)#53 |
| 19. | Princeton Junction | 2.67% | 0.50%(+2.17)#19 | 0.093%(+2.58)#55 |
| 20. | Moonachie Borough | 2.65% | 0.50%(+2.15)#20 | 0.093%(+2.56)#57 |
| 21. | Little Ferry Borough | 2.60% | 0.50%(+2.10)#21 | 0.093%(+2.51)#60 |
| 22. | Preakness | 2.58% | 0.50%(+2.08)#22 | 0.093%(+2.49)#62 |
| 23. | Menlo Park Terrace | 2.50% | 0.50%(+2.00)#23 | 0.093%(+2.41)#65 |
| 24. | North Arlington Borough | 2.38% | 0.50%(+1.88)#24 | 0.093%(+2.29)#68 |
| 25. | Ridgefield Park | 2.38% | 0.50%(+1.88)#25 | 0.093%(+2.28)#69 |
| 26. | Monroe Manor | 2.28% | 0.50%(+1.78)#26 | 0.093%(+2.18)#76 |
| 27. | Bridgewater Center | 2.05% | 0.50%(+1.55)#27 | 0.093%(+1.95)#82 |
| 28. | Blackwells Mills | 1.96% | 0.50%(+1.46)#28 | 0.093%(+1.87)#86 |
| 29. | South River Borough | 1.87% | 0.50%(+1.37)#29 | 0.093%(+1.78)#98 |
| 30. | Jersey City | 1.87% | 0.50%(+1.37)#30 | 0.093%(+1.78)#99 |
| 31. | Sayreville Borough | 1.79% | 0.50%(+1.30)#31 | 0.093%(+1.70)#106 |
| 32. | Cherry Hill Mall | 1.64% | 0.50%(+1.15)#32 | 0.093%(+1.55)#114 |
| 33. | Marlton | 1.63% | 0.50%(+1.14)#33 | 0.093%(+1.54)#117 |
| 34. | Fords | 1.61% | 0.50%(+1.11)#34 | 0.093%(+1.52)#121 |
| 35. | Monmouth Junction | 1.59% | 0.50%(+1.09)#35 | 0.093%(+1.50)#122 |
| 36. | Strathmore | 1.56% | 0.50%(+1.07)#36 | 0.093%(+1.47)#126 |
| 37. | Green Knoll | 1.55% | 0.50%(+1.05)#37 | 0.093%(+1.46)#127 |
| 38. | Greenwich | 1.54% | 0.50%(+1.04)#38 | 0.093%(+1.44)#128 |
| 39. | Morganville | 1.53% | 0.50%(+1.03)#39 | 0.093%(+1.44)#129 |
| 40. | Franklin Park | 1.44% | 0.50%(+0.939)#40 | 0.093%(+1.34)#142 |
| 41. | Summit | 1.39% | 0.50%(+0.893)#41 | 0.093%(+1.30)#146 |
| 42. | Jamesburg Borough | 1.37% | 0.50%(+0.867)#42 | 0.093%(+1.27)#154 |
| 43. | Glen Ridge Borough | 1.31% | 0.50%(+0.809)#43 | 0.093%(+1.21)#160 |
| 44. | Old Bridge | 1.30% | 0.50%(+0.800)#44 | 0.093%(+1.21)#162 |
| 45. | Franklin Lakes Borough | 1.29% | 0.50%(+0.791)#45 | 0.093%(+1.20)#163 |
| 46. | Mckee | 1.24% | 0.50%(+0.745)#46 | 0.093%(+1.15)#169 |
| 47. | Shrewsbury Borough | 1.21% | 0.50%(+0.709)#47 | 0.093%(+1.11)#173 |
| 48. | Ten Mile Run | 1.20% | 0.50%(+0.706)#48 | 0.093%(+1.11)#175 |
| 49. | Allendale Borough | 1.20% | 0.50%(+0.704)#49 | 0.093%(+1.11)#176 |
| 50. | Garwood Borough | 1.17% | 0.50%(+0.668)#50 | 0.093%(+1.07)#184 |
| 51. | West Long Branch Borough | 1.15% | 0.50%(+0.648)#51 | 0.093%(+1.05)#186 |
| 52. | Kendall Park | 1.13% | 0.50%(+0.630)#52 | 0.093%(+1.04)#190 |
| 53. | Englishtown Borough | 1.13% | 0.50%(+0.628)#53 | 0.093%(+1.03)#192 |
| 54. | Avenel | 1.09% | 0.50%(+0.593)#54 | 0.093%(+0.999)#196 |
| 55. | Old Tappan Borough | 1.09% | 0.50%(+0.593)#55 | 0.093%(+0.998)#197 |
| 56. | Pine Beach Borough | 1.08% | 0.50%(+0.583)#56 | 0.093%(+0.989)#198 |
| 57. | Clifton | 1.05% | 0.50%(+0.550)#57 | 0.093%(+0.955)#209 |
| 58. | Woodstown Borough | 1.03% | 0.50%(+0.534)#58 | 0.093%(+0.939)#214 |
| 59. | Ramblewood | 1.01% | 0.50%(+0.514)#59 | 0.093%(+0.919)#220 |
| 60. | Pines Lake | 0.99% | 0.50%(+0.490)#60 | 0.093%(+0.895)#226 |
| 61. | Lodi Borough | 0.98% | 0.50%(+0.483)#61 | 0.093%(+0.889)#229 |
| 62. | Hillsborough | 0.94% | 0.50%(+0.443)#62 | 0.093%(+0.849)#247 |
| 63. | Hamilton Square | 0.94% | 0.50%(+0.443)#63 | 0.093%(+0.848)#248 |
| 64. | Vernon Center | 0.94% | 0.50%(+0.439)#64 | 0.093%(+0.844)#249 |
| 65. | Seaside Heights Borough | 0.94% | 0.50%(+0.438)#65 | 0.093%(+0.844)#250 |
| 66. | Cliffwood Beach | 0.93% | 0.50%(+0.432)#66 | 0.093%(+0.837)#253 |
| 67. | Secaucus | 0.92% | 0.50%(+0.418)#67 | 0.093%(+0.824)#255 |
| 68. | Haworth Borough | 0.90% | 0.50%(+0.399)#68 | 0.093%(+0.804)#263 |
| 69. | Princeton | 0.90% | 0.50%(+0.397)#69 | 0.093%(+0.803)#264 |
| 70. | Upper Saddle River Borough | 0.87% | 0.50%(+0.367)#70 | 0.093%(+0.773)#276 |
| 71. | Seaside Park Borough | 0.83% | 0.50%(+0.335)#71 | 0.093%(+0.740)#285 |
| 72. | Fieldsboro Borough | 0.82% | 0.50%(+0.321)#72 | 0.093%(+0.726)#290 |
| 73. | Saddle River Borough | 0.80% | 0.50%(+0.304)#73 | 0.093%(+0.709)#296 |
| 74. | New Providence Borough | 0.78% | 0.50%(+0.281)#74 | 0.093%(+0.686)#309 |
| 75. | Wallington Borough | 0.74% | 0.50%(+0.244)#75 | 0.093%(+0.650)#319 |
| 76. | Fair Lawn Borough | 0.74% | 0.50%(+0.236)#76 | 0.093%(+0.642)#321 |
| 77. | Ridgefield Borough | 0.73% | 0.50%(+0.234)#77 | 0.093%(+0.639)#323 |
| 78. | White Horse | 0.72% | 0.50%(+0.223)#78 | 0.093%(+0.629)#329 |
| 79. | Pemberton Heights | 0.72% | 0.50%(+0.221)#79 | 0.093%(+0.627)#331 |
| 80. | Emerson Borough | 0.71% | 0.50%(+0.215)#80 | 0.093%(+0.621)#334 |
| 81. | Franklin Center | 0.70% | 0.50%(+0.199)#81 | 0.093%(+0.605)#339 |
| 82. | Closter Borough | 0.67% | 0.50%(+0.167)#82 | 0.093%(+0.573)#362 |
| 83. | Barrington Borough | 0.66% | 0.50%(+0.156)#83 | 0.093%(+0.562)#370 |
| 84. | Oakhurst | 0.64% | 0.50%(+0.140)#84 | 0.093%(+0.546)#382 |
| 85. | Atlantic Highlands Borough | 0.64% | 0.50%(+0.136)#85 | 0.093%(+0.542)#388 |
| 86. | Montvale Borough | 0.62% | 0.50%(+0.119)#86 | 0.093%(+0.525)#397 |
| 87. | Spotswood Borough | 0.60% | 0.50%(+0.103)#87 | 0.093%(+0.509)#407 |
| 88. | Norwood Borough | 0.60% | 0.50%(+0.102)#88 | 0.093%(+0.508)#409 |
| 89. | Phillipsburg | 0.60% | 0.50%(+0.099)#89 | 0.093%(+0.505)#411 |
| 90. | Lincoln Park Borough | 0.60% | 0.50%(+0.098)#90 | 0.093%(+0.504)#412 |
| 91. | Somerset | 0.59% | 0.50%(+0.095)#91 | 0.093%(+0.500)#414 |
| 92. | Garfield | 0.59% | 0.50%(+0.089)#92 | 0.093%(+0.495)#422 |
| 93. | Pompton Lakes Borough | 0.58% | 0.50%(+0.080)#93 | 0.093%(+0.486)#428 |
| 94. | South Bound Brook Borough | 0.56% | 0.50%(+0.059)#94 | 0.093%(+0.465)#444 |
| 95. | Gloucester City | 0.54% | 0.50%(+0.043)#95 | 0.093%(+0.449)#463 |
| 96. | Lincroft | 0.53% | 0.50%(+0.031)#96 | 0.093%(+0.437)#471 |
| 97. | Woodbridge | 0.51% | 0.50%(+0.007)#97 | 0.093%(+0.413)#486 |
| 98. | Monmouth Beach Borough | 0.50% | 0.50%(+0.001)#98 | 0.093%(+0.407)#490 |
| 99. | Freehold Borough | 0.49% | 0.50%(-0.011)#99 | 0.093%(+0.395)#504 |
| 100. | Princeton Meadows | 0.47% | 0.50%(-0.031)#100 | 0.093%(+0.375)#518 |
Common Questions
What are the Top 10 Cities with the Highest Percentage of Egyptian Population in New Jersey?
Top 10 Cities with the Highest Percentage of Egyptian Population in New Jersey are:
#1
8.20%
#2
6.12%
#3
4.65%
#4
4.25%
#5
4.19%
#6
4.02%
#7
2.80%
#8
2.67%
#9
2.38%
#10
1.96%
What city has the Highest Percentage of Egyptian Population in New Jersey?
Bayonne has the Highest Percentage of Egyptian Population in New Jersey with 8.20%.
What is the Percentage of Egyptian Population in the State of New Jersey?
Percentage of Egyptian Population in New Jersey is 0.50%.
What is the Percentage of Egyptian Population in the United States?
Percentage of Egyptian Population in the United States is 0.093%.