Cities with the Highest Percentage of Black / African American Population in New Jersey
RELATED REPORTS & OPTIONS
Black / African American
New Jersey
Compare Cities
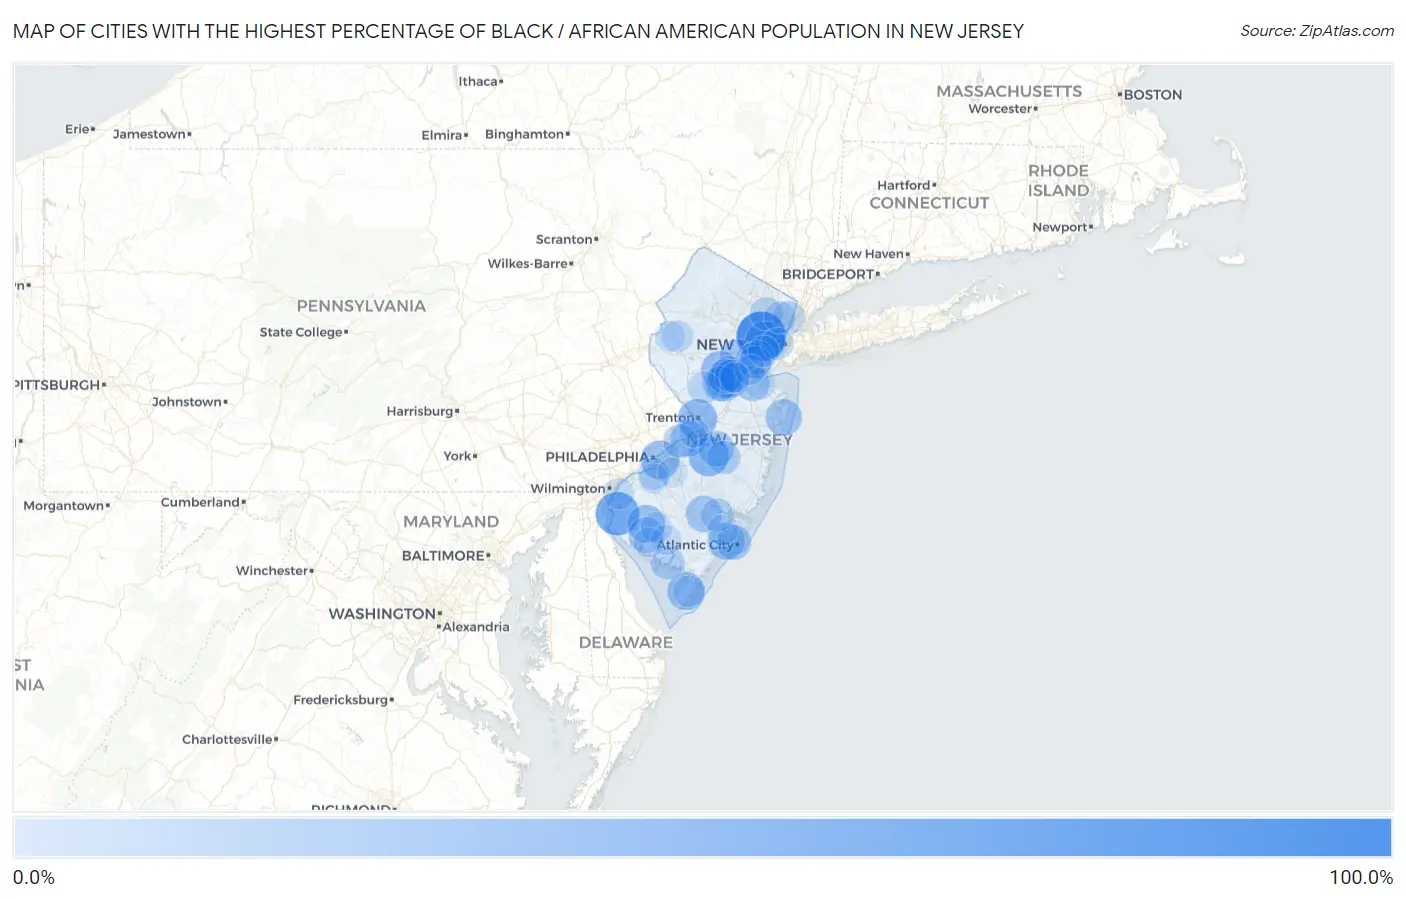
Map of Cities with the Highest Percentage of Black / African American Population in New Jersey
0.0%
100.0%
Cities with the Highest Percentage of Black / African American Population in New Jersey
| City | Black / African American | vs State | vs National | |
| 1. | East Orange | 80.6% | 13.1%(+67.5)#1 | 12.5%(+68.2)#374 |
| 2. | Lawnside Borough | 78.0% | 13.1%(+64.9)#2 | 12.5%(+65.6)#435 |
| 3. | Vauxhall | 75.9% | 13.1%(+62.8)#3 | 12.5%(+63.4)#476 |
| 4. | Gouldtown | 66.9% | 13.1%(+53.8)#4 | 12.5%(+54.5)#688 |
| 5. | Salem | 59.7% | 13.1%(+46.5)#5 | 12.5%(+47.2)#908 |
| 6. | Heislerville | 51.8% | 13.1%(+38.7)#6 | 12.5%(+39.3)#1,176 |
| 7. | Pemberton Heights | 48.0% | 13.1%(+34.9)#7 | 12.5%(+35.5)#1,318 |
| 8. | Union | 47.6% | 13.1%(+34.5)#8 | 12.5%(+35.1)#1,340 |
| 9. | Newark | 47.0% | 13.1%(+33.9)#9 | 12.5%(+34.6)#1,376 |
| 10. | Kean University | 46.1% | 13.1%(+33.0)#10 | 12.5%(+33.6)#1,422 |
| 11. | Trenton | 45.5% | 13.1%(+32.4)#11 | 12.5%(+33.0)#1,449 |
| 12. | Roselle Borough | 45.3% | 13.1%(+32.2)#12 | 12.5%(+32.9)#1,458 |
| 13. | Camden | 42.9% | 13.1%(+29.8)#13 | 12.5%(+30.4)#1,582 |
| 14. | Paulsboro Borough | 42.1% | 13.1%(+29.0)#14 | 12.5%(+29.7)#1,621 |
| 15. | Voorhees | 41.9% | 13.1%(+28.8)#15 | 12.5%(+29.4)#1,638 |
| 16. | Penns Grove Borough | 41.7% | 13.1%(+28.6)#16 | 12.5%(+29.3)#1,646 |
| 17. | Lamington | 40.7% | 13.1%(+27.6)#17 | 12.5%(+28.2)#1,700 |
| 18. | Zarephath | 40.5% | 13.1%(+27.4)#18 | 12.5%(+28.1)#1,706 |
| 19. | Chesilhurst Borough | 40.5% | 13.1%(+27.3)#19 | 12.5%(+28.0)#1,710 |
| 20. | Wrightstown Borough | 40.0% | 13.1%(+26.9)#20 | 12.5%(+27.6)#1,737 |
| 21. | Whitesboro | 40.0% | 13.1%(+26.9)#21 | 12.5%(+27.5)#1,744 |
| 22. | Seabrook Farms | 39.8% | 13.1%(+26.7)#22 | 12.5%(+27.3)#1,755 |
| 23. | William Paterson University Of New Jersey | 37.6% | 13.1%(+24.5)#23 | 12.5%(+25.2)#1,871 |
| 24. | Pleasantville | 37.4% | 13.1%(+24.2)#24 | 12.5%(+24.9)#1,887 |
| 25. | Sicklerville | 37.3% | 13.1%(+24.2)#25 | 12.5%(+24.8)#1,891 |
| 26. | Watsessing | 35.9% | 13.1%(+22.8)#26 | 12.5%(+23.4)#1,979 |
| 27. | Plainfield | 35.9% | 13.1%(+22.8)#27 | 12.5%(+23.4)#1,982 |
| 28. | Asbury Park | 35.8% | 13.1%(+22.7)#28 | 12.5%(+23.4)#1,986 |
| 29. | Carlls Corner | 35.3% | 13.1%(+22.2)#29 | 12.5%(+22.9)#2,013 |
| 30. | Burlington | 34.3% | 13.1%(+21.2)#30 | 12.5%(+21.9)#2,065 |
| 31. | Elwood | 34.3% | 13.1%(+21.2)#31 | 12.5%(+21.8)#2,068 |
| 32. | Six Mile Run | 33.9% | 13.1%(+20.8)#32 | 12.5%(+21.4)#2,093 |
| 33. | Fort Dix | 33.2% | 13.1%(+20.1)#33 | 12.5%(+20.7)#2,135 |
| 34. | Bridgeton | 33.2% | 13.1%(+20.0)#34 | 12.5%(+20.7)#2,141 |
| 35. | Lindenwold Borough | 32.6% | 13.1%(+19.5)#35 | 12.5%(+20.1)#2,175 |
| 36. | Franklin Park | 32.6% | 13.1%(+19.5)#36 | 12.5%(+20.1)#2,178 |
| 37. | Rahway | 31.8% | 13.1%(+18.7)#37 | 12.5%(+19.3)#2,220 |
| 38. | Somerset | 31.4% | 13.1%(+18.3)#38 | 12.5%(+18.9)#2,251 |
| 39. | Atlantic City | 30.4% | 13.1%(+17.3)#39 | 12.5%(+17.9)#2,332 |
| 40. | Newtonville | 30.2% | 13.1%(+17.1)#40 | 12.5%(+17.7)#2,345 |
| 41. | Pleasant Plains | 29.9% | 13.1%(+16.8)#41 | 12.5%(+17.4)#2,363 |
| 42. | Ampere North | 29.7% | 13.1%(+16.6)#42 | 12.5%(+17.2)#2,386 |
| 43. | Somerdale Borough | 29.5% | 13.1%(+16.4)#43 | 12.5%(+17.0)#2,397 |
| 44. | Madison Park | 29.3% | 13.1%(+16.2)#44 | 12.5%(+16.9)#2,407 |
| 45. | Middlebush | 28.4% | 13.1%(+15.2)#45 | 12.5%(+15.9)#2,484 |
| 46. | Linden | 28.3% | 13.1%(+15.2)#46 | 12.5%(+15.9)#2,485 |
| 47. | South Toms River Borough | 27.7% | 13.1%(+14.5)#47 | 12.5%(+15.2)#2,522 |
| 48. | Pine Hill Borough | 27.4% | 13.1%(+14.2)#48 | 12.5%(+14.9)#2,546 |
| 49. | Port Norris | 26.7% | 13.1%(+13.5)#49 | 12.5%(+14.2)#2,596 |
| 50. | Beverly | 26.0% | 13.1%(+12.9)#50 | 12.5%(+13.5)#2,662 |
| 51. | Neptune City Borough | 25.7% | 13.1%(+12.6)#51 | 12.5%(+13.3)#2,685 |
| 52. | Goshen | 25.5% | 13.1%(+12.4)#52 | 12.5%(+13.0)#2,716 |
| 53. | East Franklin | 24.9% | 13.1%(+11.8)#53 | 12.5%(+12.5)#2,769 |
| 54. | Country Lake Estates | 24.8% | 13.1%(+11.7)#54 | 12.5%(+12.3)#2,784 |
| 55. | Egg Harbor City | 24.5% | 13.1%(+11.4)#55 | 12.5%(+12.0)#2,808 |
| 56. | Paterson | 24.4% | 13.1%(+11.3)#56 | 12.5%(+11.9)#2,818 |
| 57. | Avenel | 23.7% | 13.1%(+10.6)#57 | 12.5%(+11.3)#2,874 |
| 58. | Englewood | 23.4% | 13.1%(+10.3)#58 | 12.5%(+10.9)#2,918 |
| 59. | Woodlynne Borough | 22.5% | 13.1%(+9.40)#59 | 12.5%(+10.1)#3,019 |
| 60. | North Plainfield Borough | 22.1% | 13.1%(+9.03)#60 | 12.5%(+9.68)#3,059 |
| 61. | Woodbine Borough | 21.6% | 13.1%(+8.44)#61 | 12.5%(+9.08)#3,120 |
| 62. | Skillman | 21.5% | 13.1%(+8.43)#62 | 12.5%(+9.08)#3,121 |
| 63. | Jersey City | 21.5% | 13.1%(+8.40)#63 | 12.5%(+9.05)#3,126 |
| 64. | Bargaintown | 20.9% | 13.1%(+7.78)#64 | 12.5%(+8.43)#3,197 |
| 65. | Woodbury | 20.9% | 13.1%(+7.77)#65 | 12.5%(+8.42)#3,199 |
| 66. | Clementon Borough | 20.9% | 13.1%(+7.76)#66 | 12.5%(+8.41)#3,200 |
| 67. | Clayton Borough | 20.8% | 13.1%(+7.65)#67 | 12.5%(+8.30)#3,211 |
| 68. | Hackensack | 20.4% | 13.1%(+7.30)#68 | 12.5%(+7.95)#3,253 |
| 69. | Port Colden | 19.6% | 13.1%(+6.44)#69 | 12.5%(+7.09)#3,356 |
| 70. | Rosenhayn | 18.8% | 13.1%(+5.72)#70 | 12.5%(+6.36)#3,450 |
| 71. | Burleigh | 18.7% | 13.1%(+5.61)#71 | 12.5%(+6.26)#3,464 |
| 72. | Magnolia Borough | 18.4% | 13.1%(+5.33)#72 | 12.5%(+5.98)#3,510 |
| 73. | Westville Borough | 18.2% | 13.1%(+5.10)#73 | 12.5%(+5.75)#3,550 |
| 74. | Carneys Point | 18.0% | 13.1%(+4.91)#74 | 12.5%(+5.56)#3,577 |
| 75. | Cliffwood Beach | 17.9% | 13.1%(+4.77)#75 | 12.5%(+5.42)#3,596 |
| 76. | Elizabeth | 17.8% | 13.1%(+4.64)#76 | 12.5%(+5.29)#3,610 |
| 77. | Glassboro Borough | 17.7% | 13.1%(+4.54)#77 | 12.5%(+5.18)#3,624 |
| 78. | Silver Lake Cdp Essex County | 17.2% | 13.1%(+4.10)#78 | 12.5%(+4.75)#3,685 |
| 79. | Cologne | 17.2% | 13.1%(+4.07)#79 | 12.5%(+4.72)#3,696 |
| 80. | Prospect Park Borough | 17.1% | 13.1%(+4.00)#80 | 12.5%(+4.64)#3,714 |
| 81. | Port Morris | 17.0% | 13.1%(+3.91)#81 | 12.5%(+4.56)#3,733 |
| 82. | Pomona | 16.9% | 13.1%(+3.78)#82 | 12.5%(+4.43)#3,755 |
| 83. | Brass Castle | 16.3% | 13.1%(+3.20)#83 | 12.5%(+3.85)#3,847 |
| 84. | Carteret Borough | 16.3% | 13.1%(+3.16)#84 | 12.5%(+3.81)#3,854 |
| 85. | South Bound Brook Borough | 16.1% | 13.1%(+2.94)#85 | 12.5%(+3.59)#3,901 |
| 86. | Haledon Borough | 15.9% | 13.1%(+2.80)#86 | 12.5%(+3.45)#3,925 |
| 87. | Millville | 15.6% | 13.1%(+2.51)#87 | 12.5%(+3.15)#3,976 |
| 88. | Montclair State University | 15.3% | 13.1%(+2.23)#88 | 12.5%(+2.87)#4,028 |
| 89. | Fords | 15.3% | 13.1%(+2.18)#89 | 12.5%(+2.83)#4,035 |
| 90. | Mckee | 15.1% | 13.1%(+2.02)#90 | 12.5%(+2.67)#4,071 |
| 91. | Fairton | 15.0% | 13.1%(+1.84)#91 | 12.5%(+2.49)#4,106 |
| 92. | Palmyra Borough | 14.9% | 13.1%(+1.75)#92 | 12.5%(+2.40)#4,128 |
| 93. | Hi Nella Borough | 14.8% | 13.1%(+1.72)#93 | 12.5%(+2.37)#4,135 |
| 94. | New Brunswick | 14.8% | 13.1%(+1.64)#94 | 12.5%(+2.29)#4,148 |
| 95. | Florence | 14.6% | 13.1%(+1.52)#95 | 12.5%(+2.17)#4,175 |
| 96. | Swedesboro Borough | 14.6% | 13.1%(+1.52)#96 | 12.5%(+2.16)#4,177 |
| 97. | Oak Valley | 14.4% | 13.1%(+1.24)#97 | 12.5%(+1.89)#4,229 |
| 98. | Ramapo College Of New Jersey | 14.3% | 13.1%(+1.19)#98 | 12.5%(+1.84)#4,240 |
| 99. | Echelon | 14.1% | 13.1%(+0.975)#99 | 12.5%(+1.62)#4,280 |
| 100. | Stockton University | 14.1% | 13.1%(+0.961)#100 | 12.5%(+1.61)#4,286 |
Common Questions
What are the Top 10 Cities with the Highest Percentage of Black / African American Population in New Jersey?
Top 10 Cities with the Highest Percentage of Black / African American Population in New Jersey are:
#1
80.6%
#2
59.7%
#3
48.0%
#4
47.0%
#5
45.5%
#6
42.9%
#7
41.9%
#8
40.5%
#9
40.0%
#10
39.8%
What city has the Highest Percentage of Black / African American Population in New Jersey?
East Orange has the Highest Percentage of Black / African American Population in New Jersey with 80.6%.
What is the Percentage of Black / African American Population in the State of New Jersey?
Percentage of Black / African American Population in New Jersey is 13.1%.
What is the Percentage of Black / African American Population in the United States?
Percentage of Black / African American Population in the United States is 12.5%.